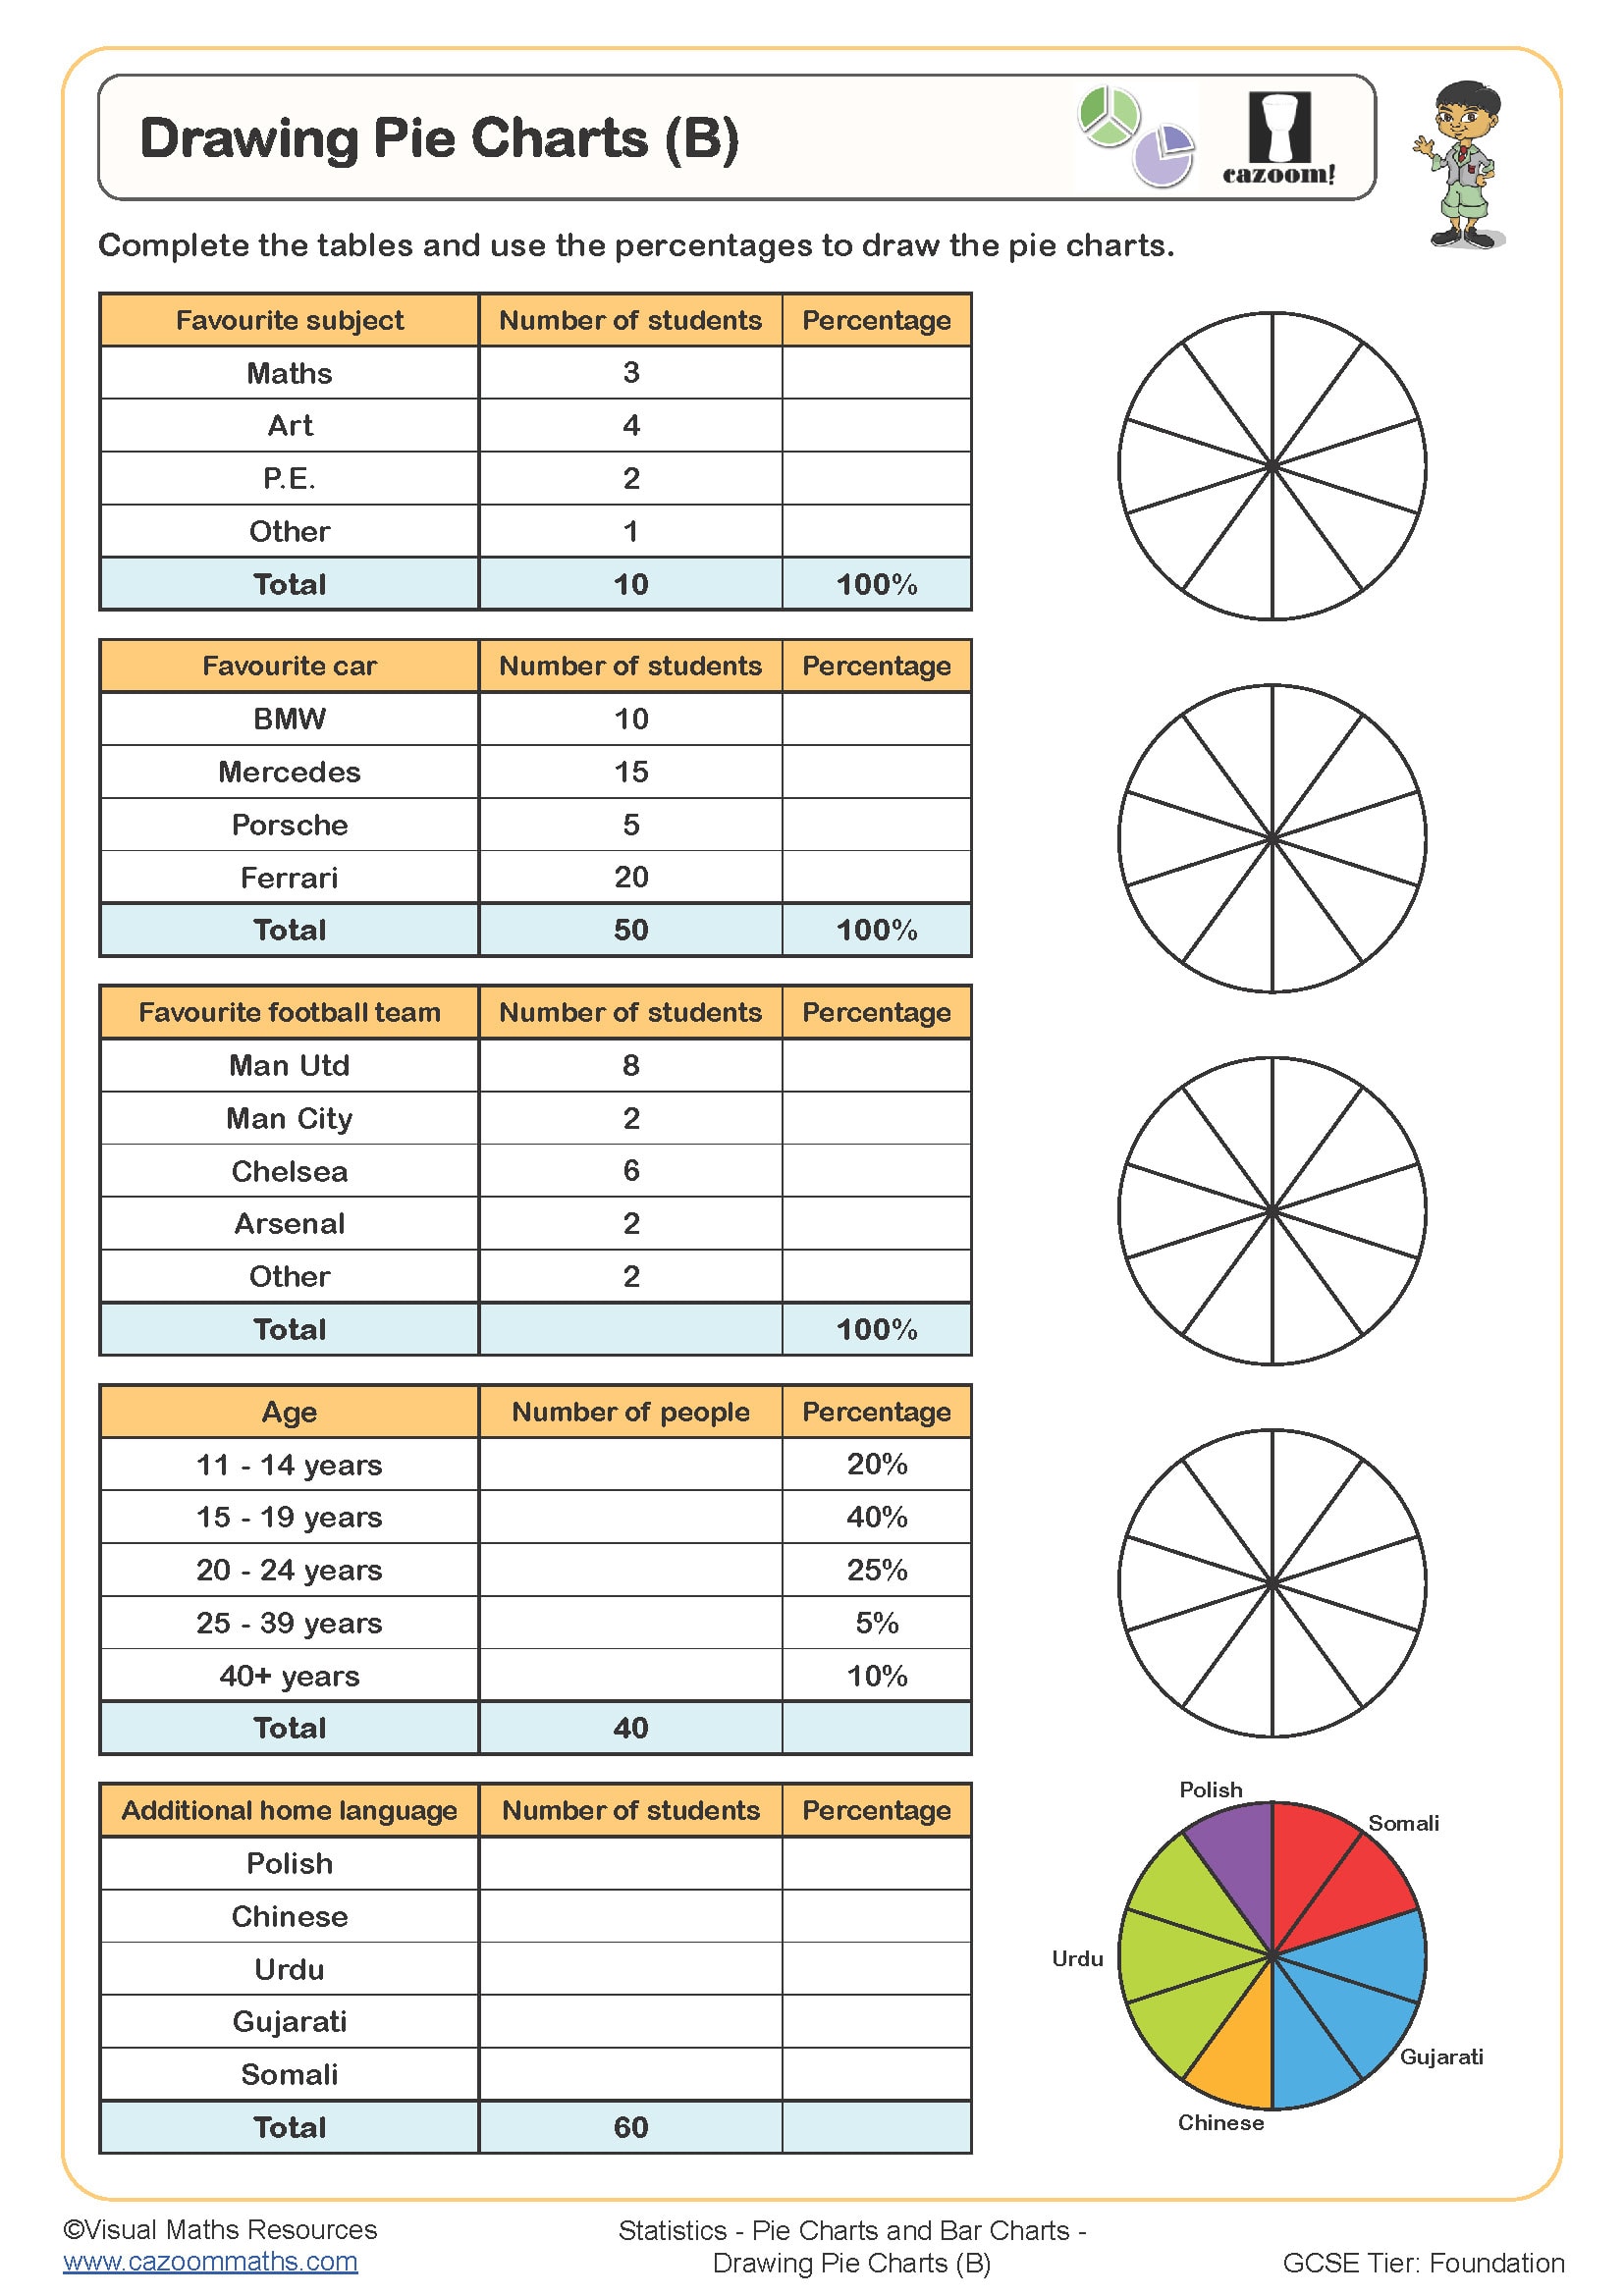
This worksheet provides some tables of information that can be presented as pie charts by shading sectors. Each pie chart is split into tenths and learners will need to work out the number of sections using percentages from the data in each table. This worksheet can be used after by Drawing Pie Charts (A).

