Drawing Pie Charts (C) WORKSHEET
Drawing Pie Charts (C) WORKSHEET DESCRIPTION
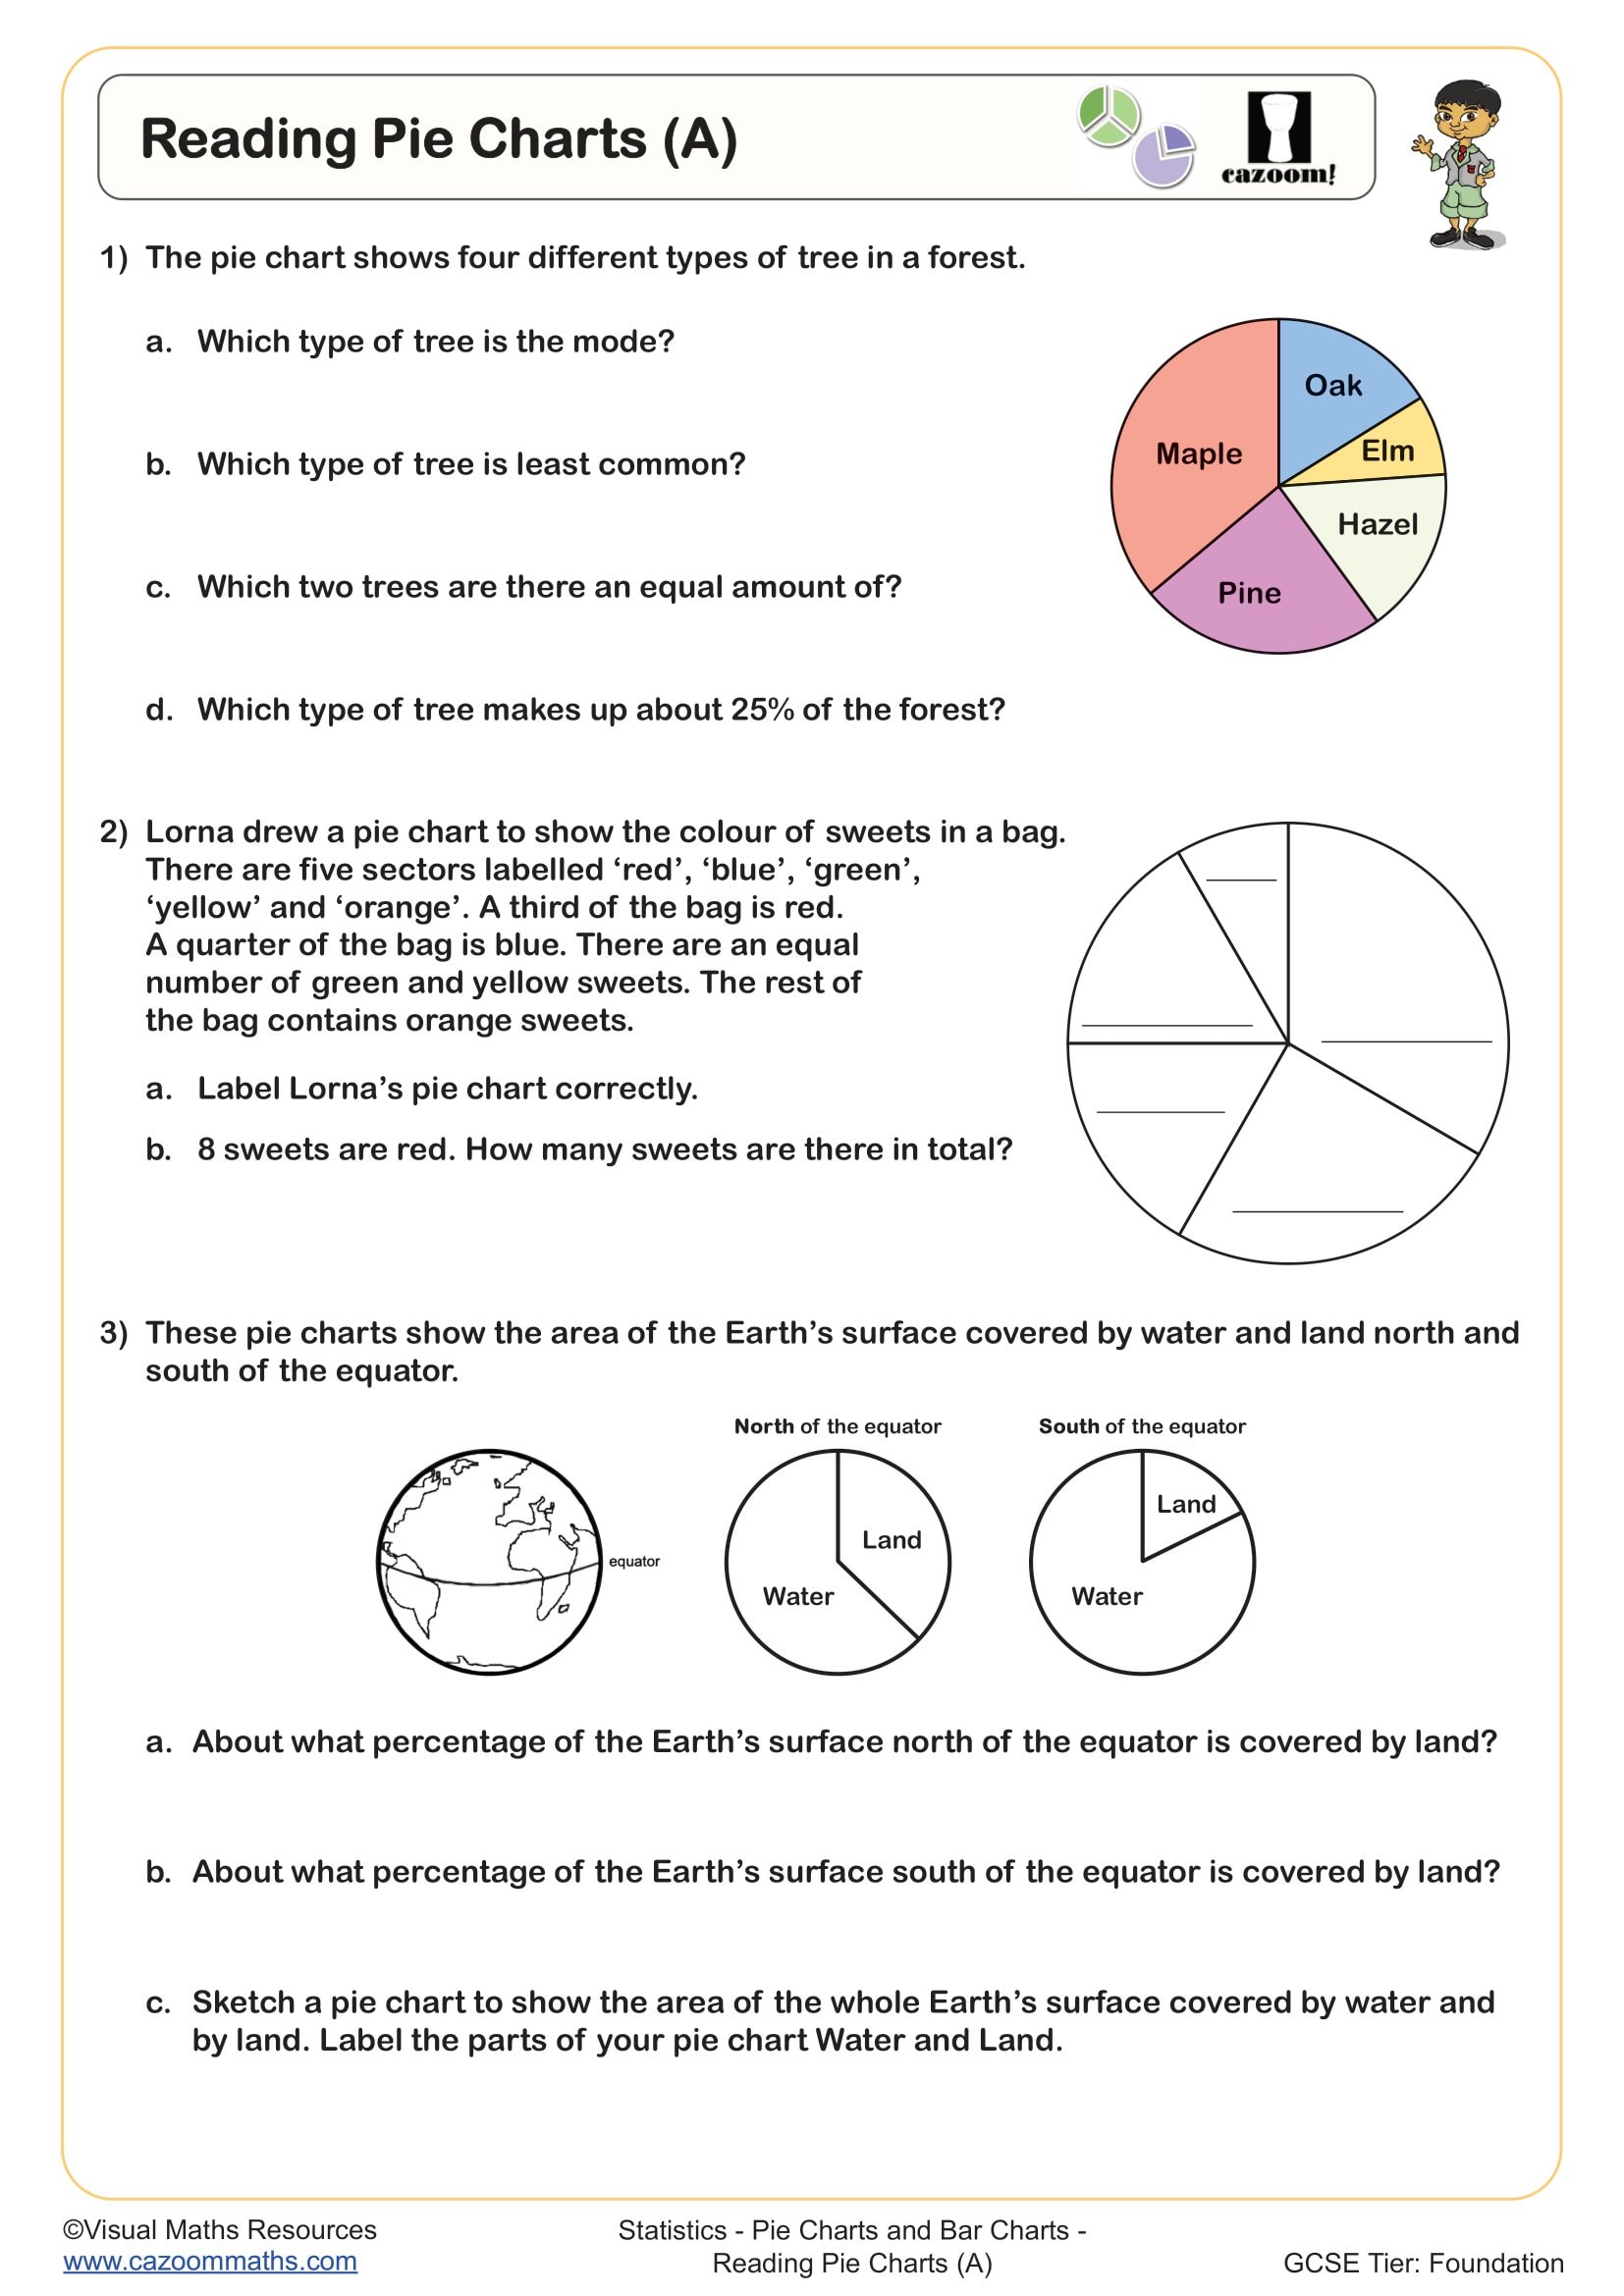
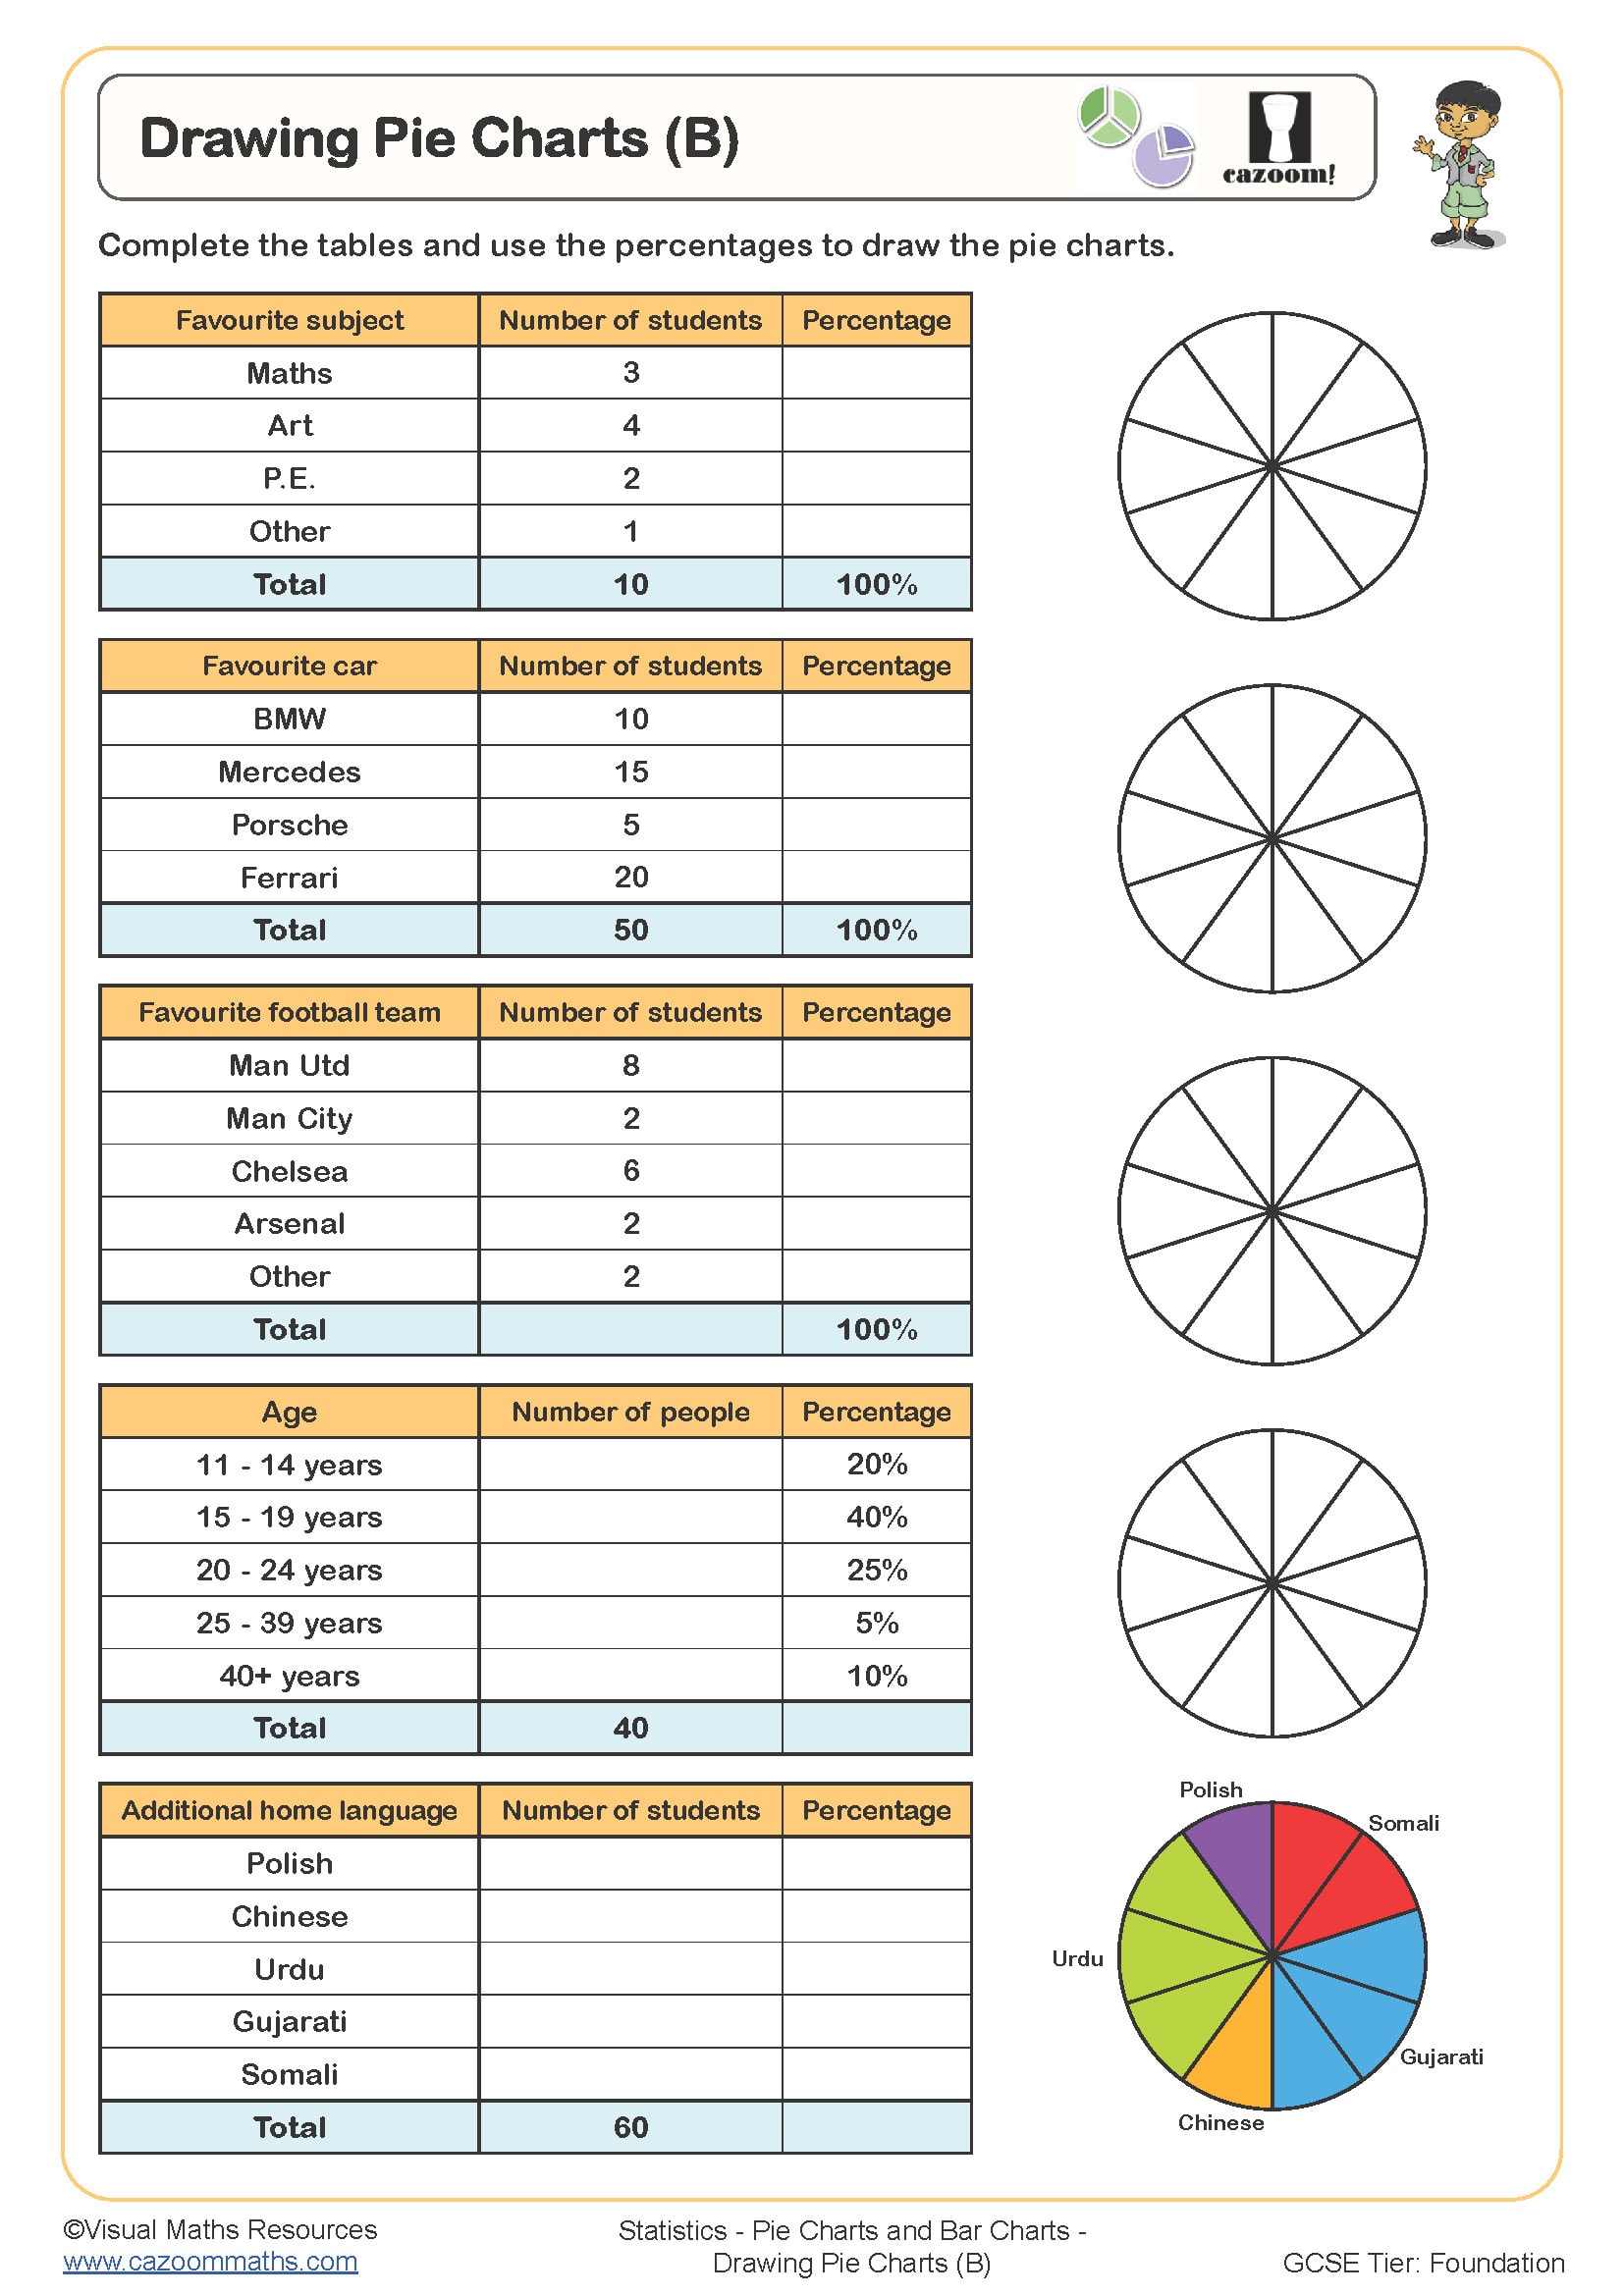
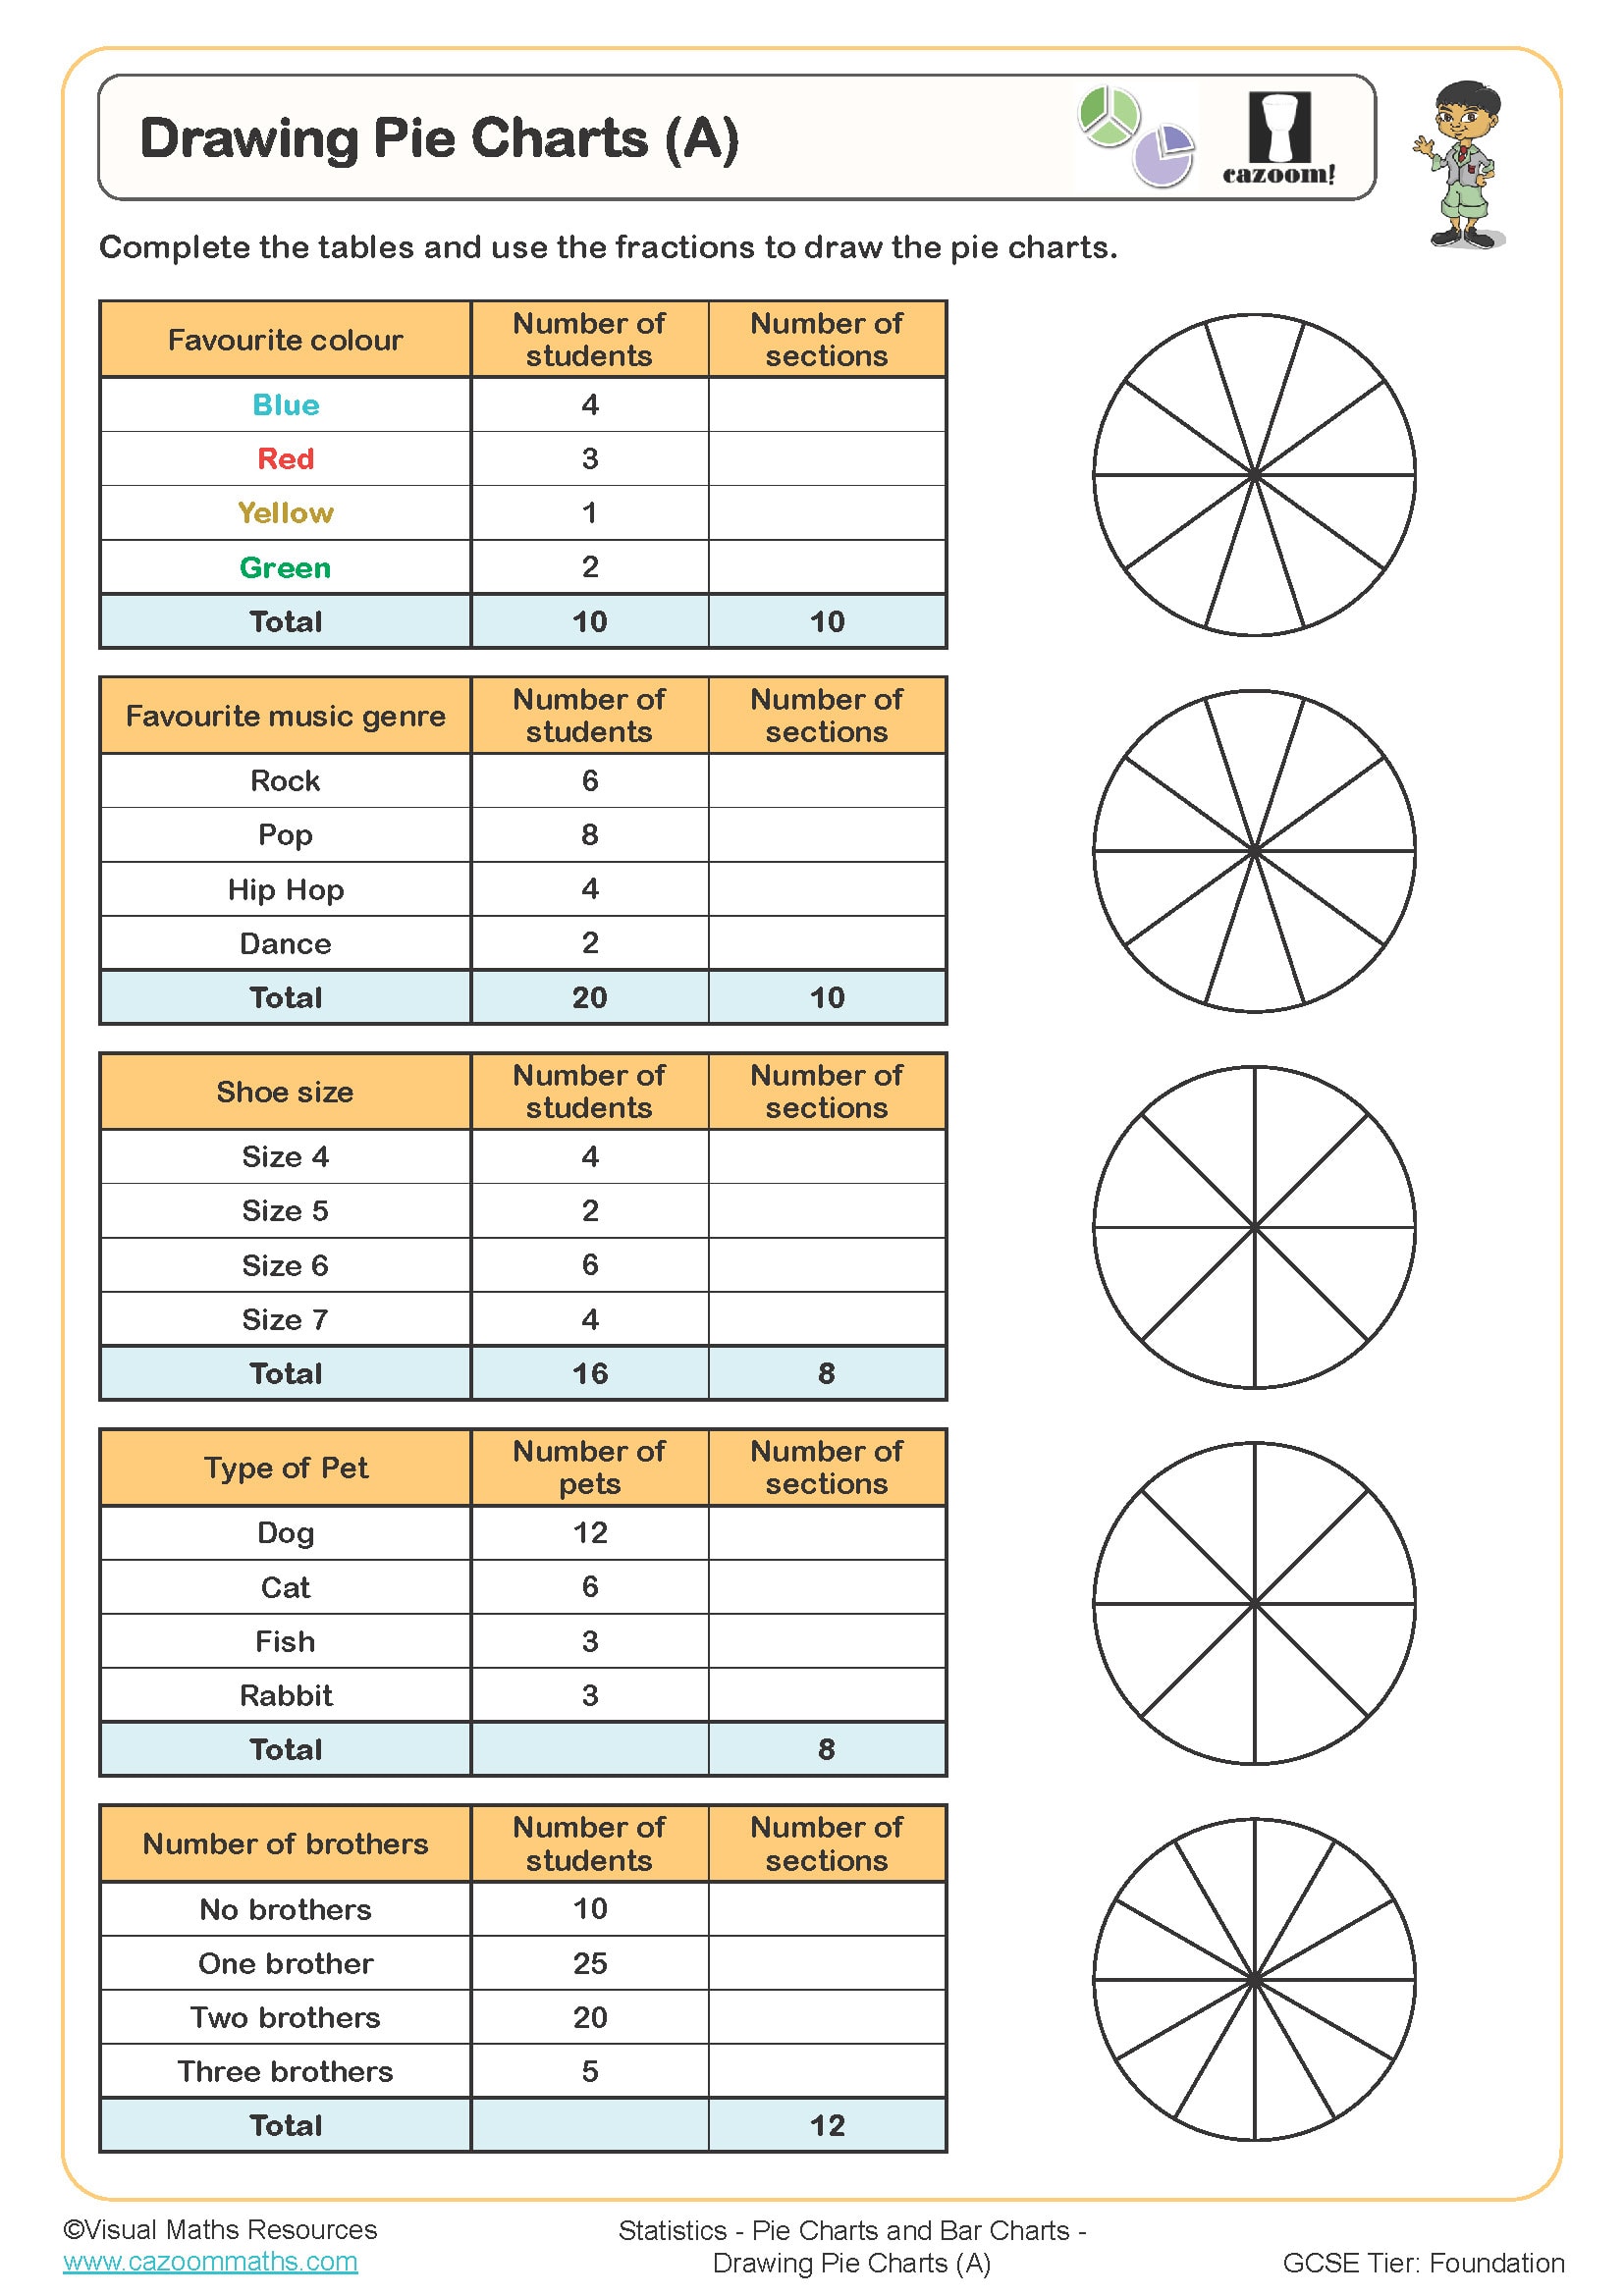
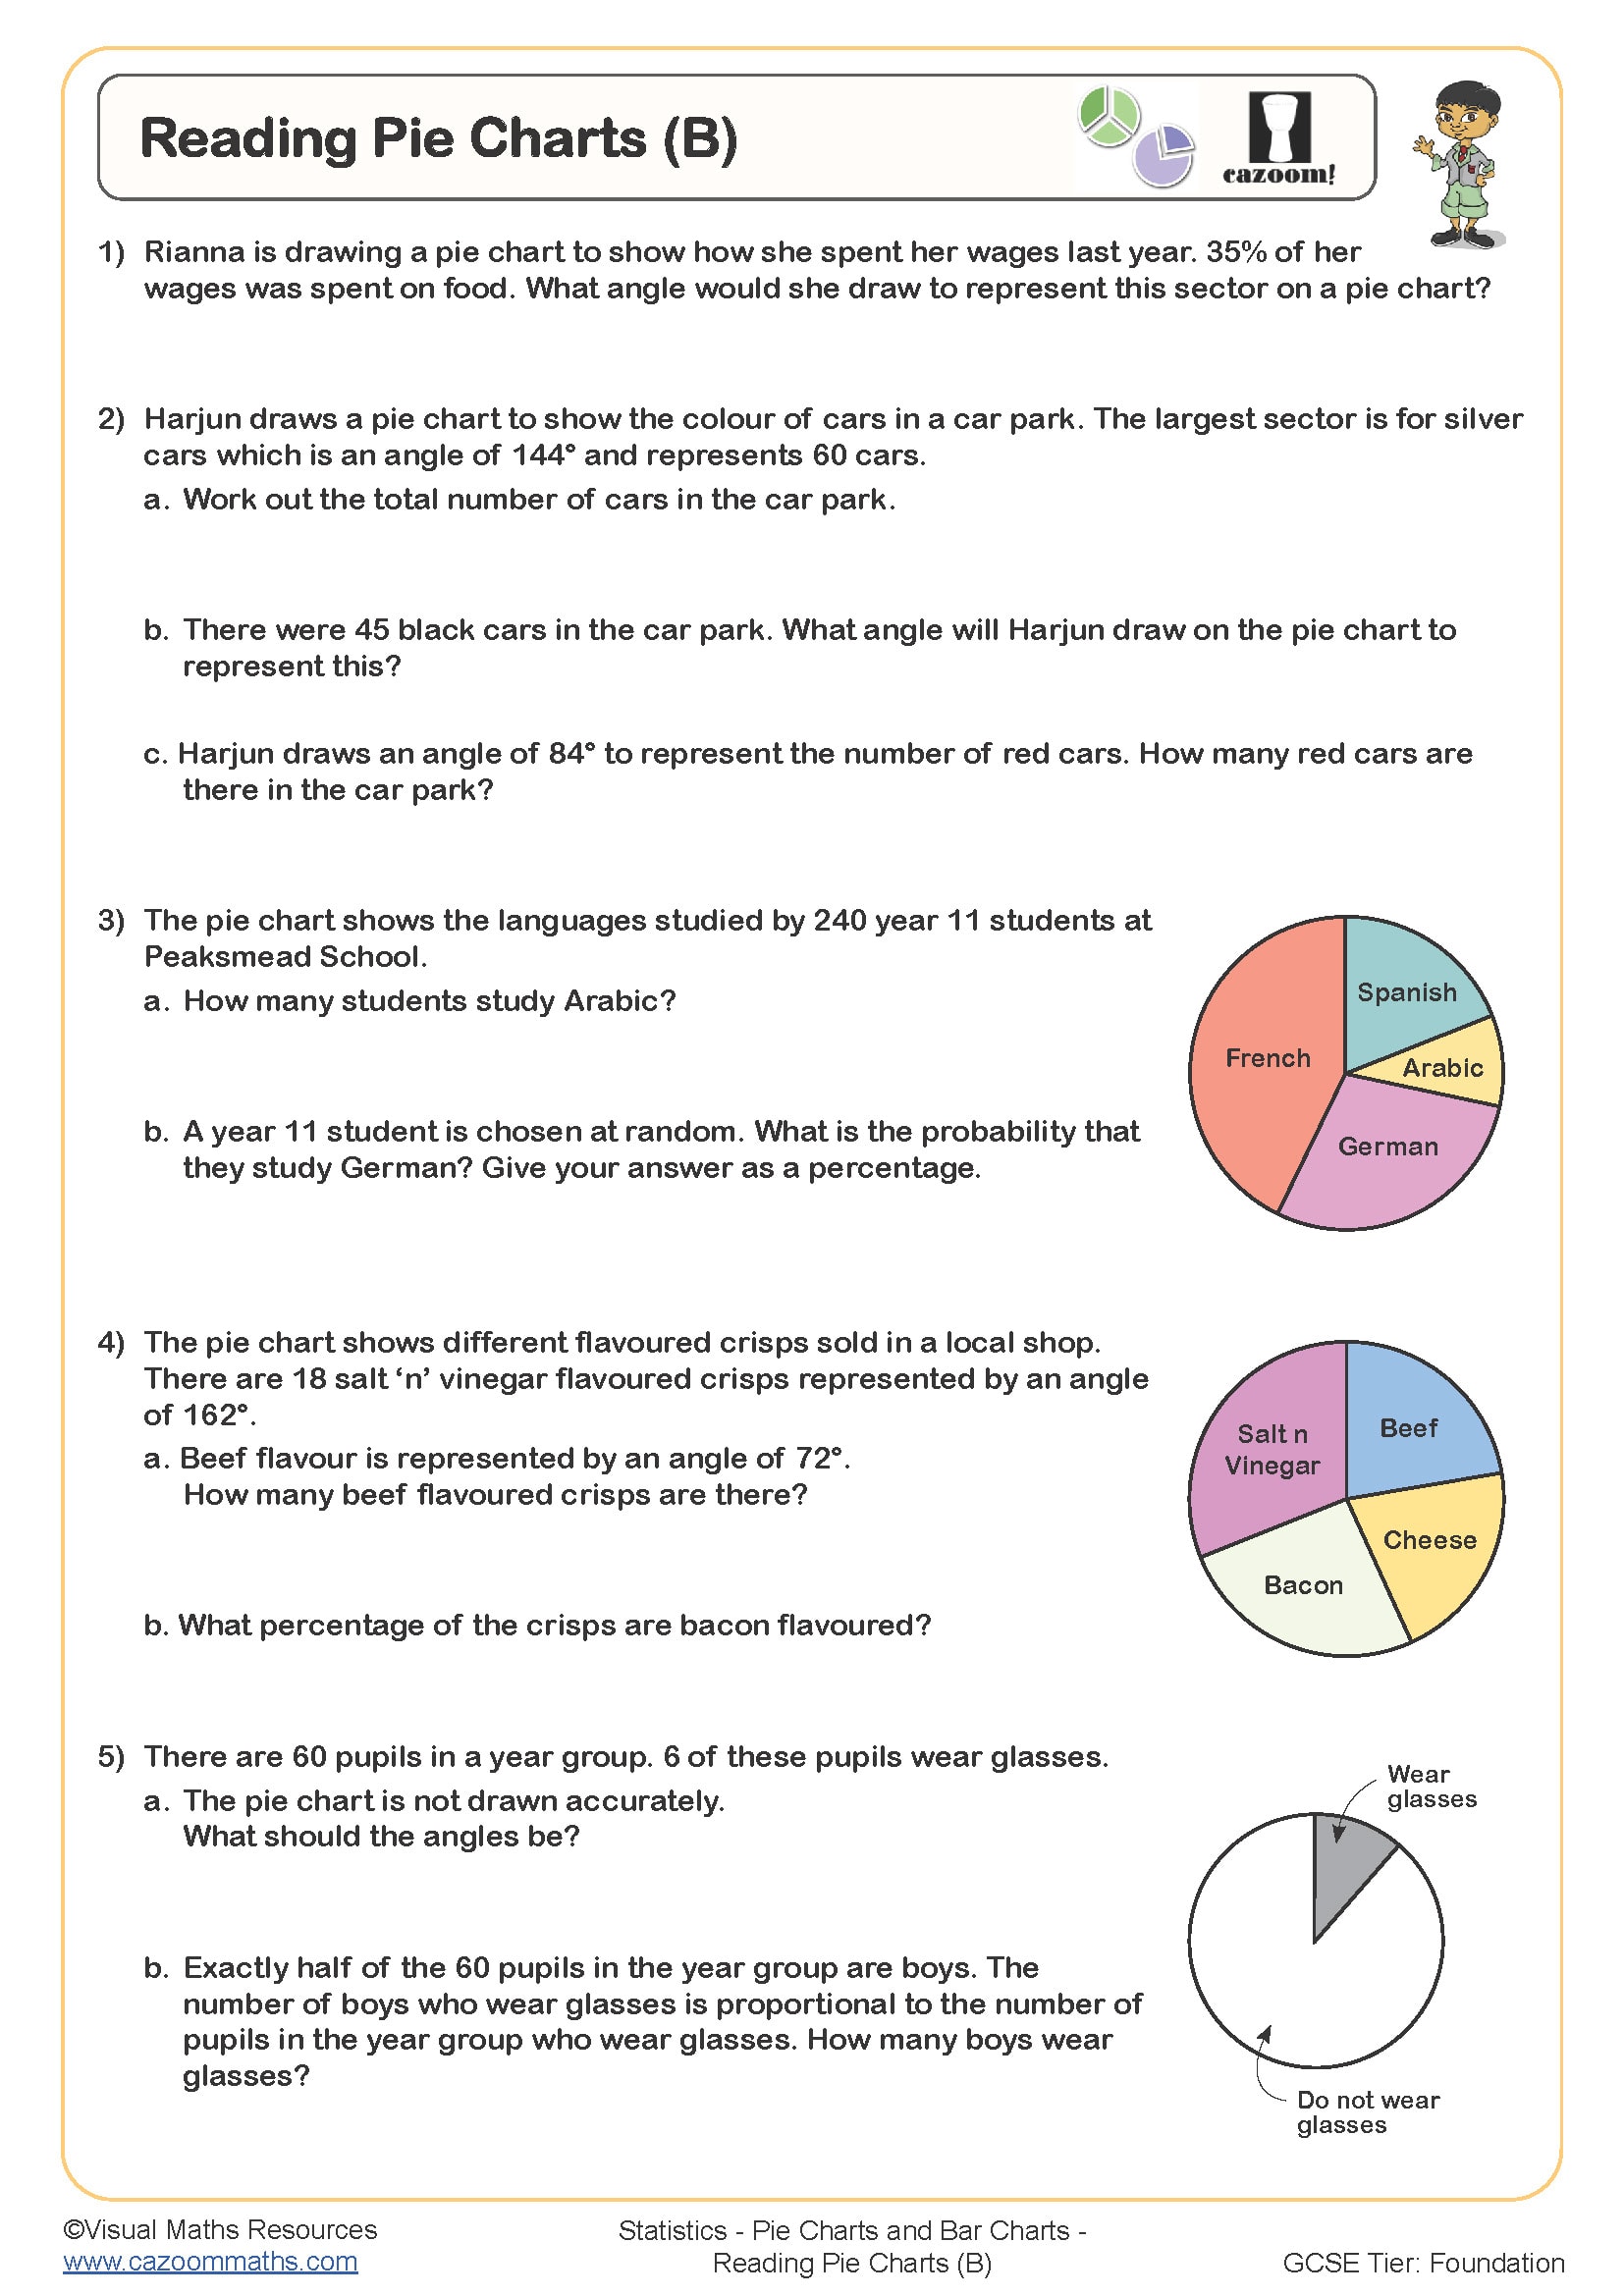
This worksheet follows Drawing Pie Charts (A) and Drawing Pie Charts (B), and now asks learners to calculate the angle given the frequency or percentage. Circles and an initial line are provided for each pie chart. Follow this worksheet with Completing Tables from Pie Charts.
All worksheets are created by the team of experienced teachers at Cazoom Maths.
 Worksheet")
RELATED TO Drawing Pie Charts (C) WORKSHEET
Frequently Asked Questions
Students should have a solid understanding of fractions, percentages, angles, and averages before tackling this activity. These foundational concepts are essential because pie charts require converting data into proportional angles, which involves fraction and percentage calculations. Without these prerequisite skills, learners may struggle to make the necessary connections between the given data and the 360-degree structure of a circle.