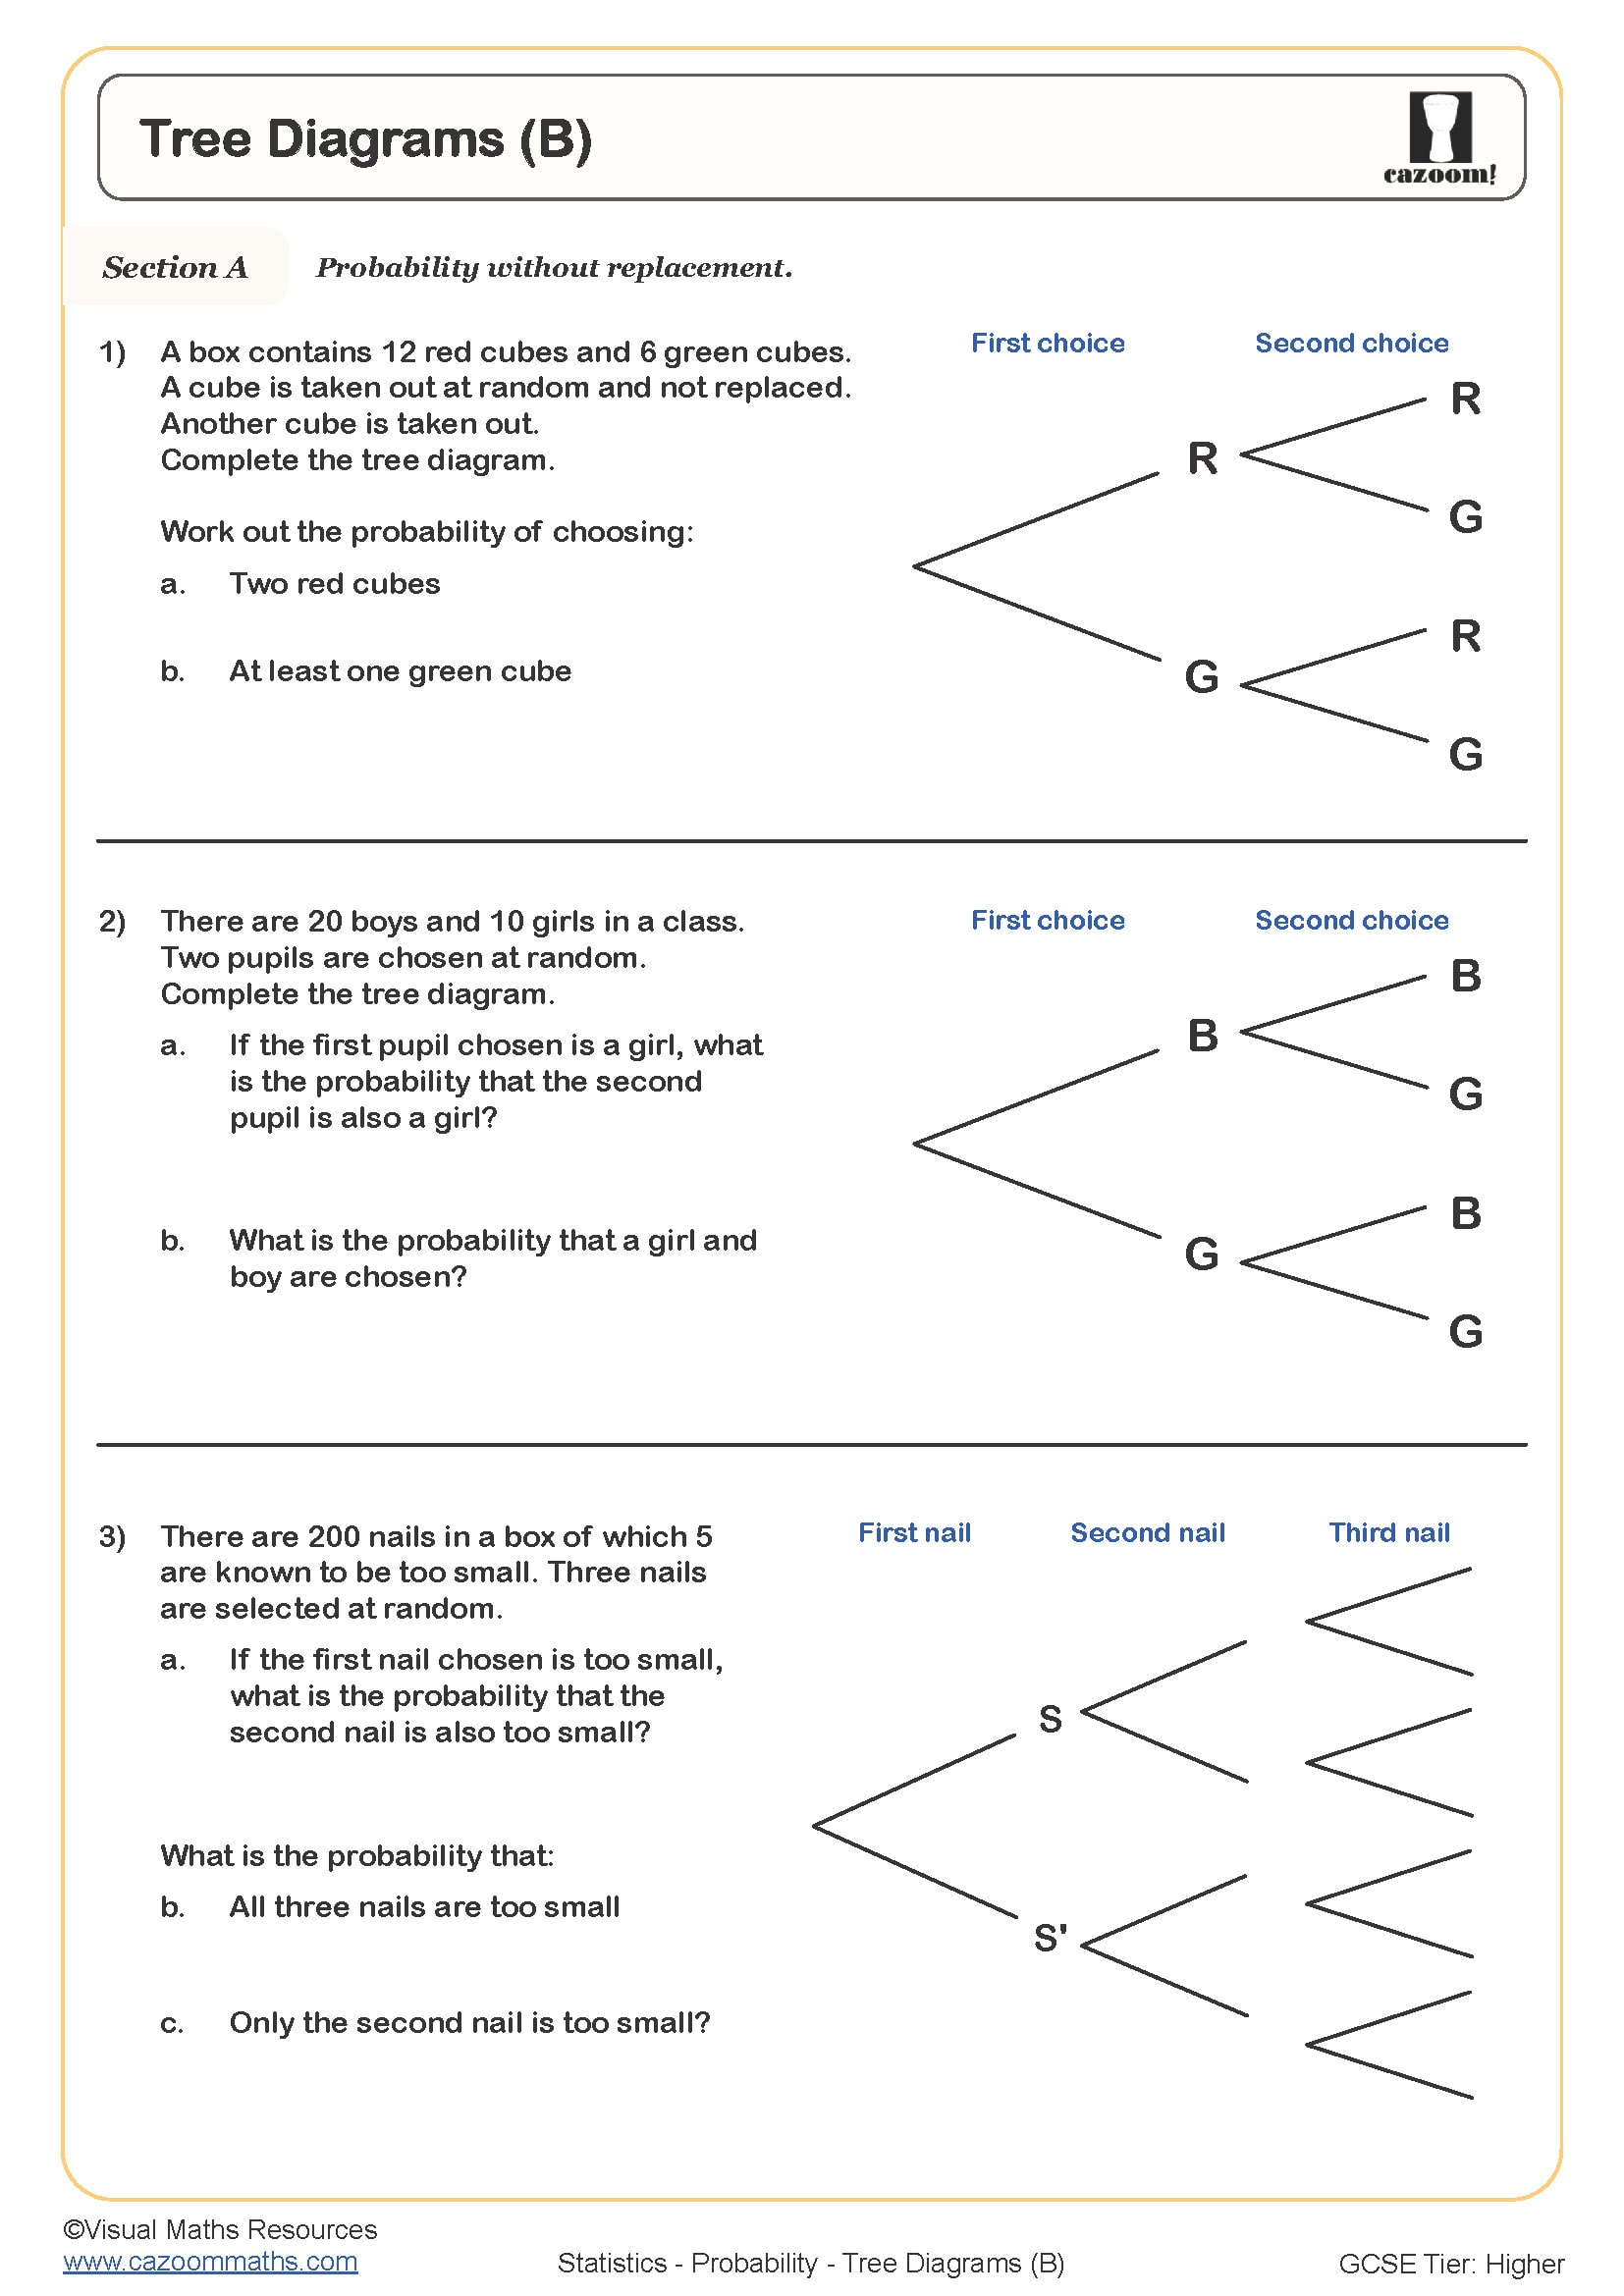
Introducing Tree Diagrams for Independent Events (Fractions) WORKSHEET
Suitable for Year groups: Year 10, Year 11
GCSE Tier: Foundation/Higher
Targeting grades: 4 - 5
Prerequisite knowledge: The 4 operations with fractions. Find probabilities from simple spinners and equally likely outcomes.Understand probability as a fraction between 0 and 1. The probability of exhaustive events sum to 1. The AND Rule for independent events and the OR rule for mutually exclusive events.
Learning Objective: Represent and calculate probabilities using diagrams, including tree diagrams, and understand that for independent events the probability of combined outcomes is found by multiplying probabilities.
Introducing Tree Diagrams for Independent Events (Fractions) WORKSHEET DESCRIPTION
This worksheet develops fluency in linking the sine rule, cosine rule and area formula across multi-step problems involving connected triangles.
In Section A, students work with four shapes. For each diagram they must first decide which rule applies in the initial triangle, match the question to a given method sequence (for example, sine rule then cosine rule), and then apply the second rule in the neighbouring triangle to calculate the unknown length or angle, giving answers to three significant figures.
In Section B, pupils combine trigonometry with the area formula A = ½ab sin C. They apply it in a single triangle and across three compound shapes, using given areas, side lengths or angles to deduce missing information.
All worksheets are created by the team of experienced teachers at Cazoom Maths.
-Questions-Worksheet.jpg?w=3840 "Introducing Tree Diagrams for Independent Events (Fractions)")
RELATED TO Introducing Tree Diagrams for Independent Events (Fractions) WORKSHEET
Frequently Asked Questions
Represent and calculate probabilities using diagrams, including tree diagrams, and understand that for independent events the probability of combined outcomes is found by multiplying probabilities.