KS3 Linear Functions Worksheets
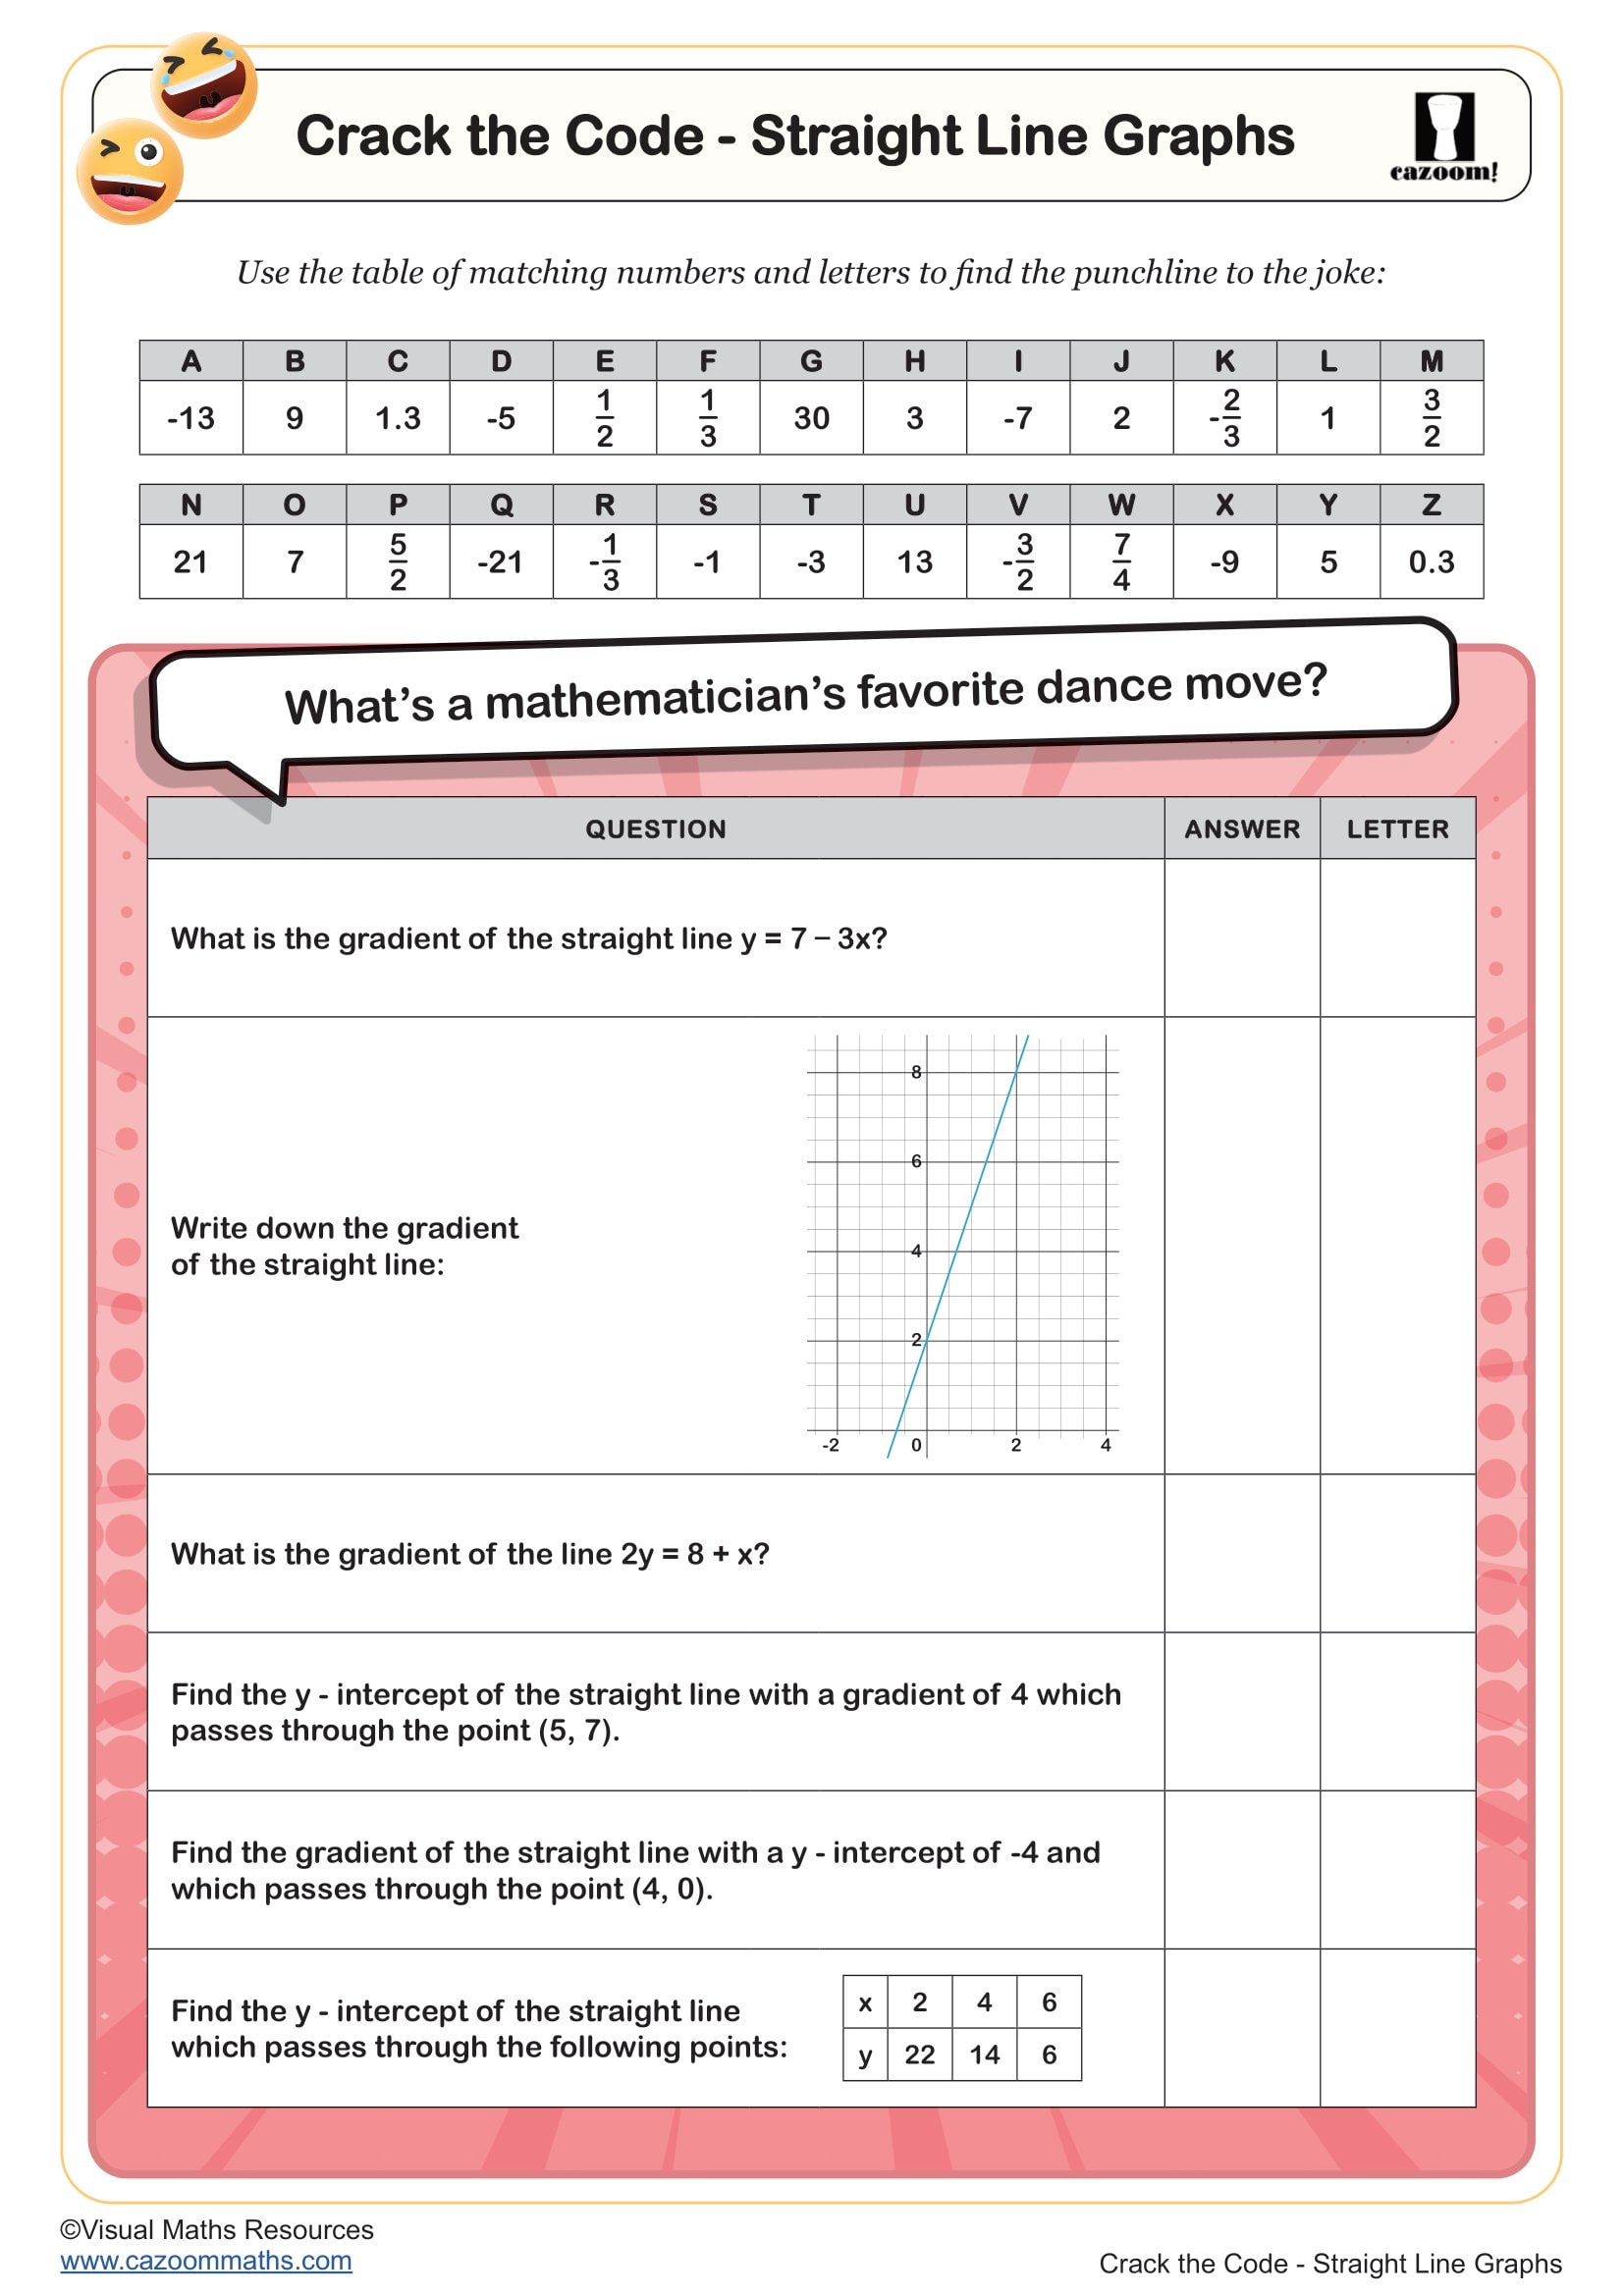
Crack the Code - Straight Line Graphs
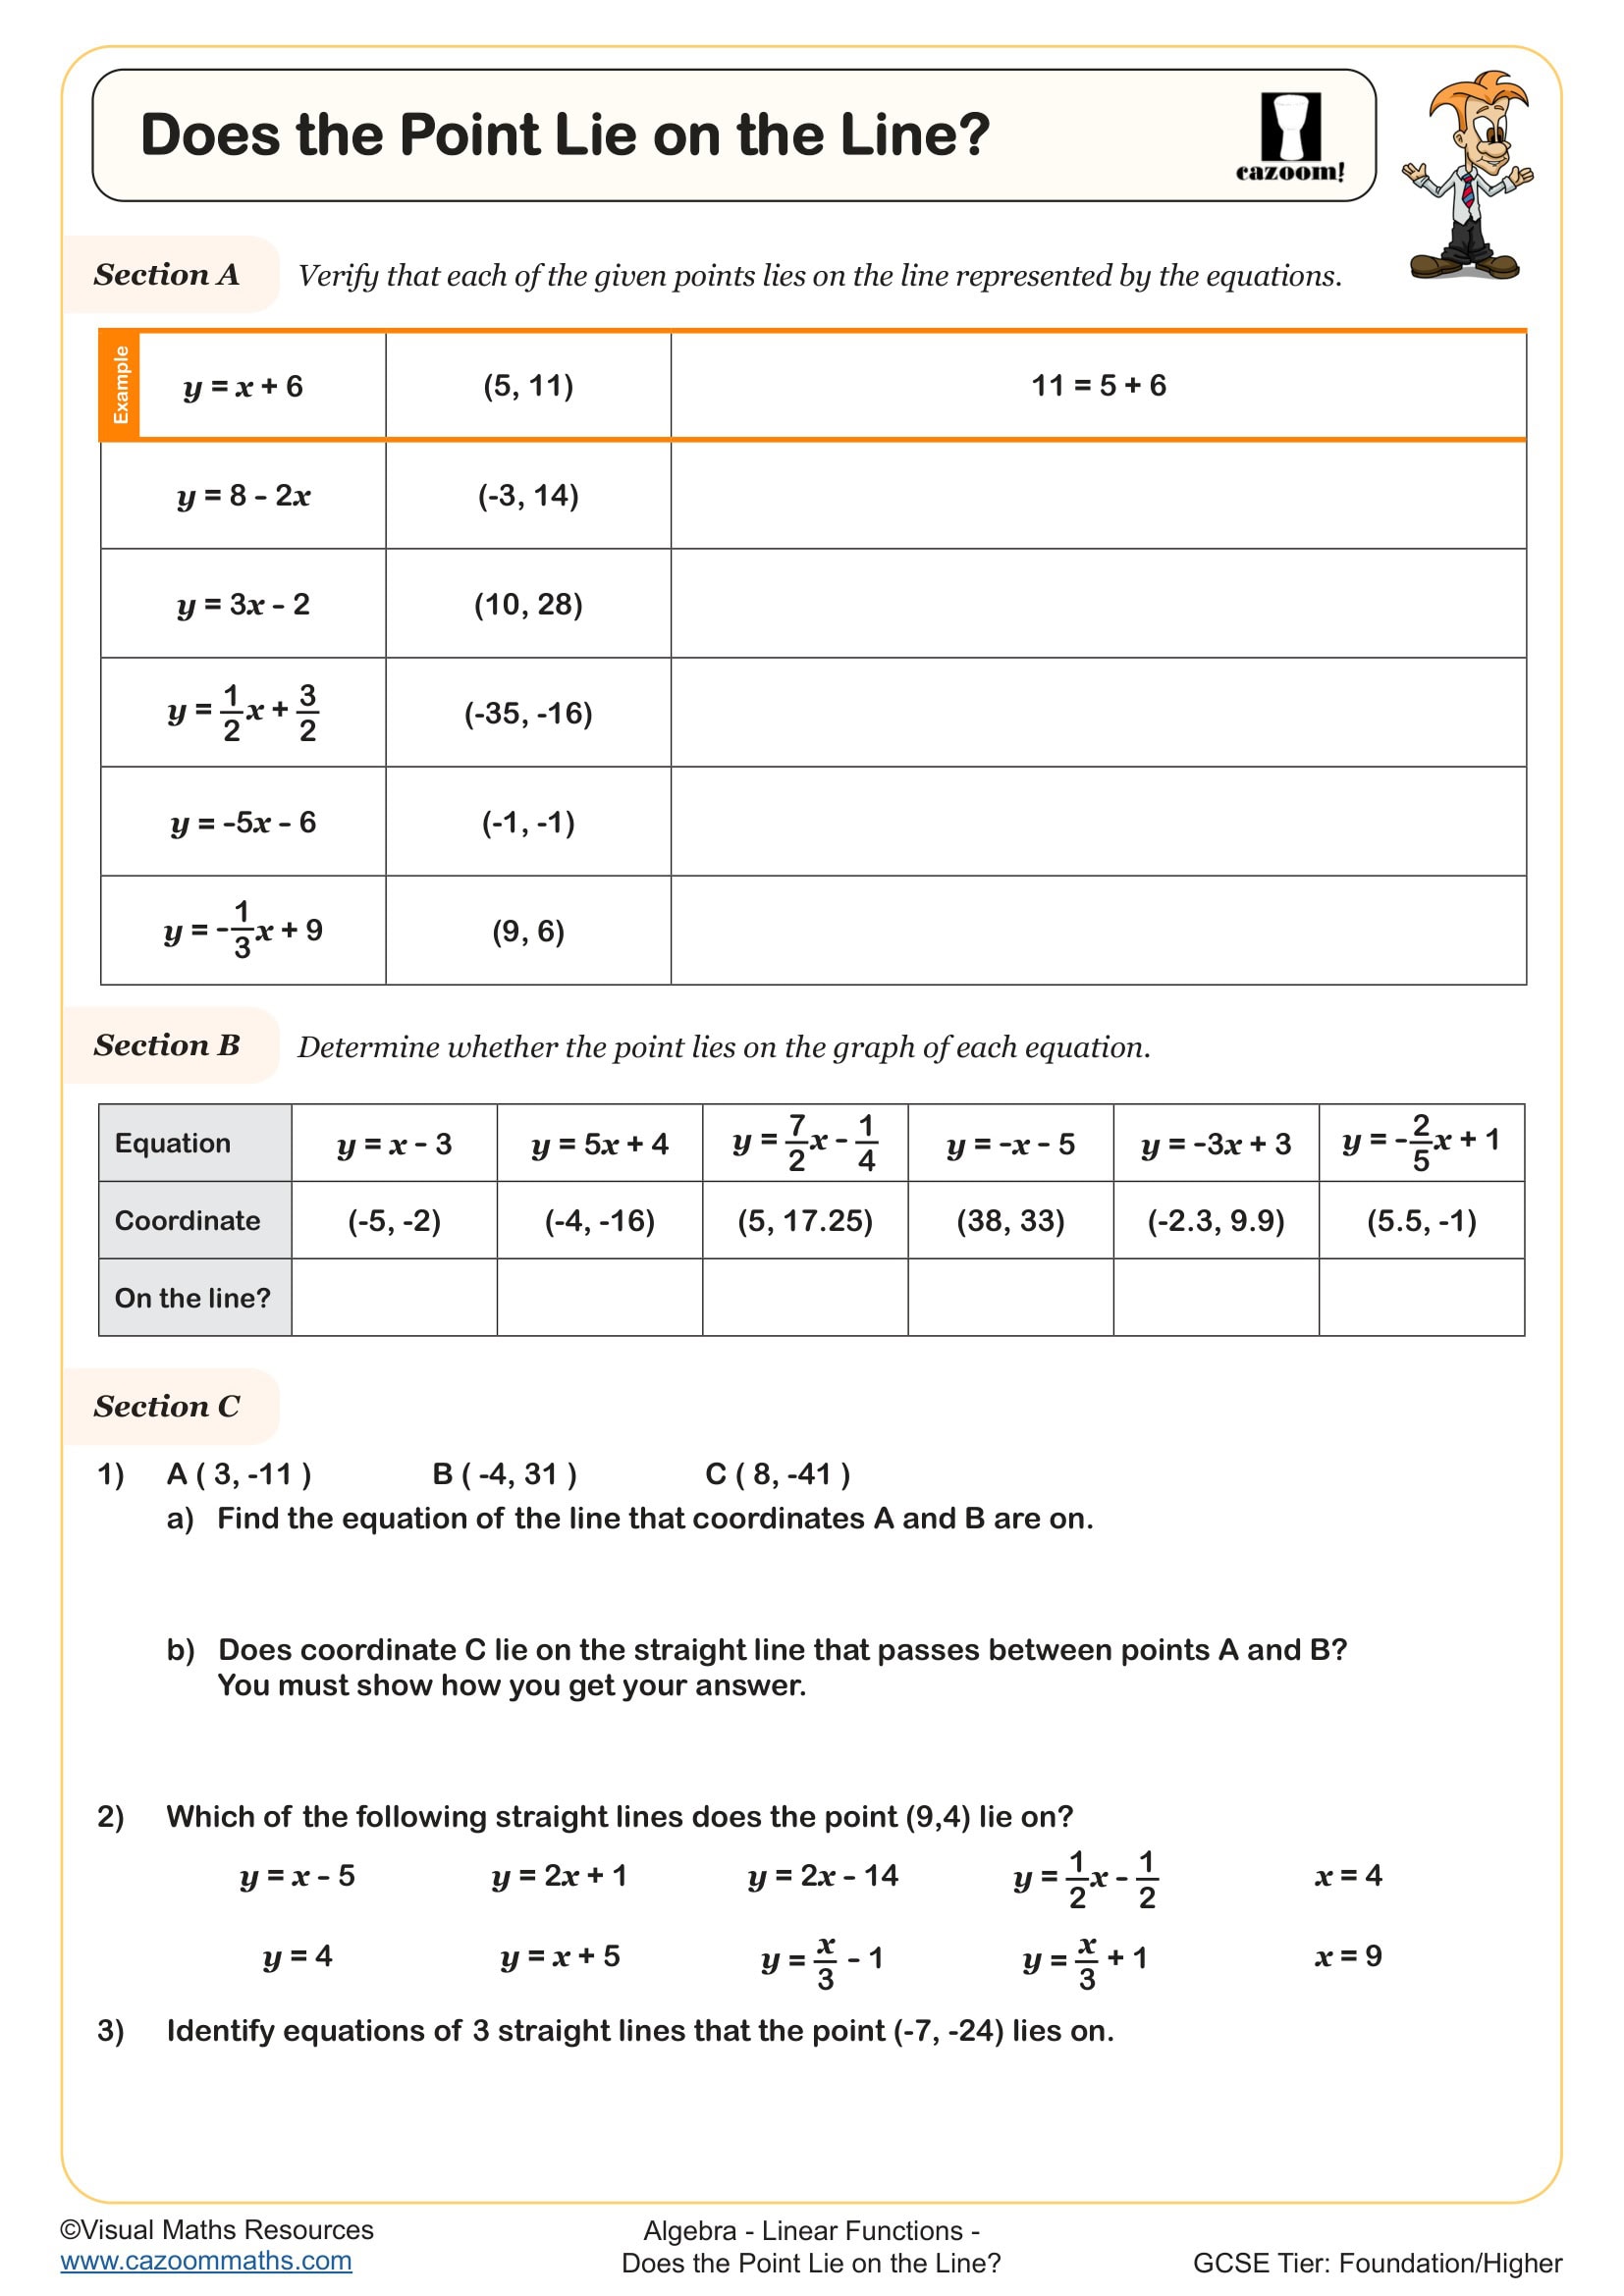
Does the Point Lie on the Line?
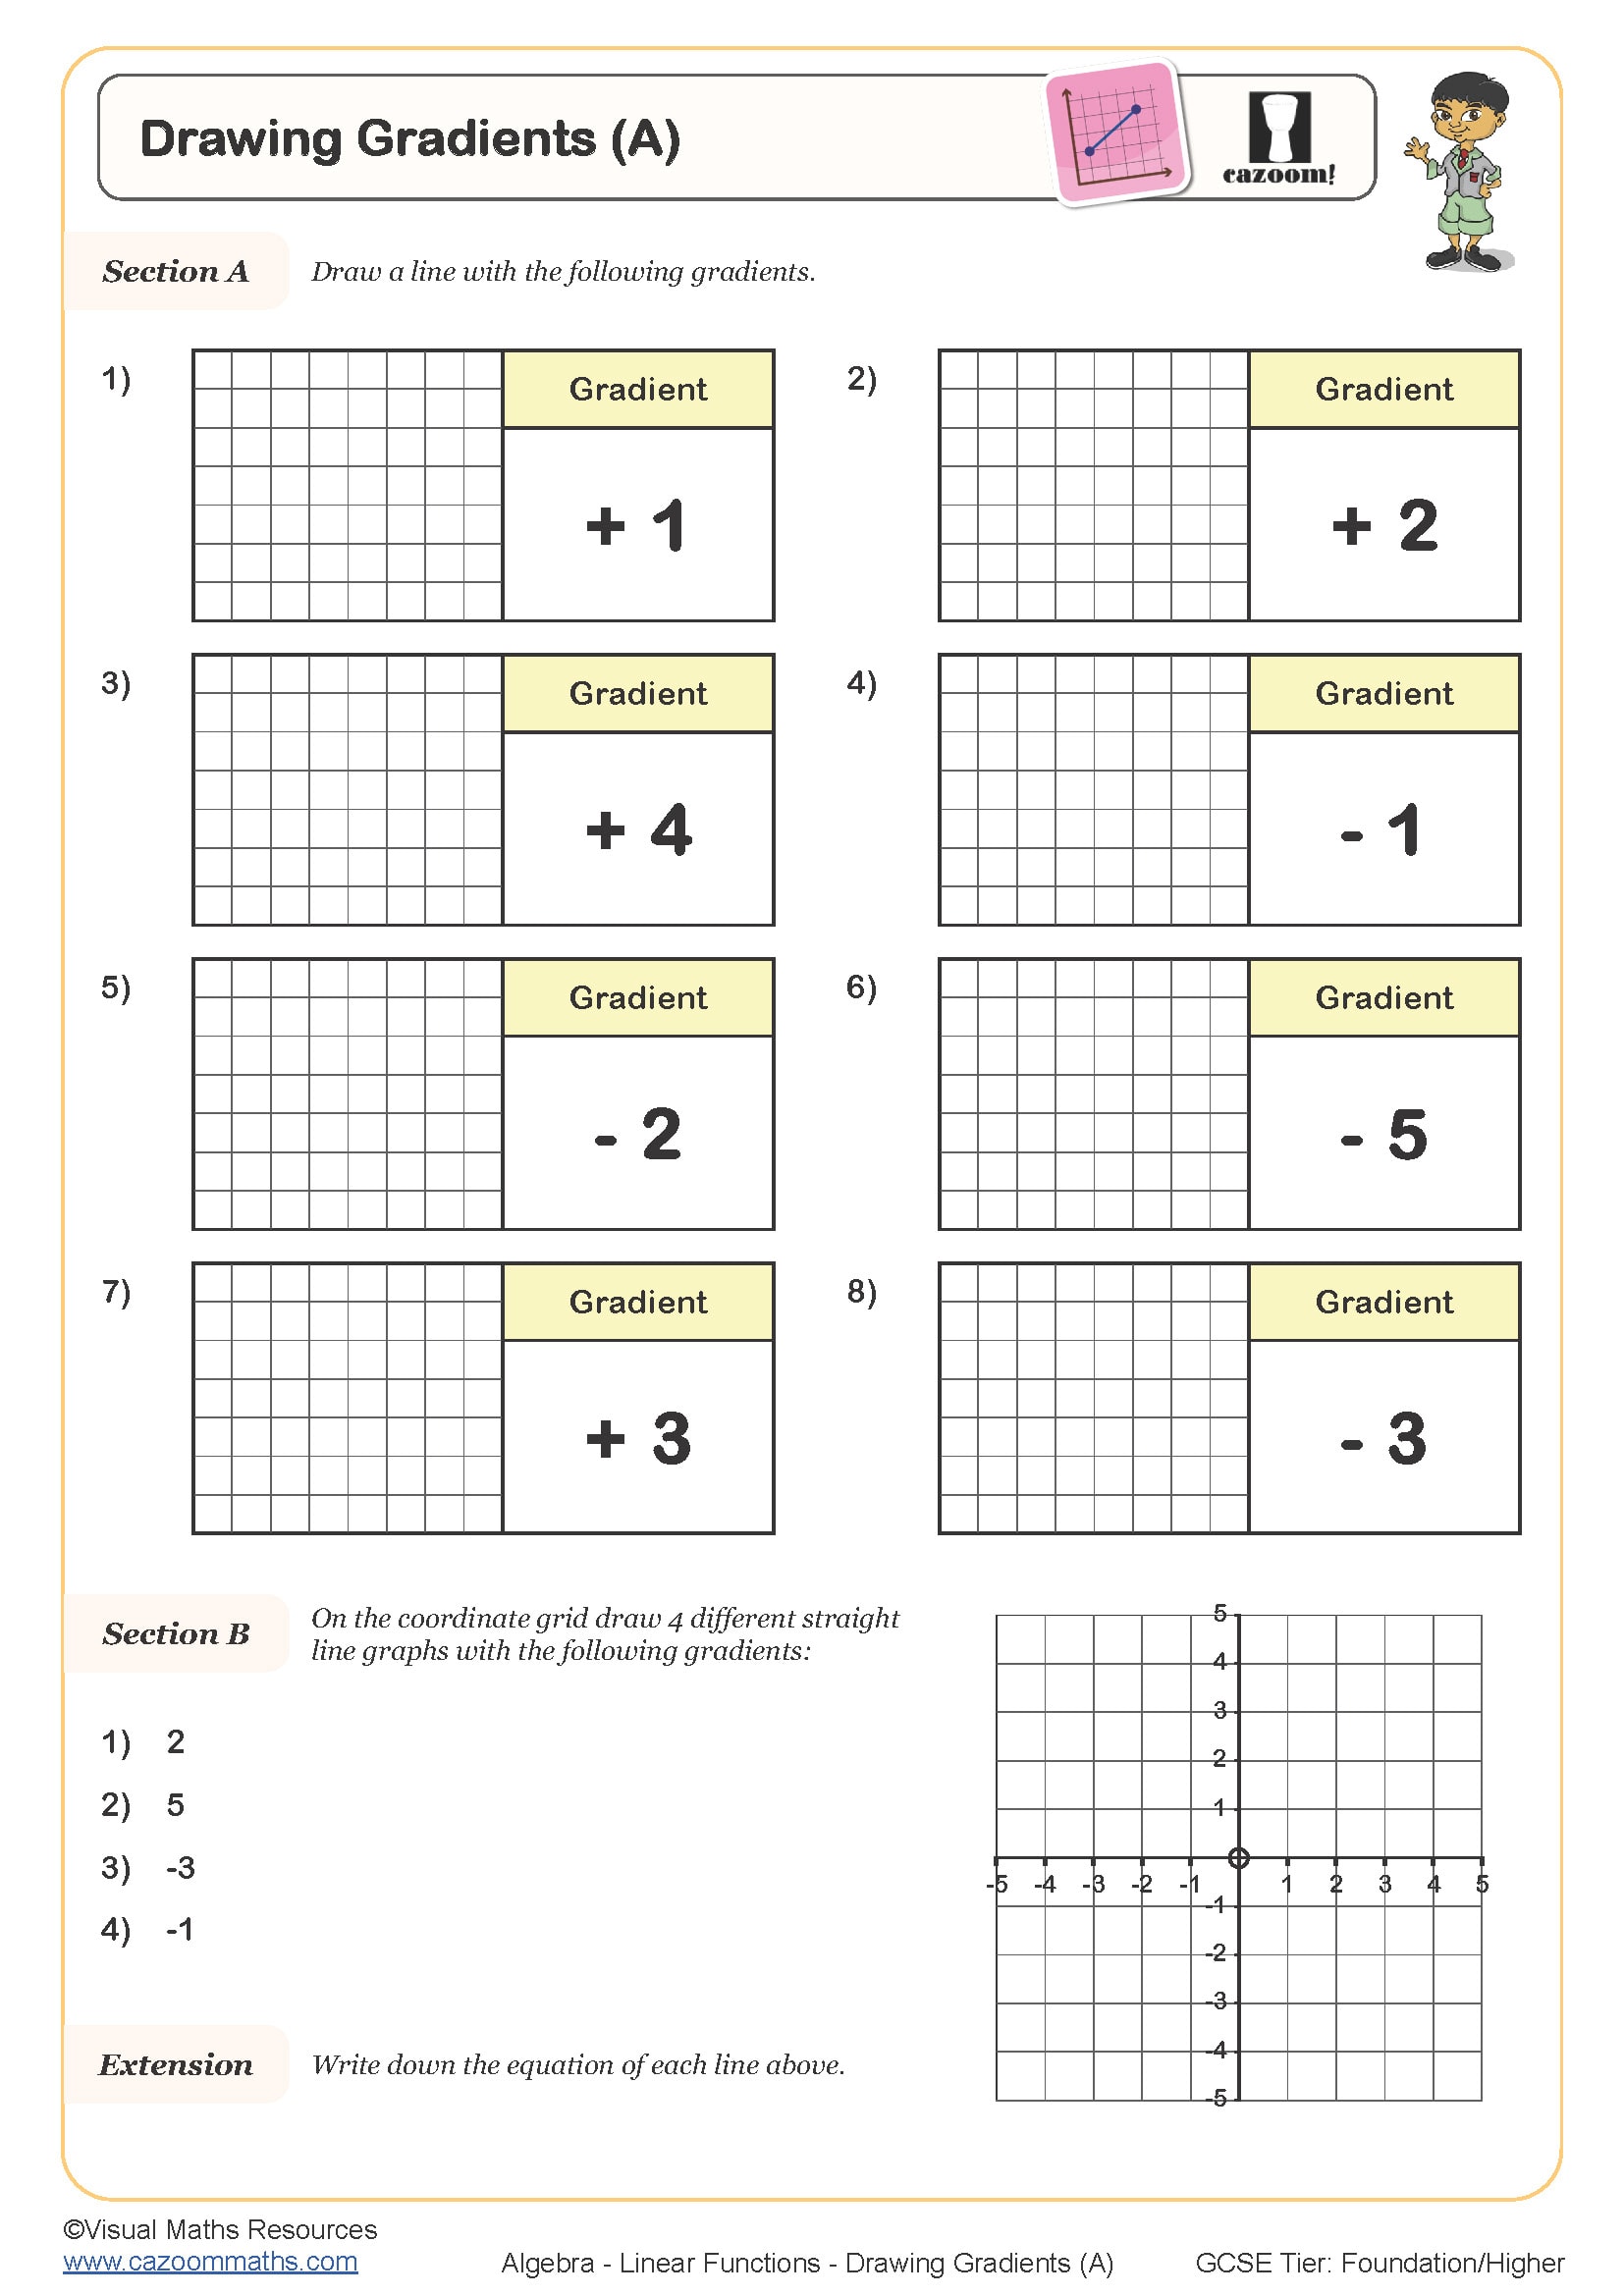
Drawing Gradients (A)
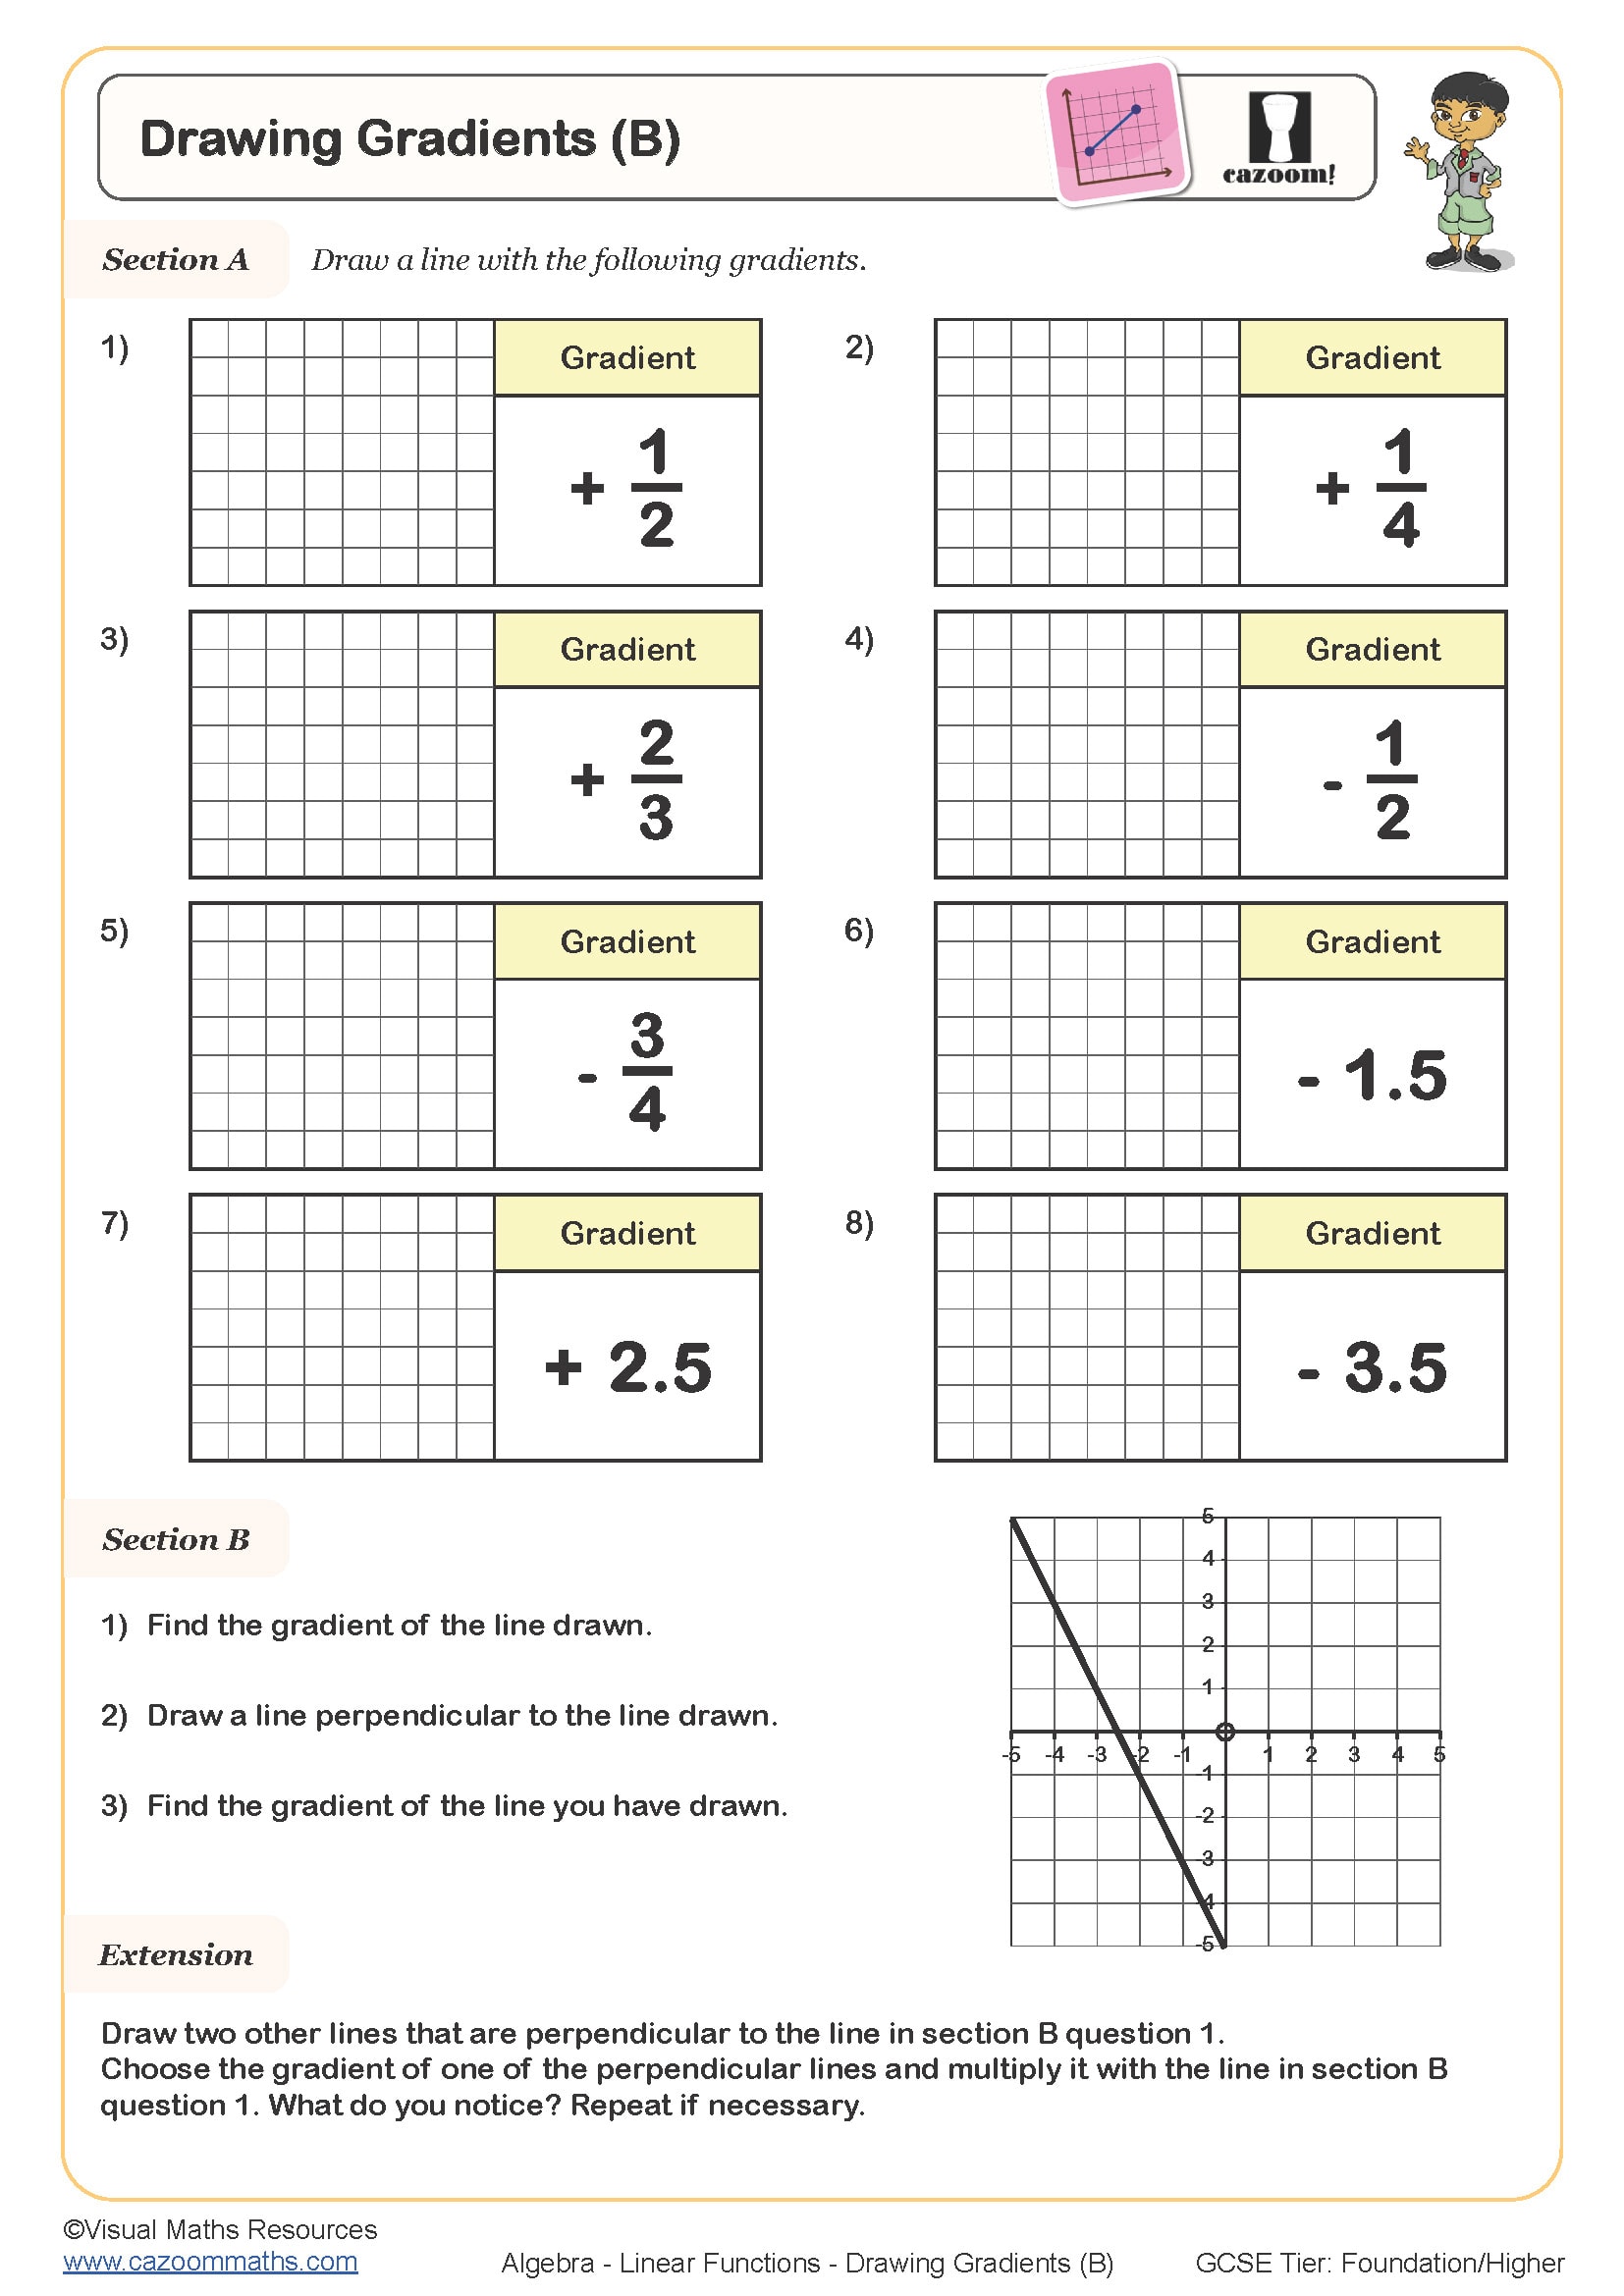
Drawing Gradients (B)
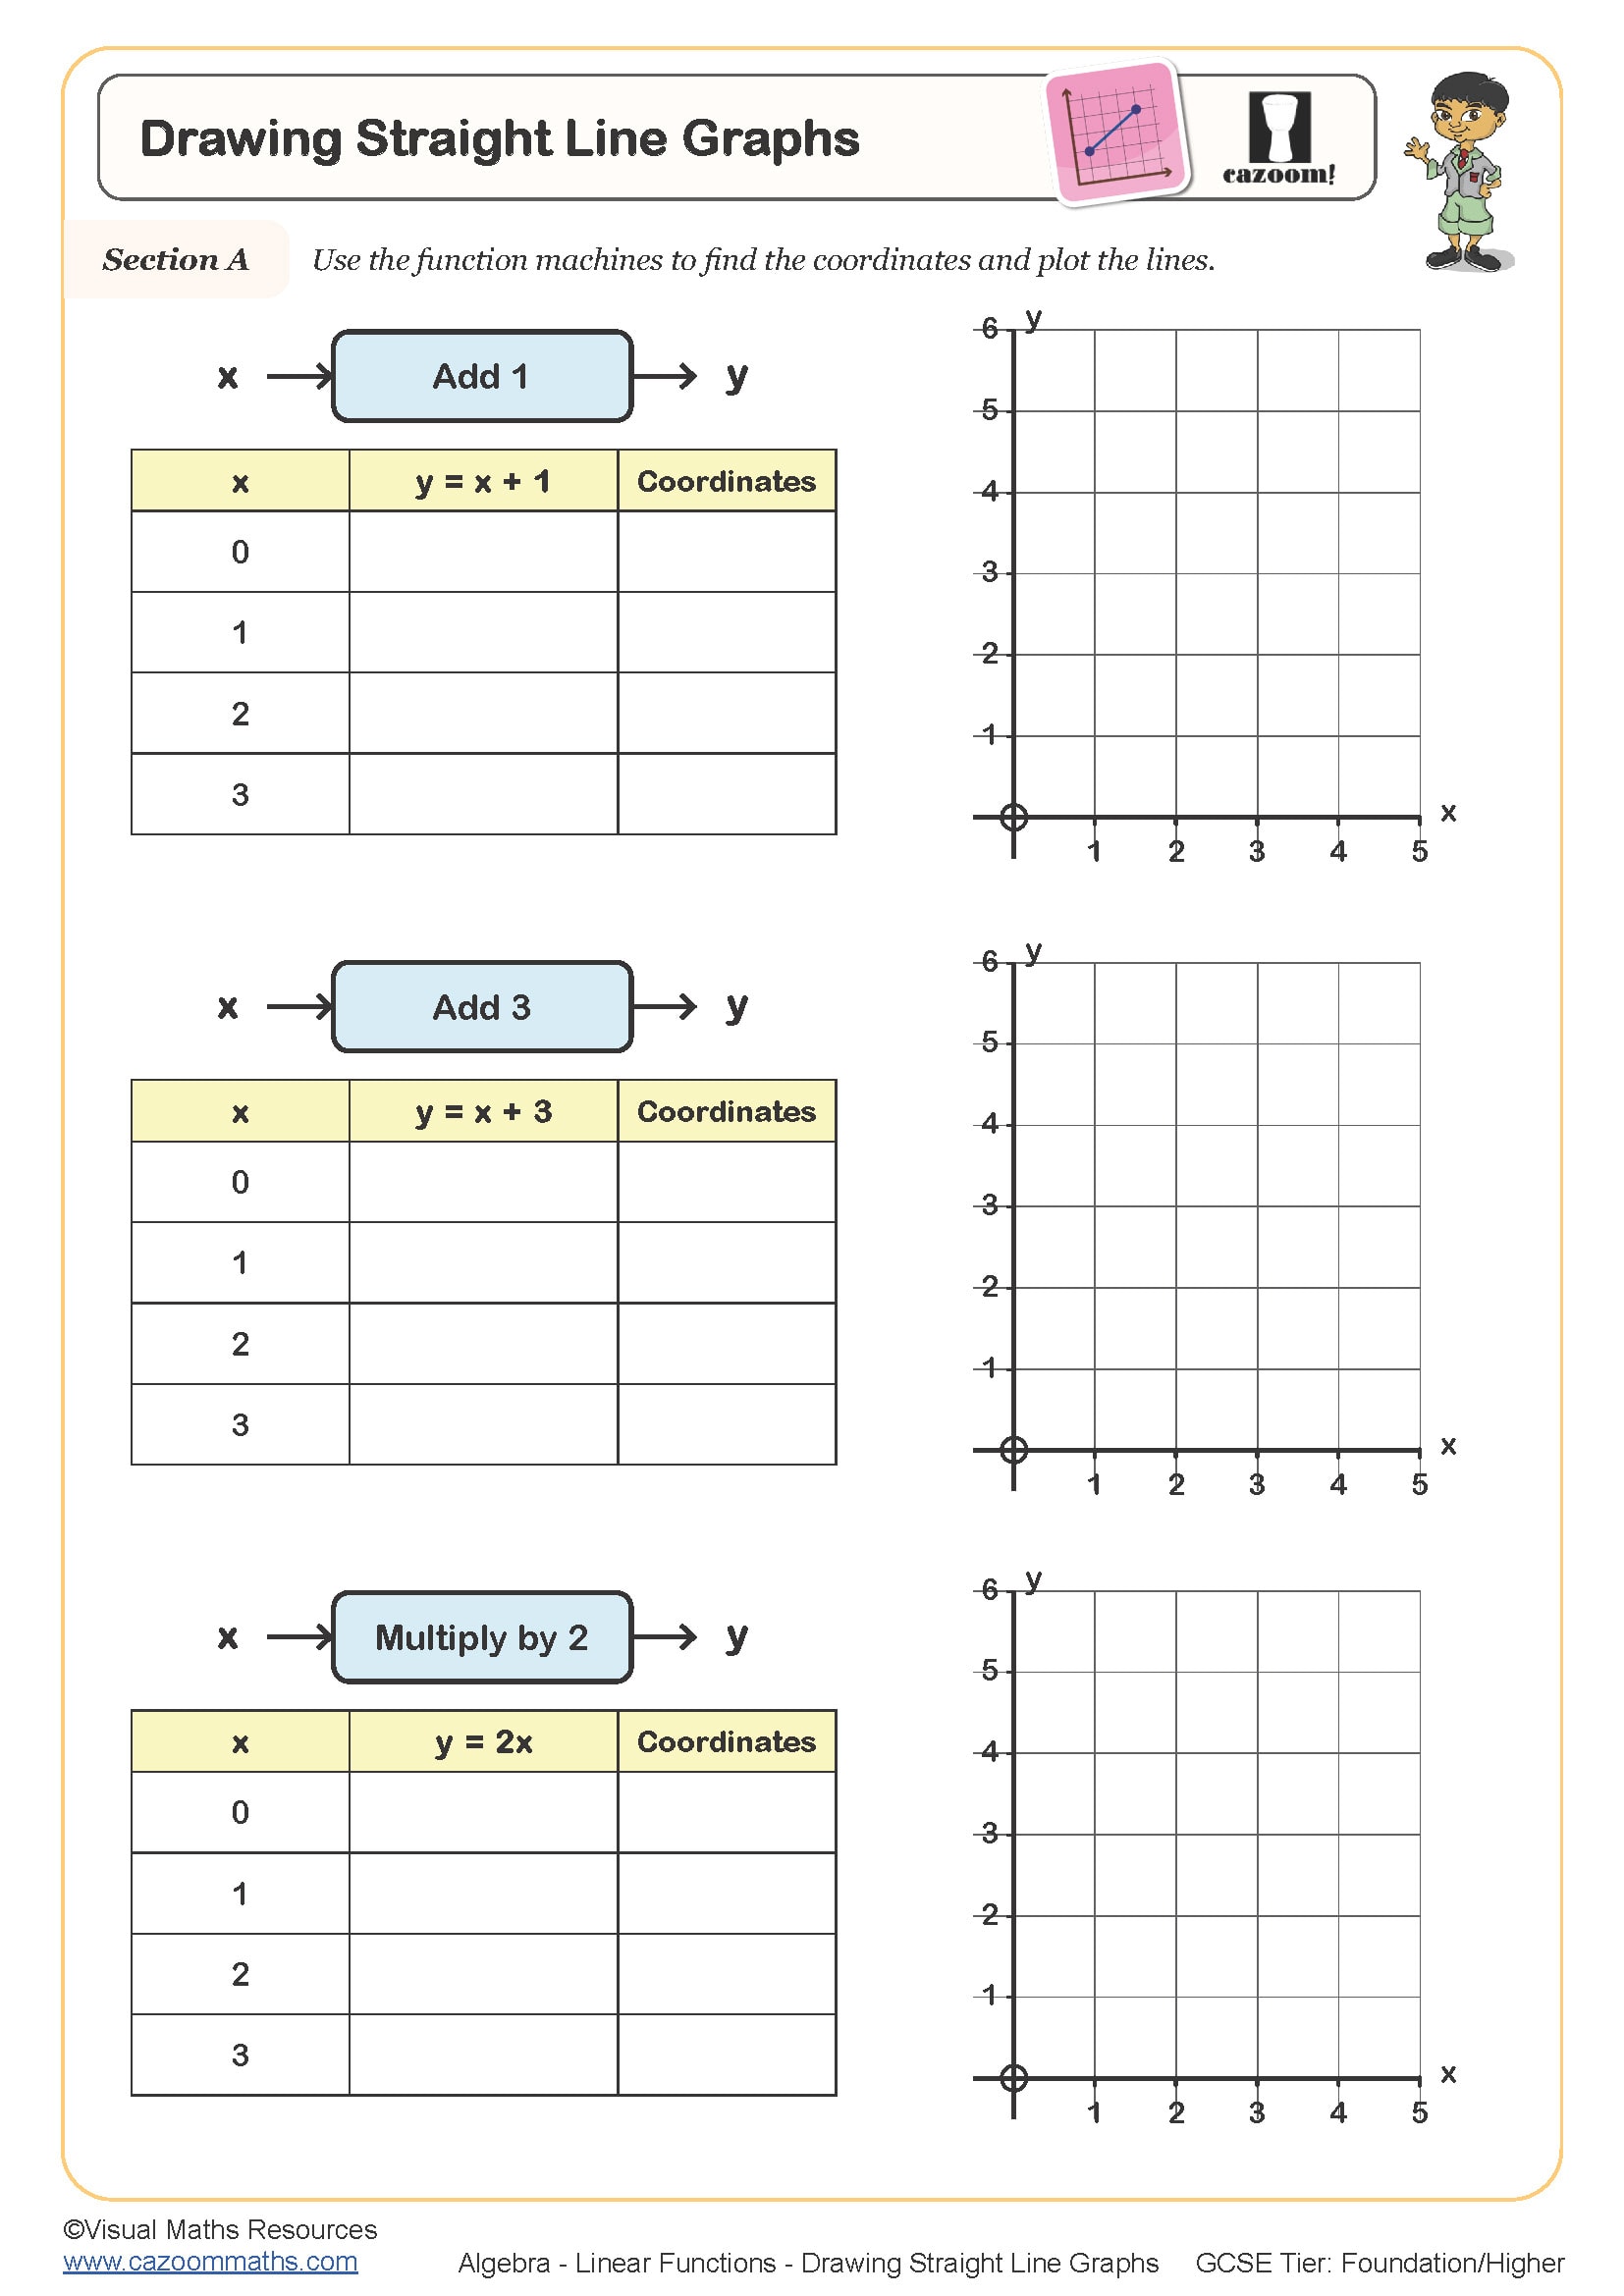
Drawing Straight Line Graphs
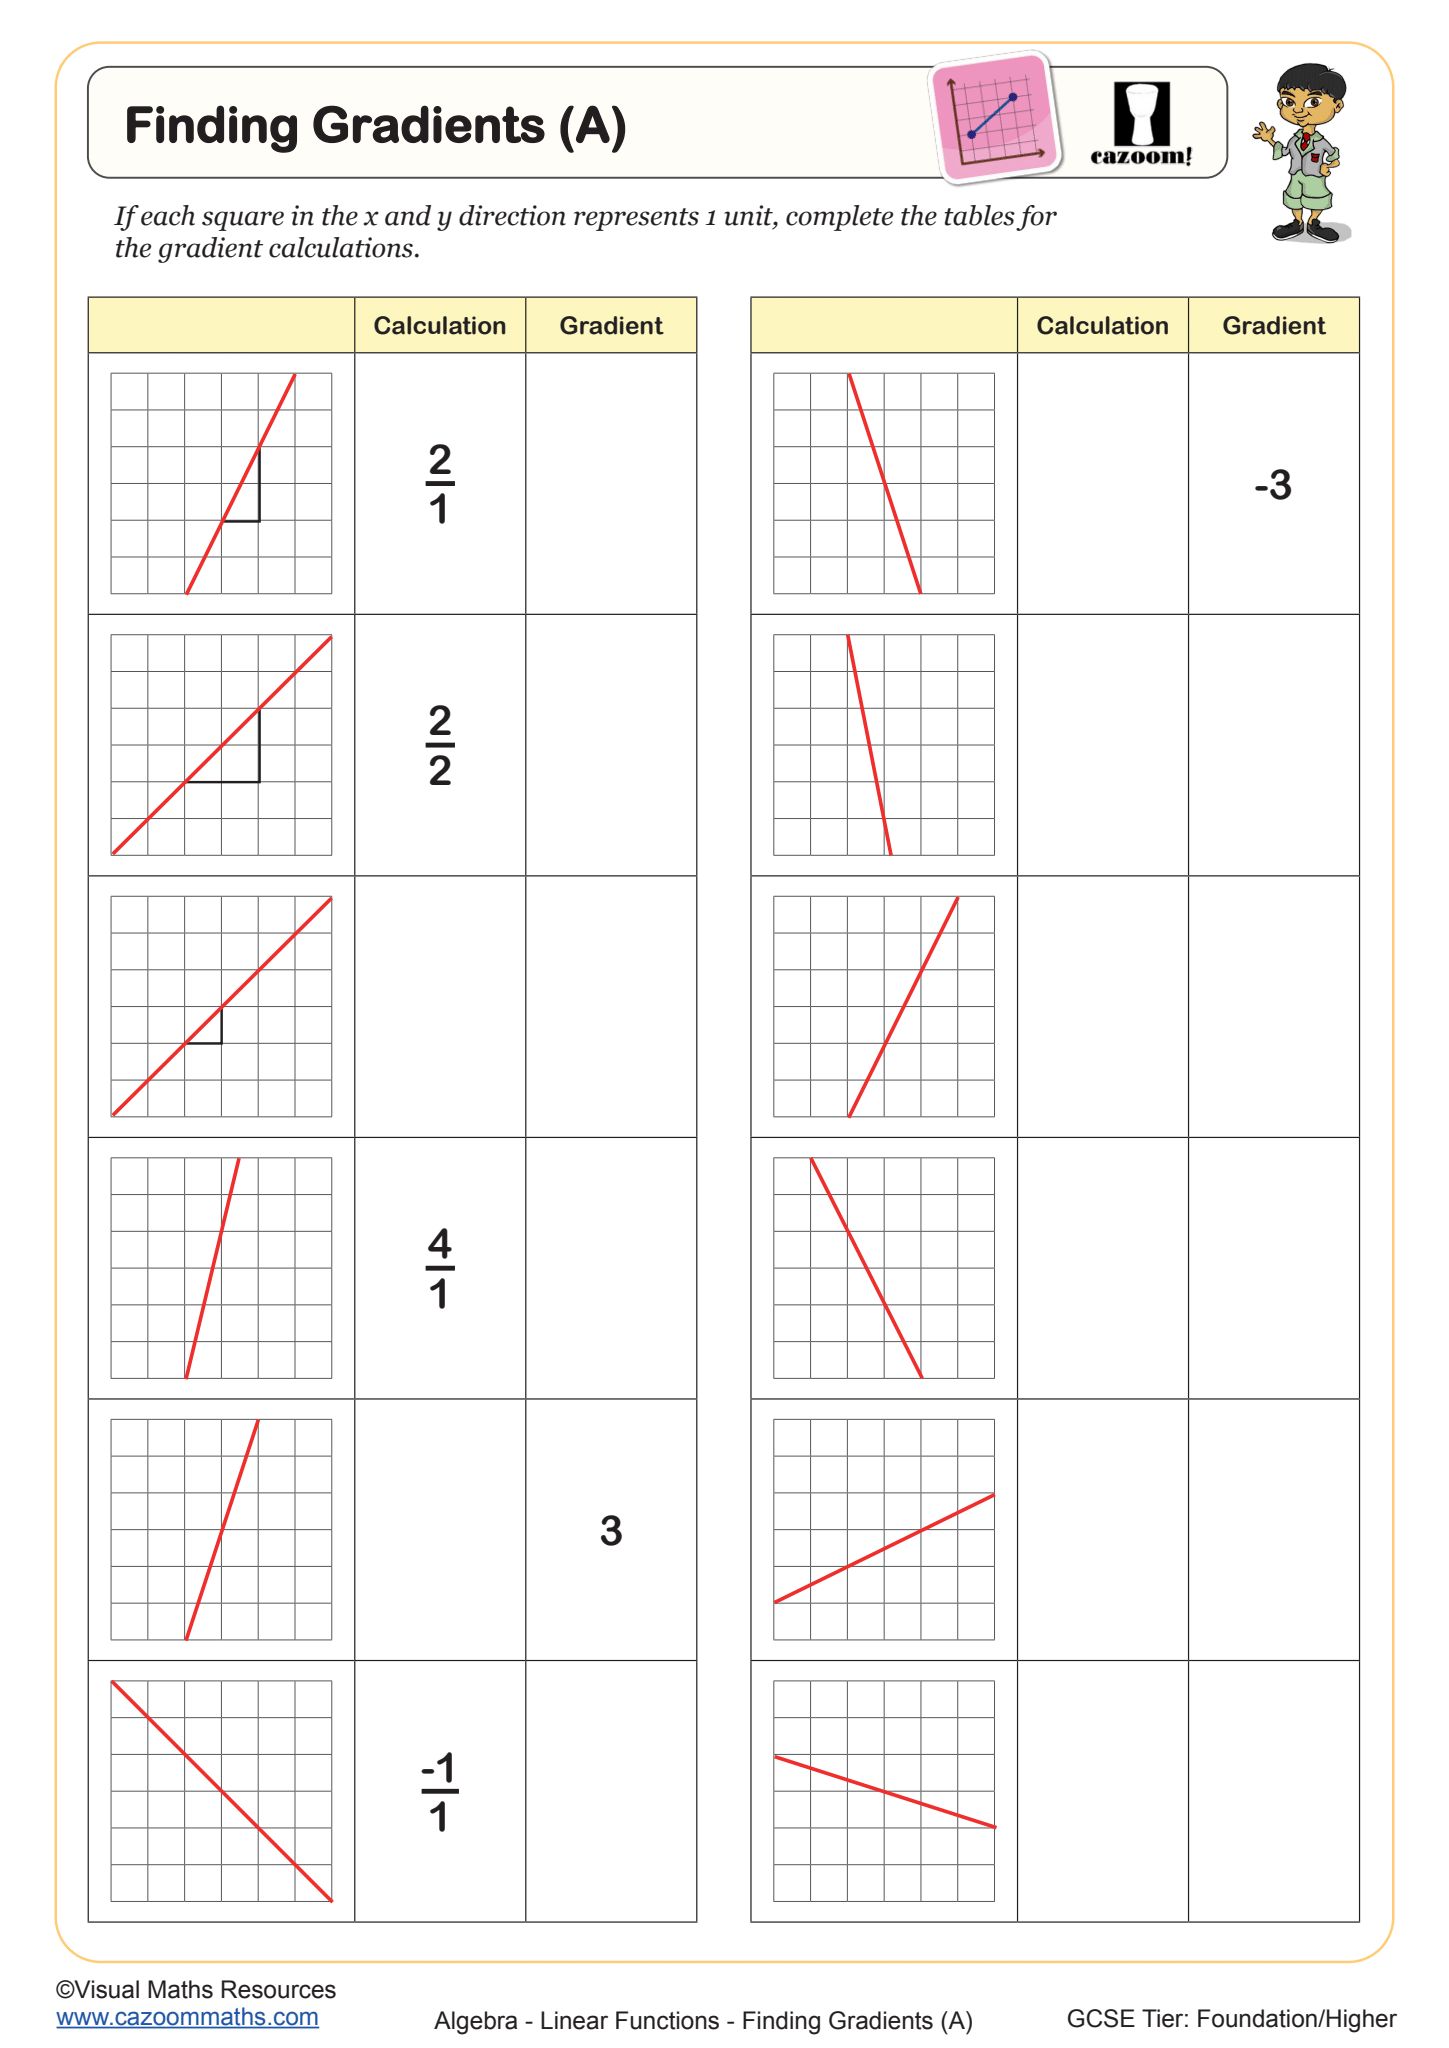
Finding Gradients (A)
Finding Gradients (B)

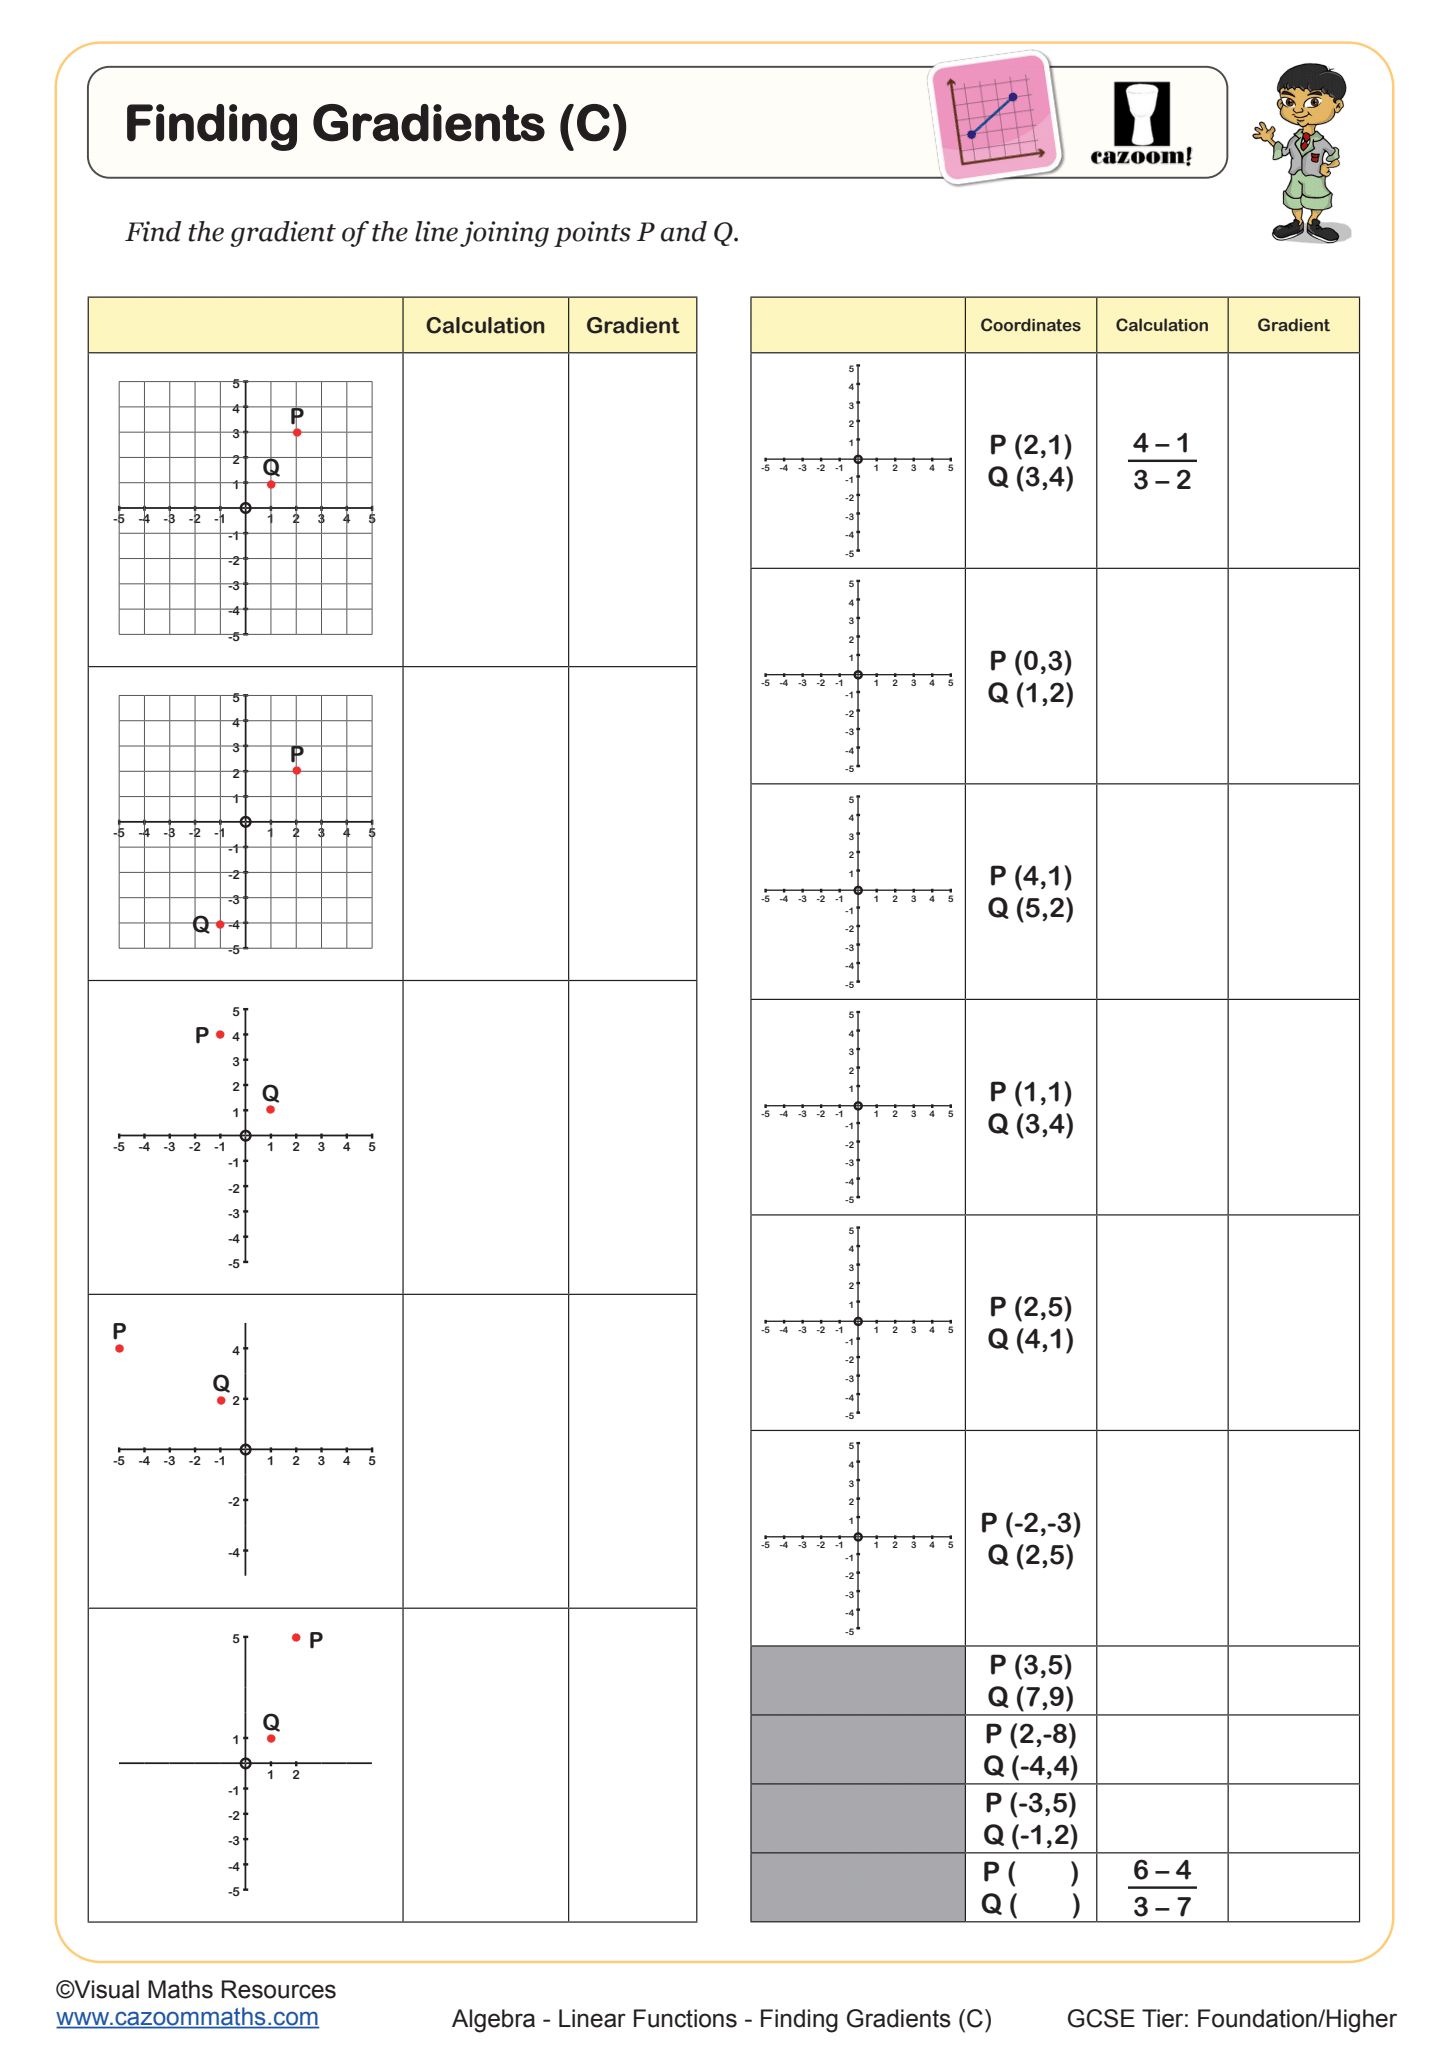
Finding Gradients (C)
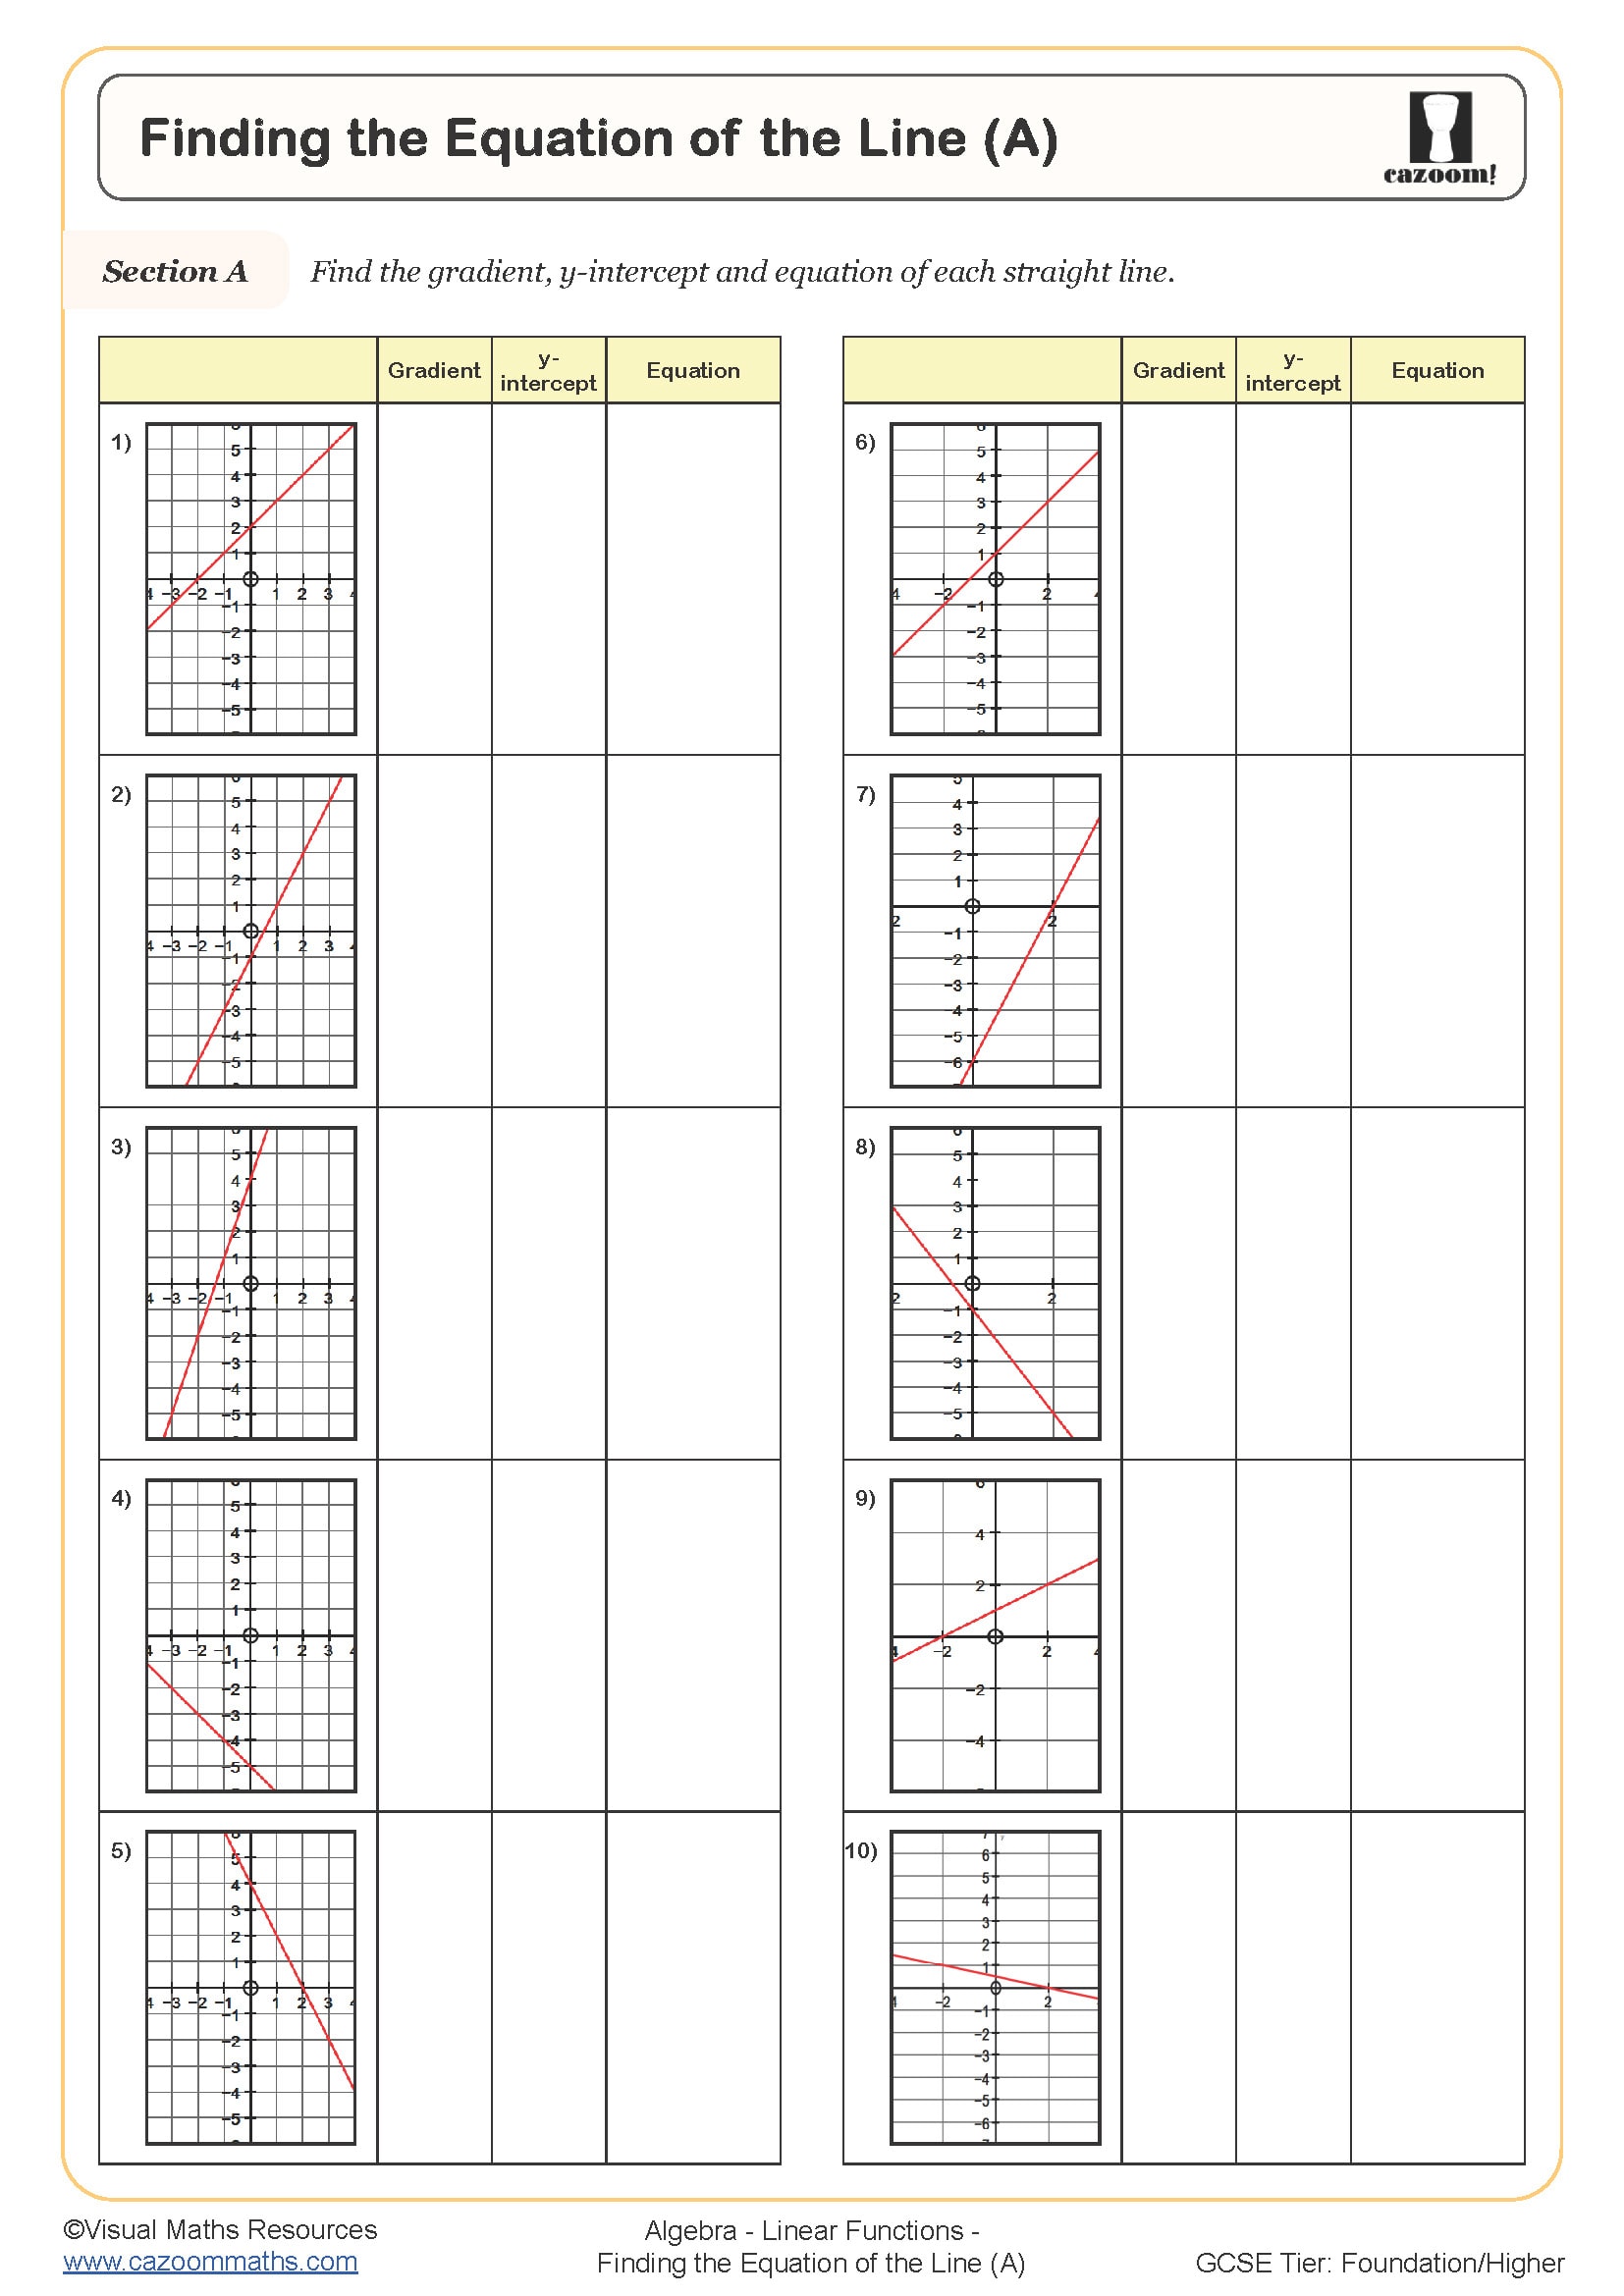
Finding the Equation of the Line (A)
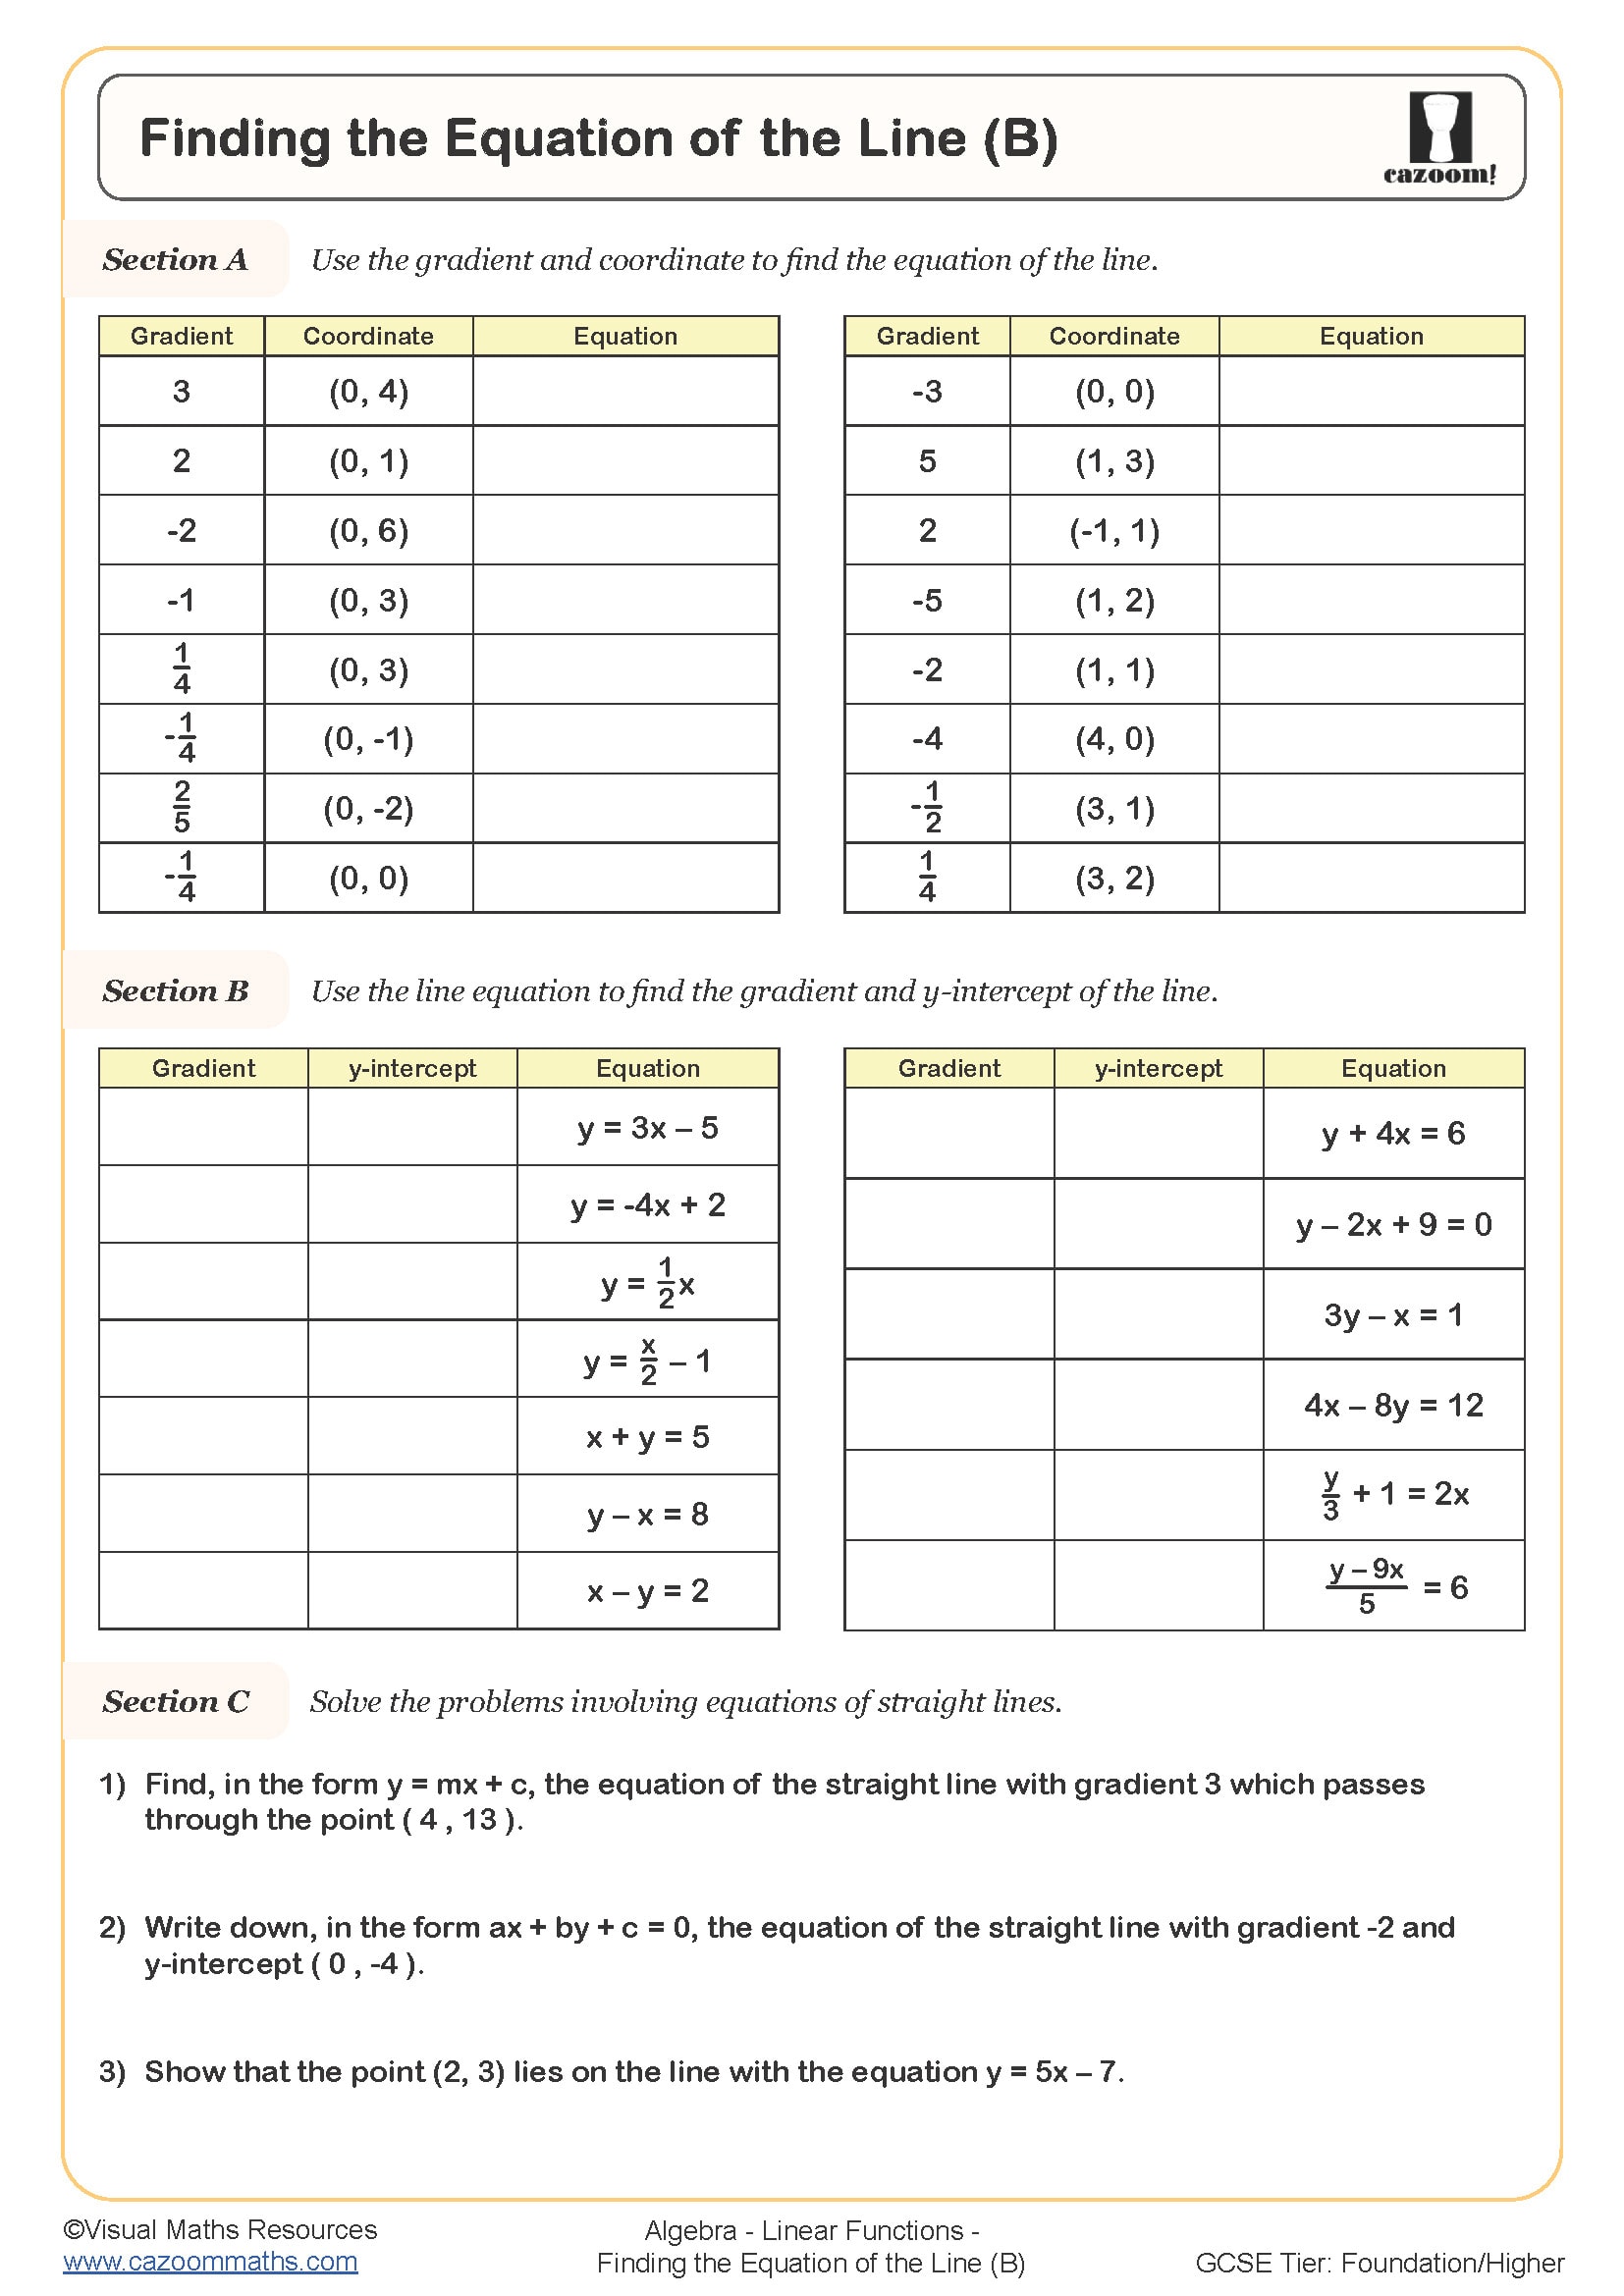
Finding the Equation of the Line (B)
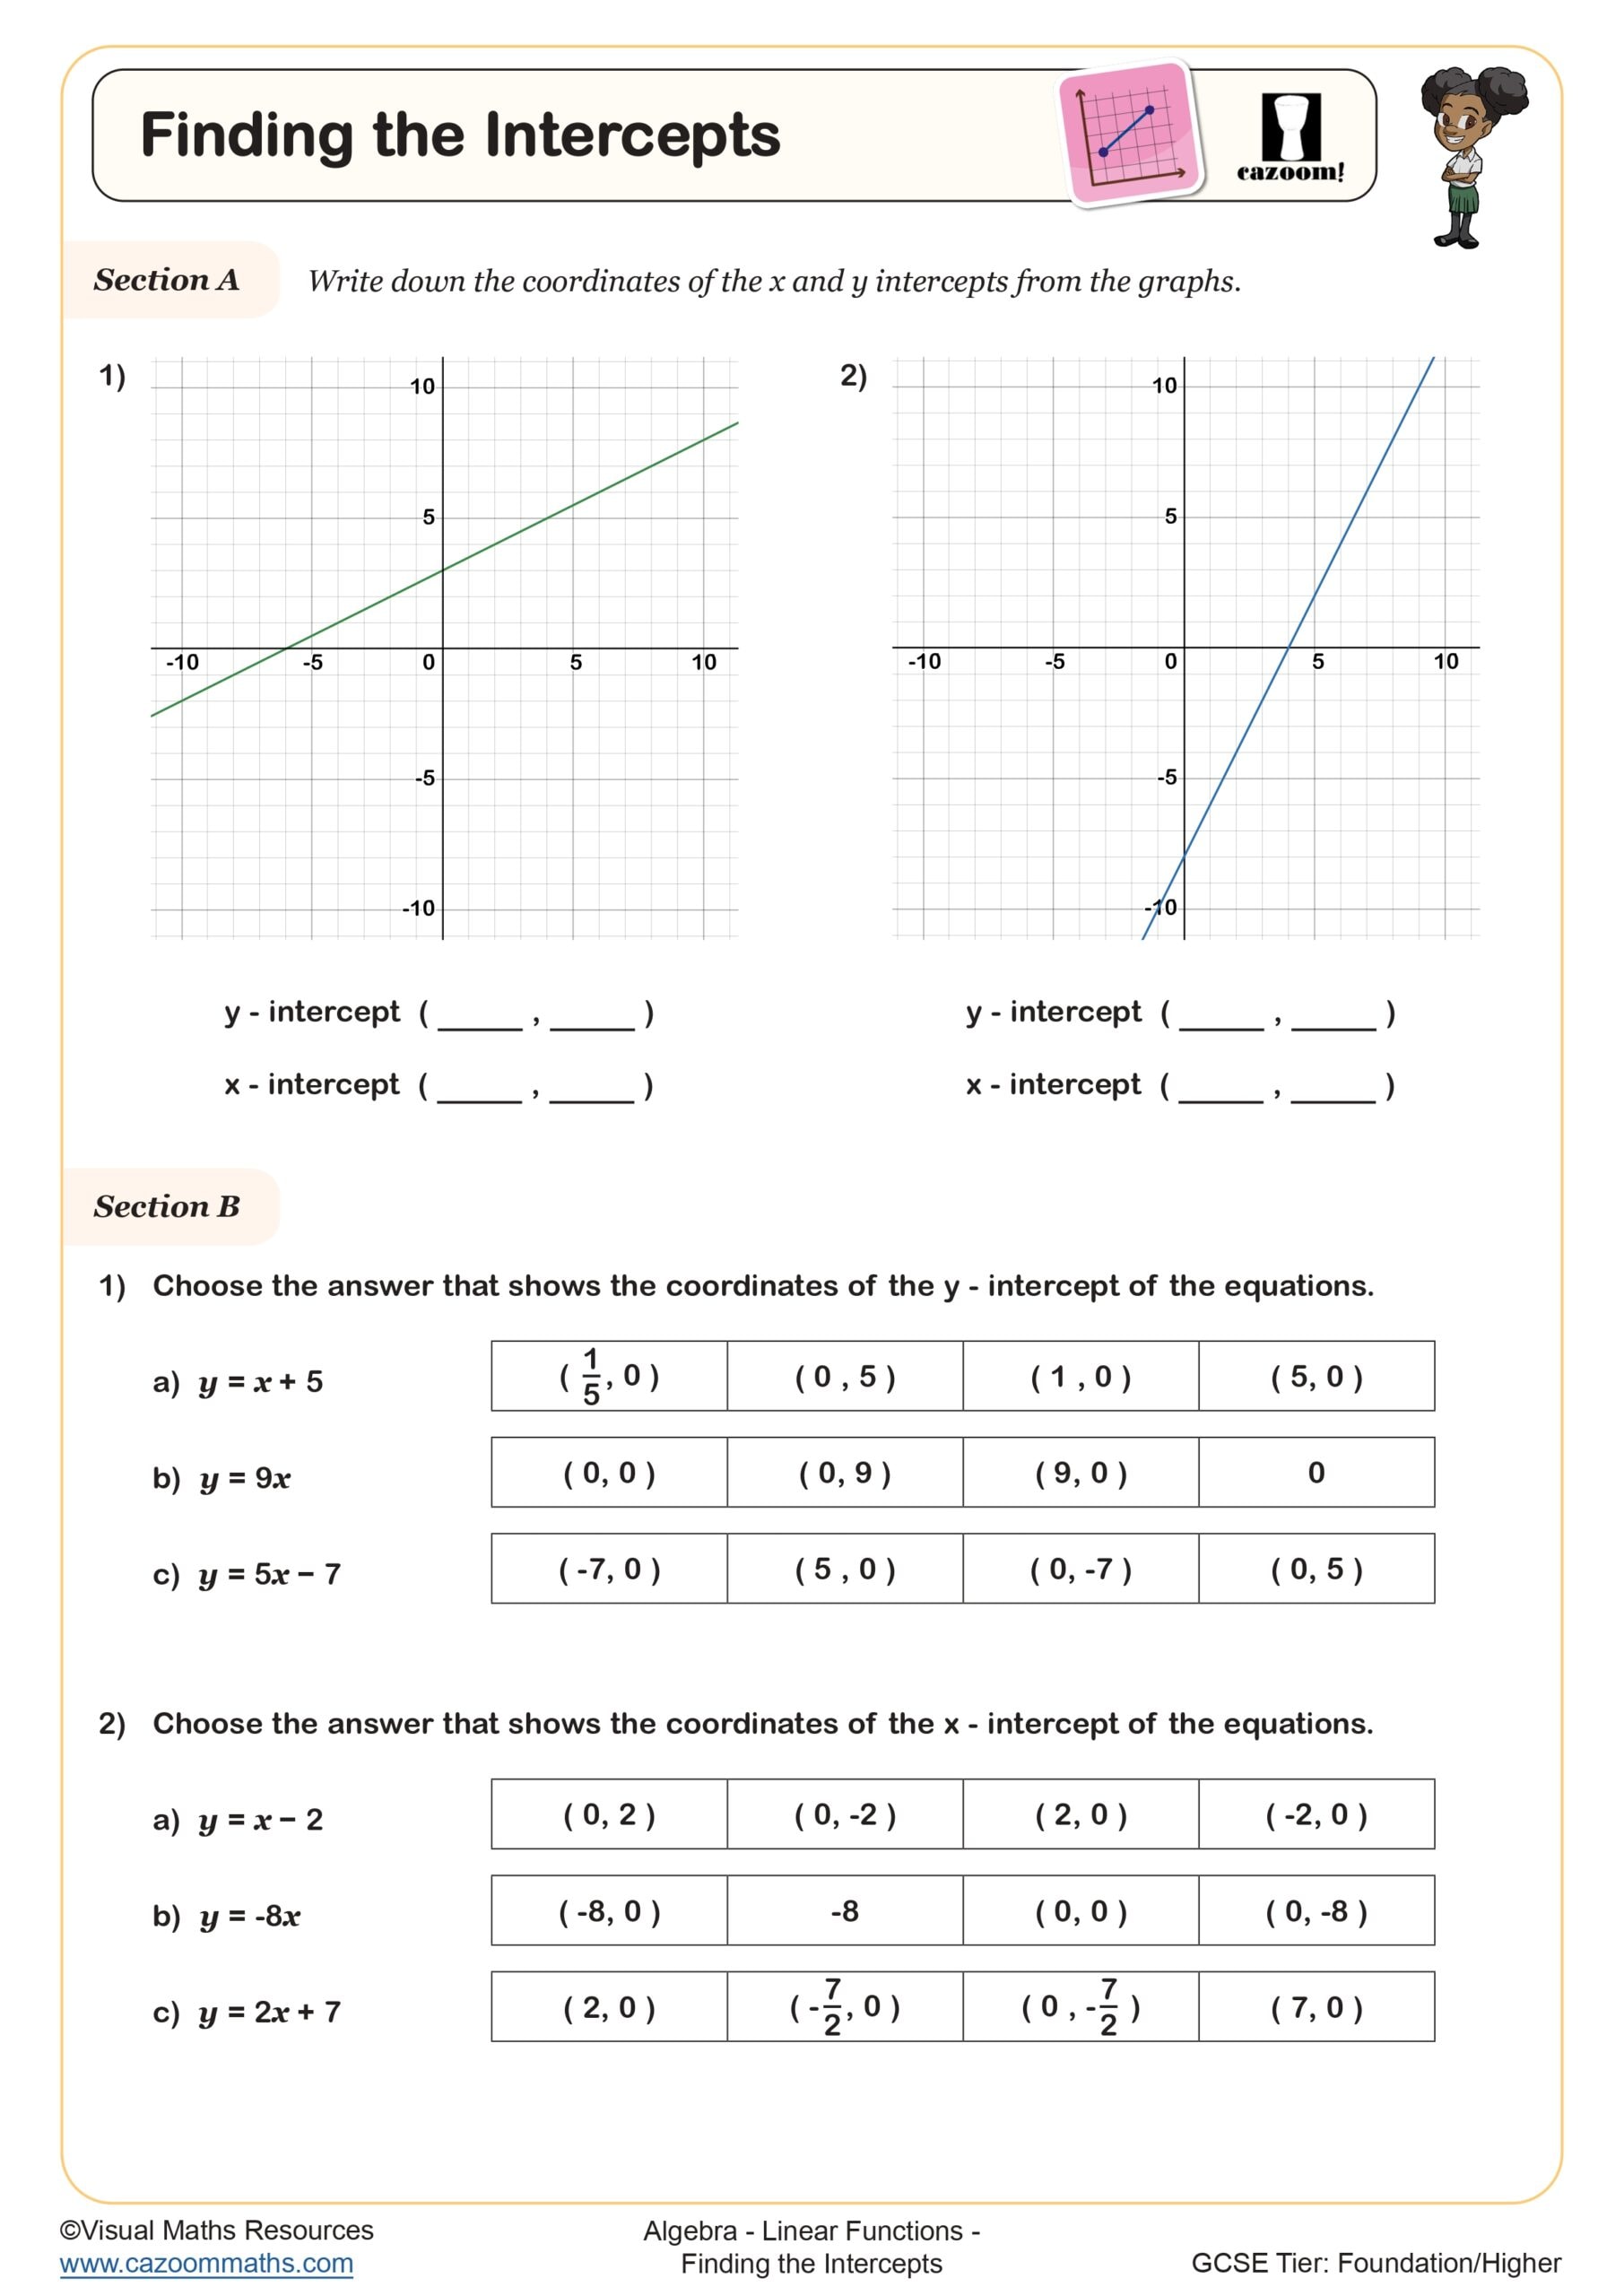
Finding the Intercepts
Investigating Straight Line Graphs

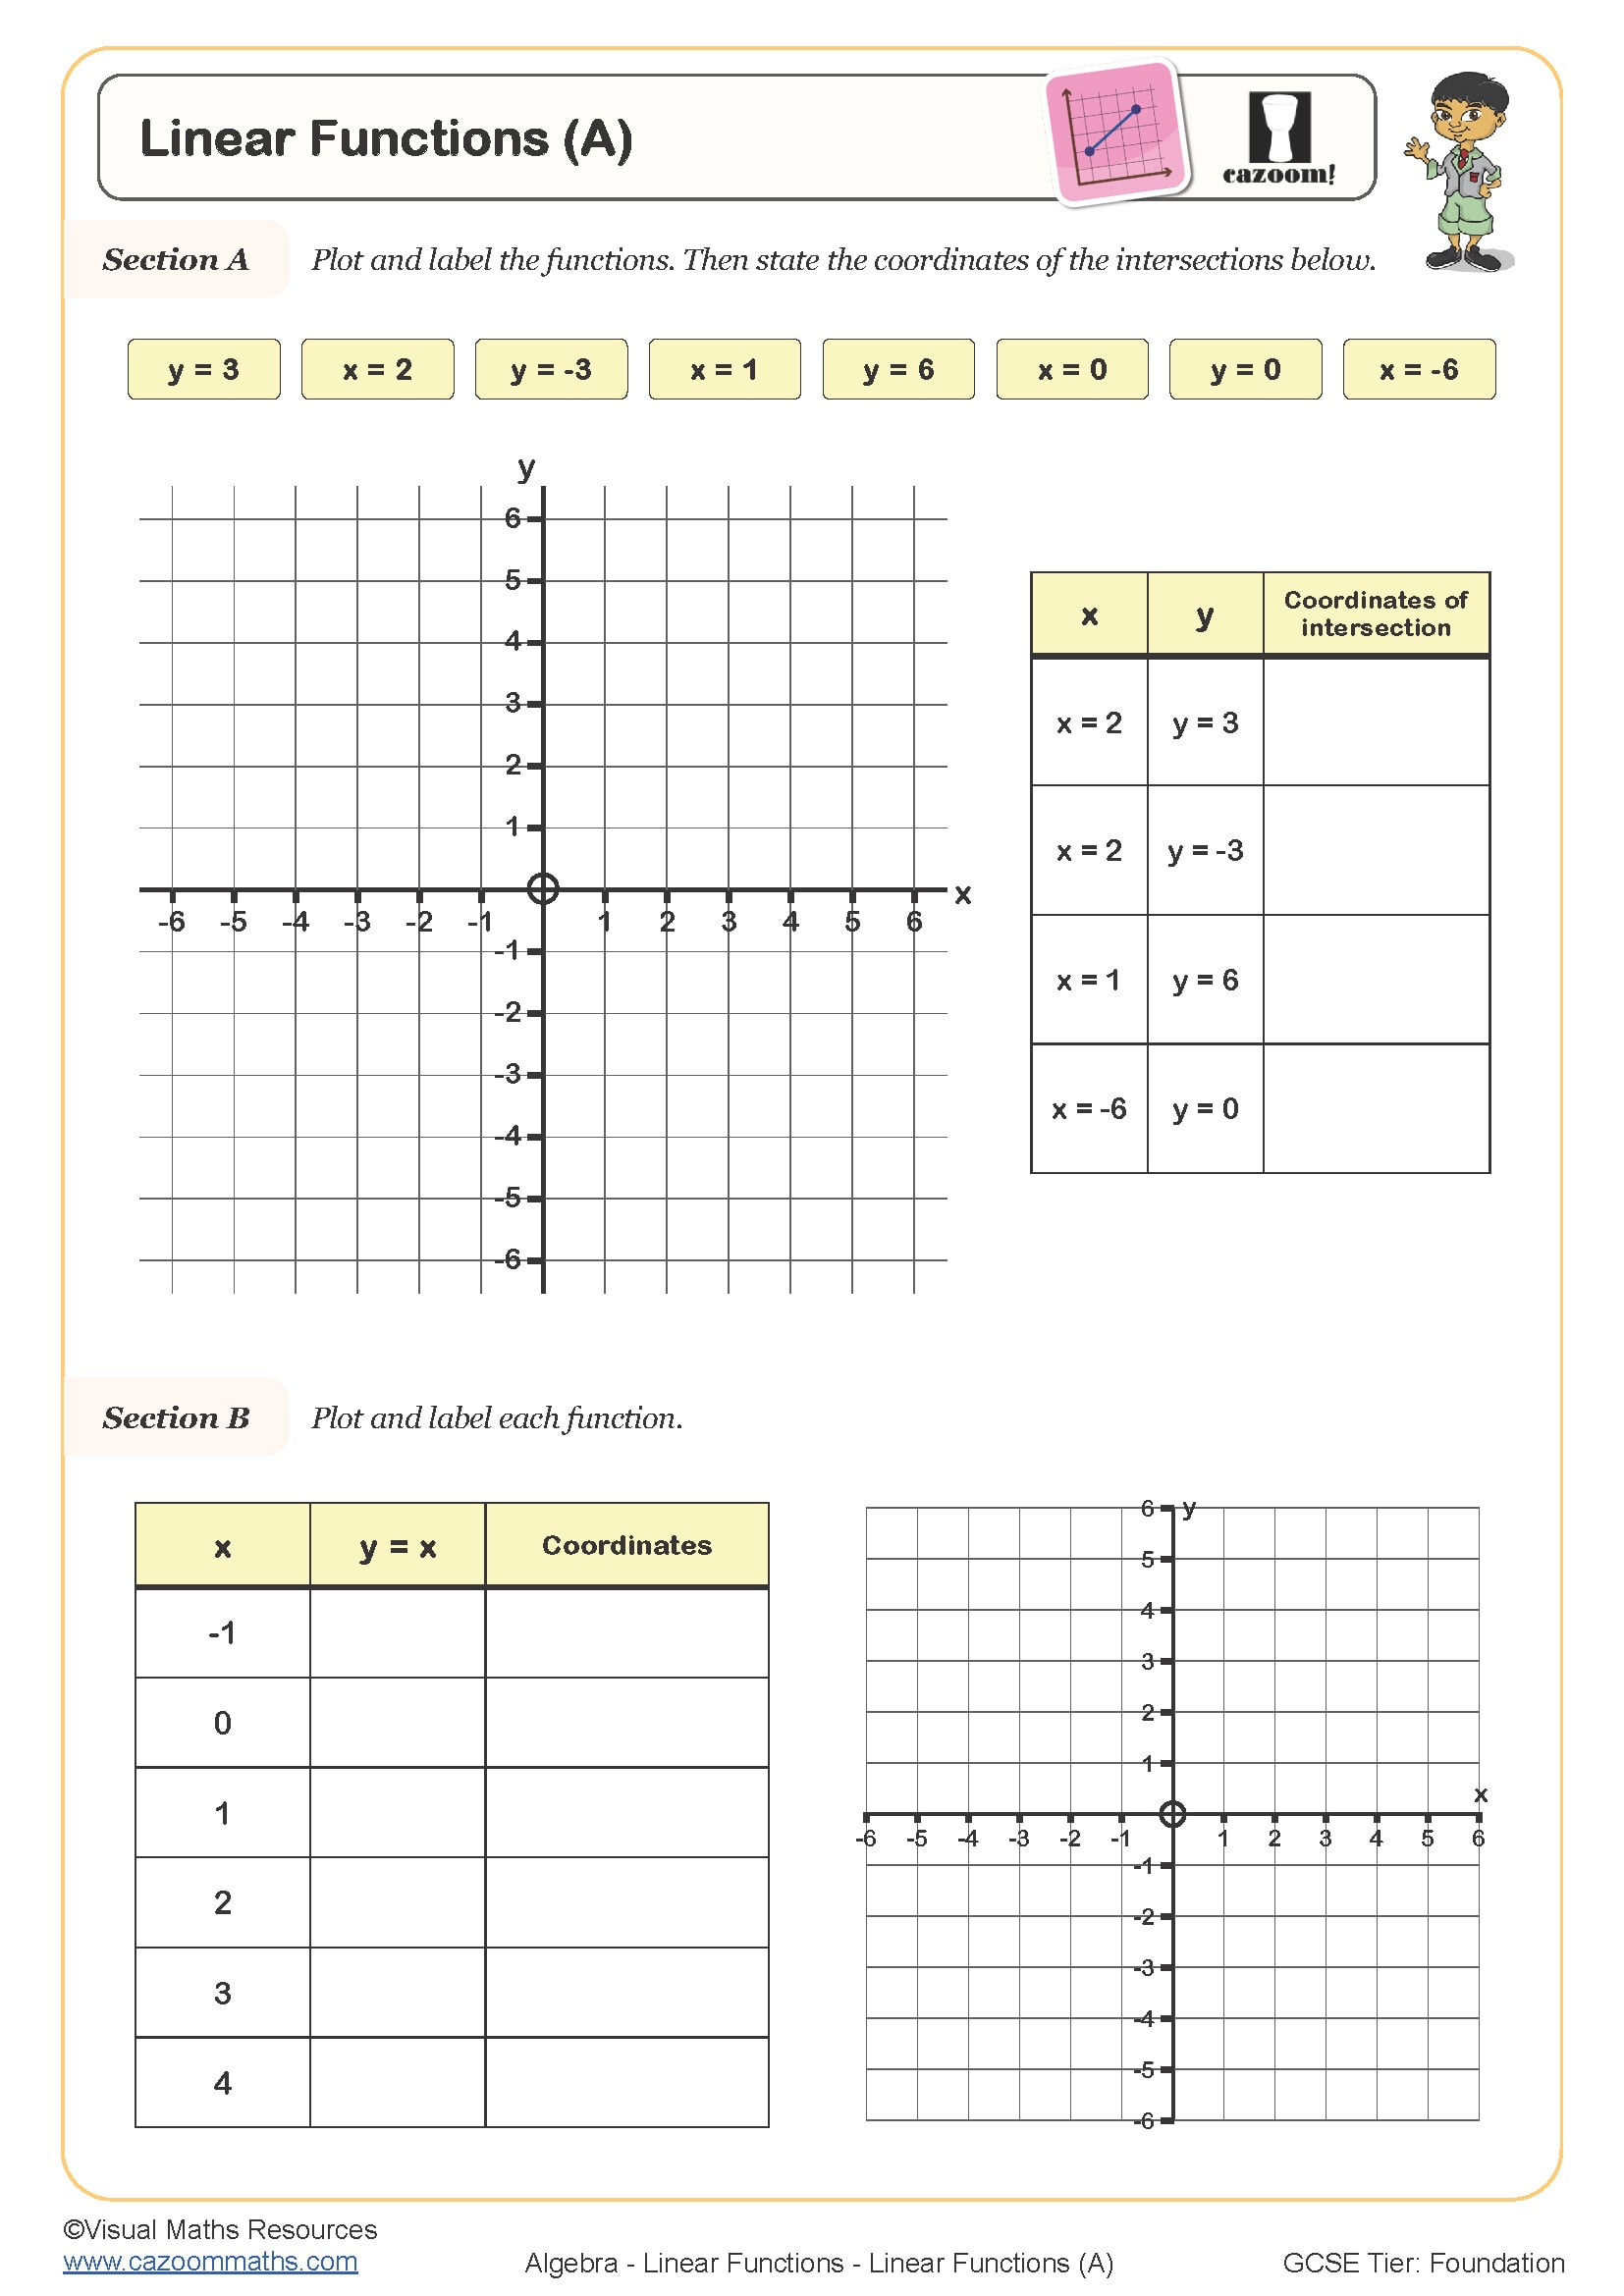
Linear Functions (A)
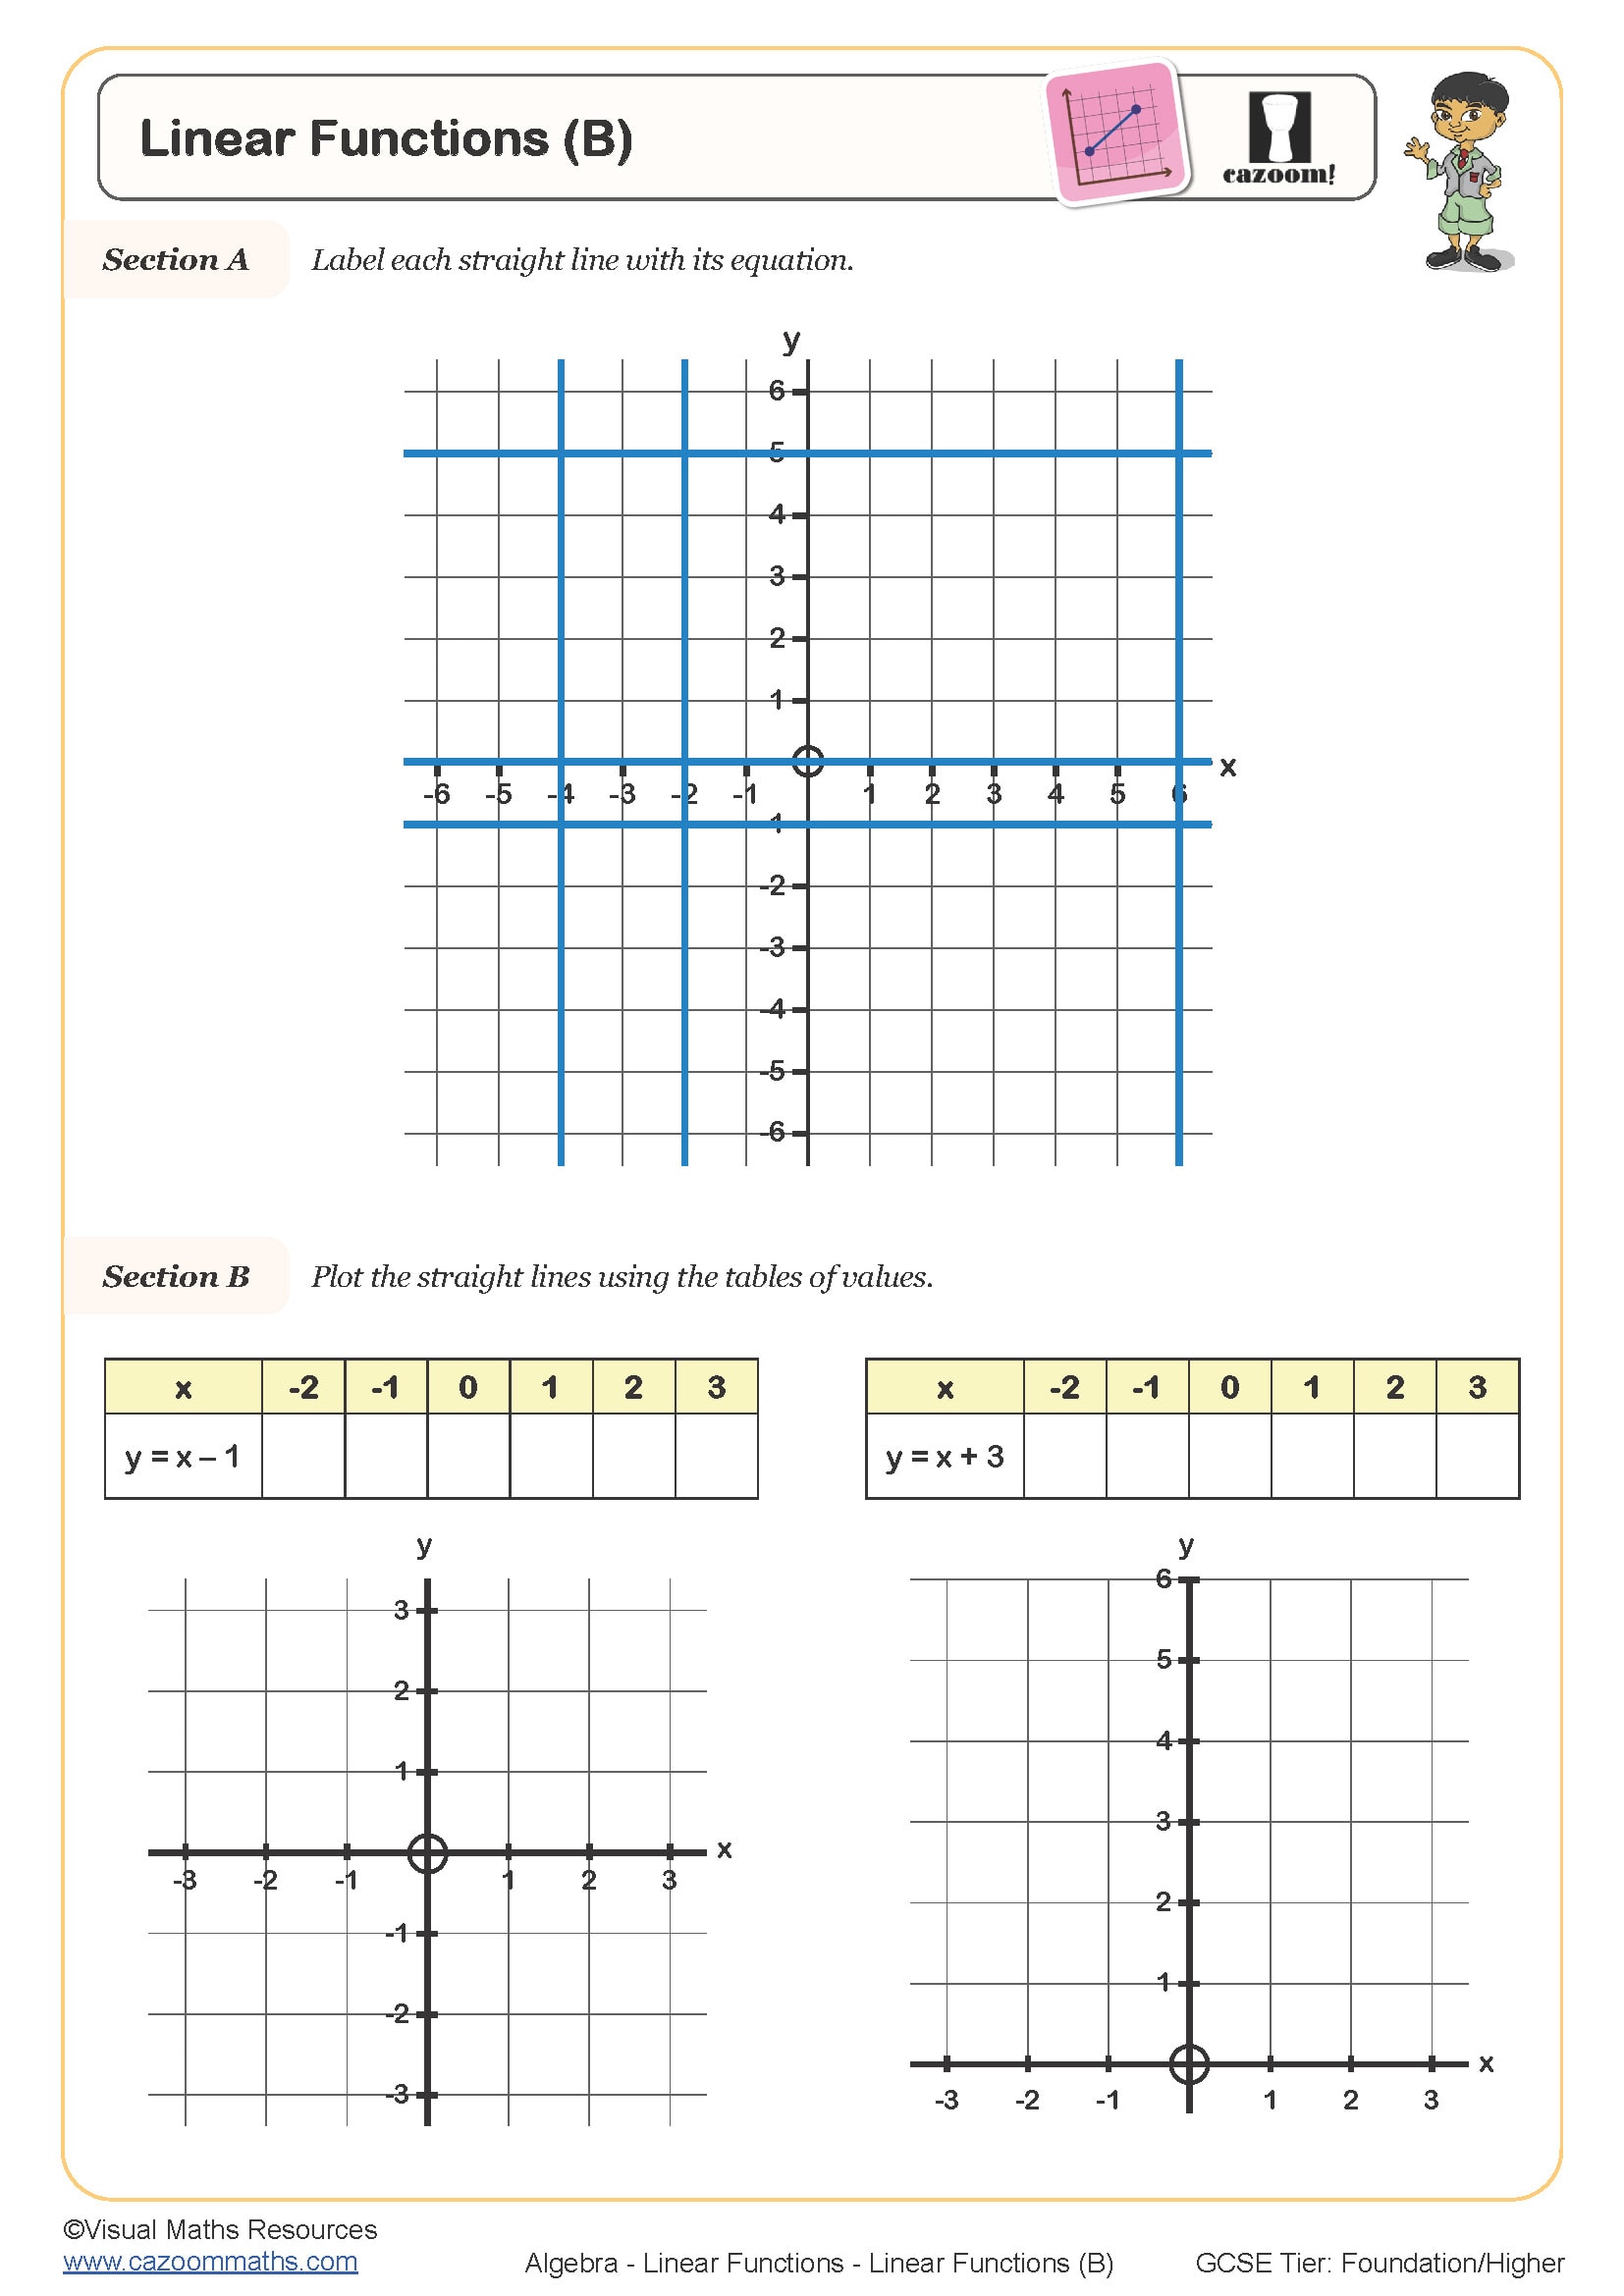
Linear Functions (B)
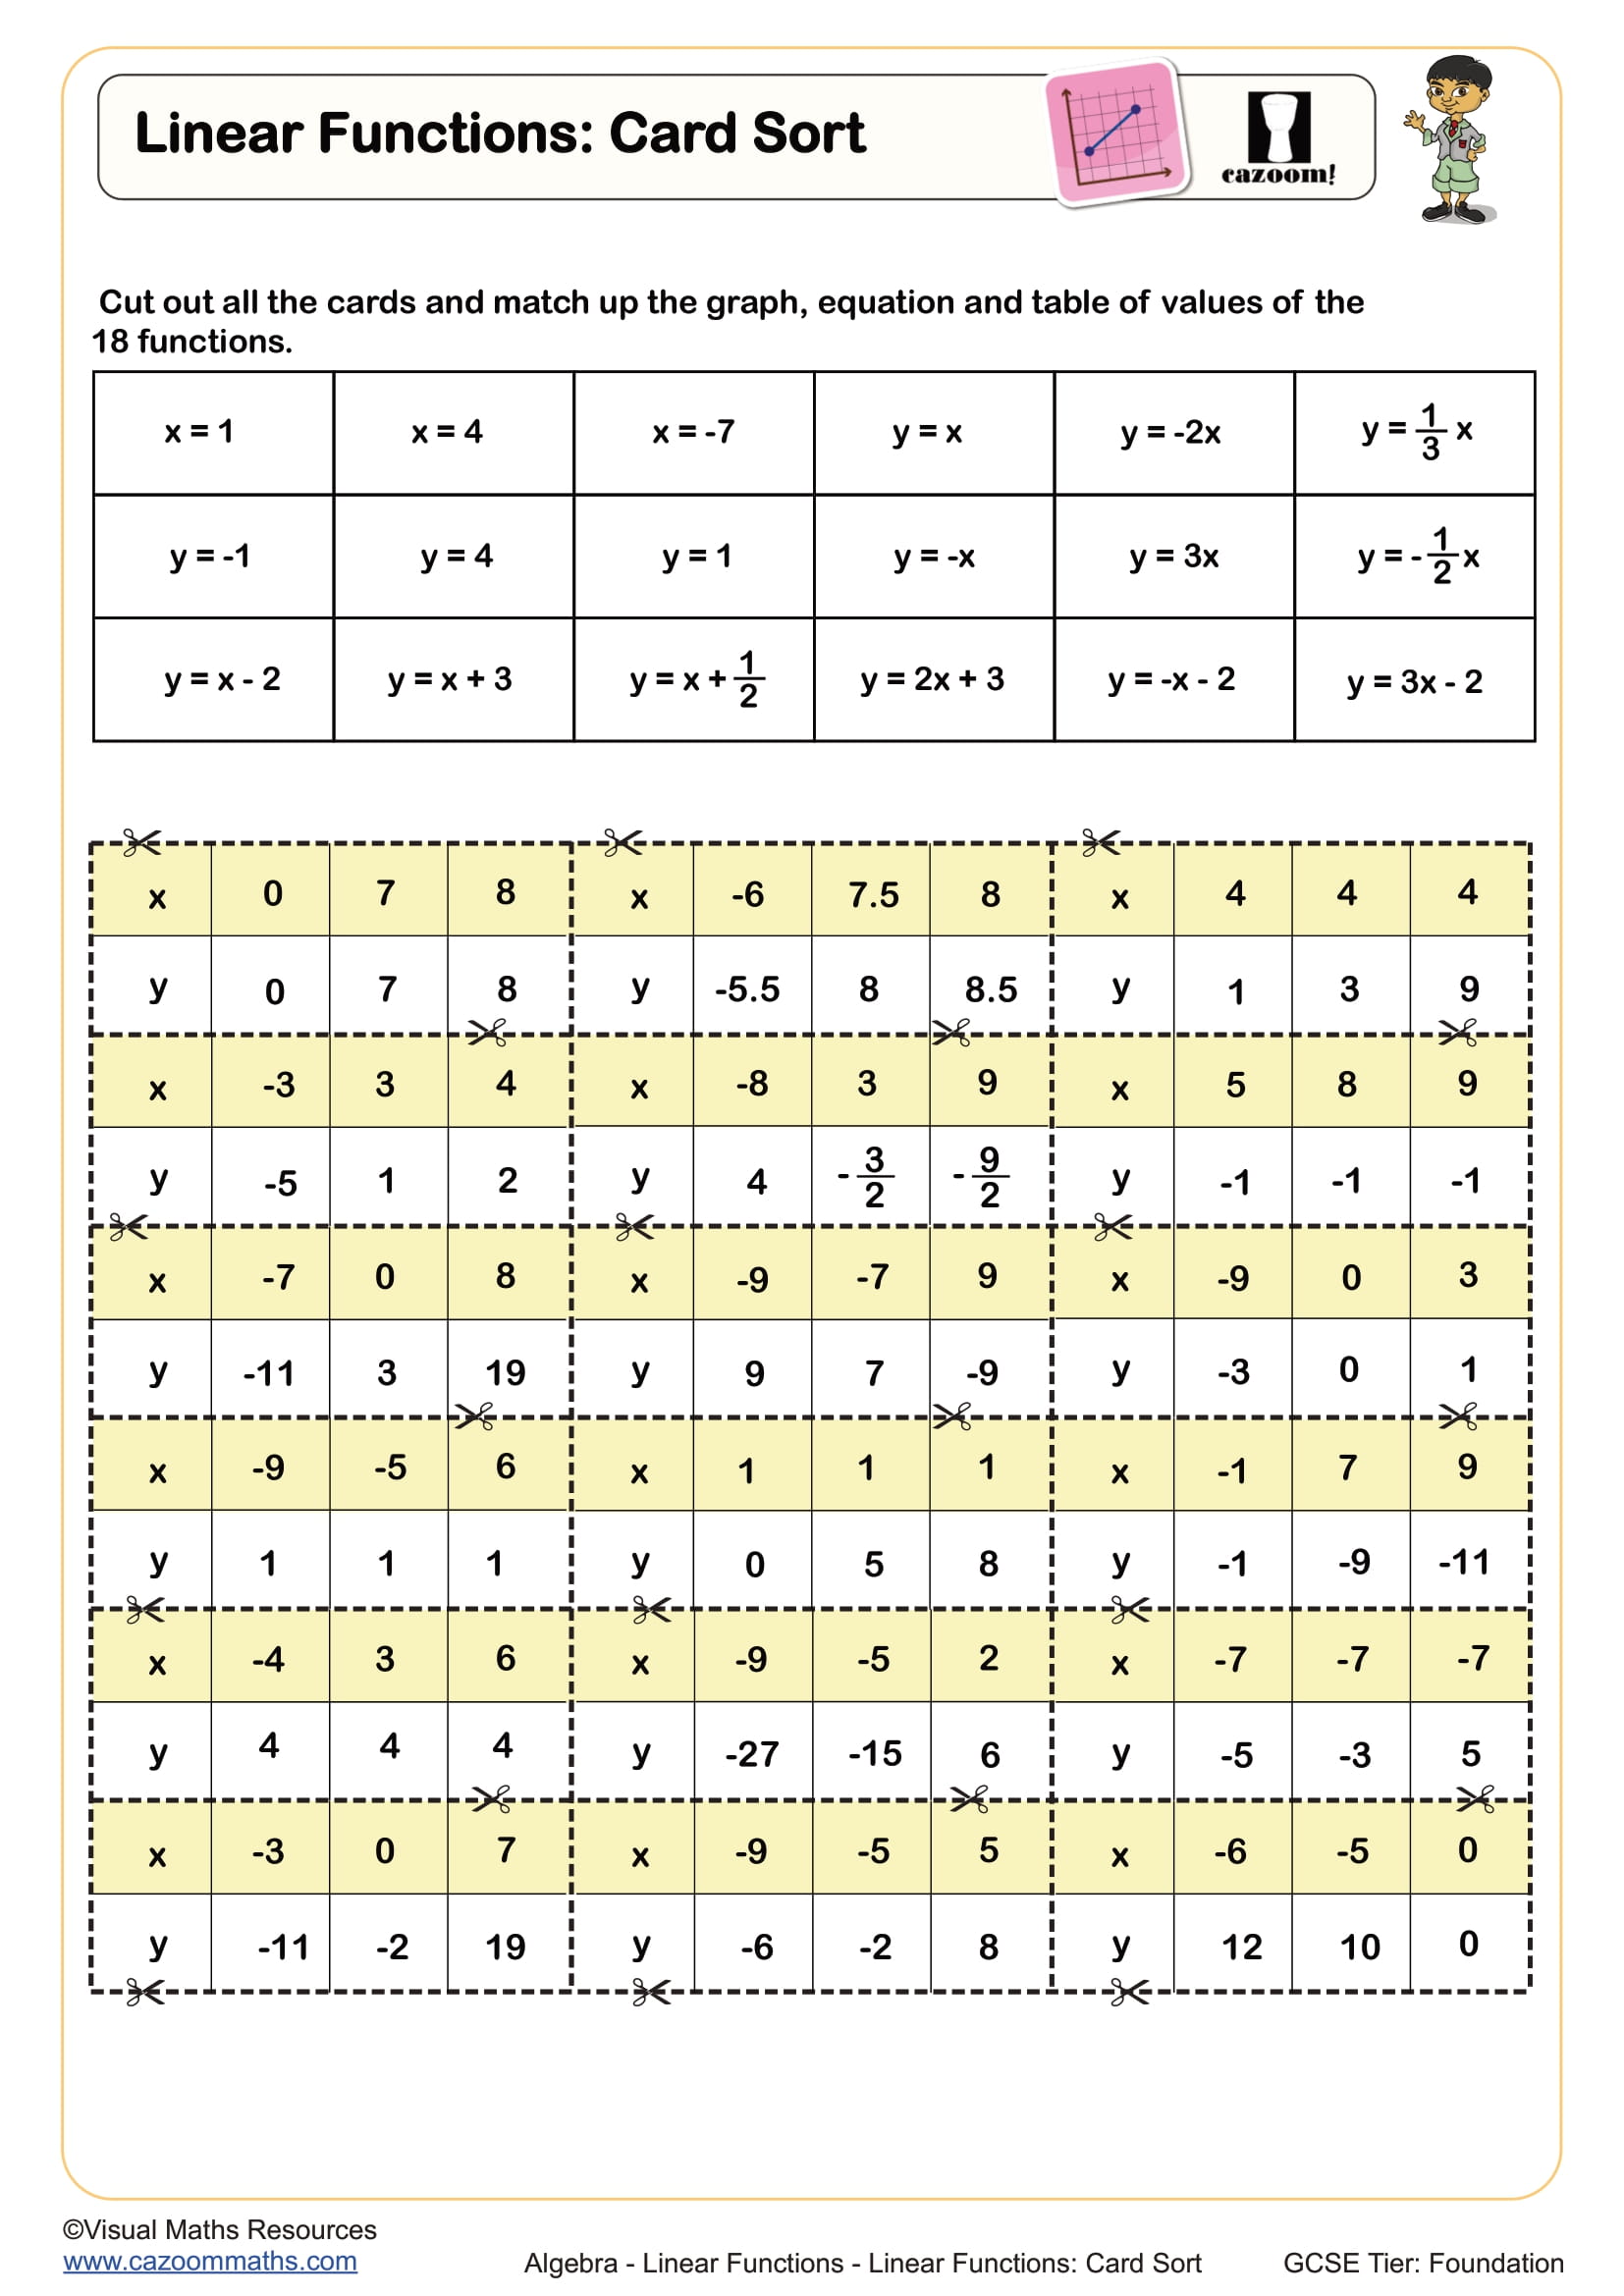
Linear Functions: Card Sort
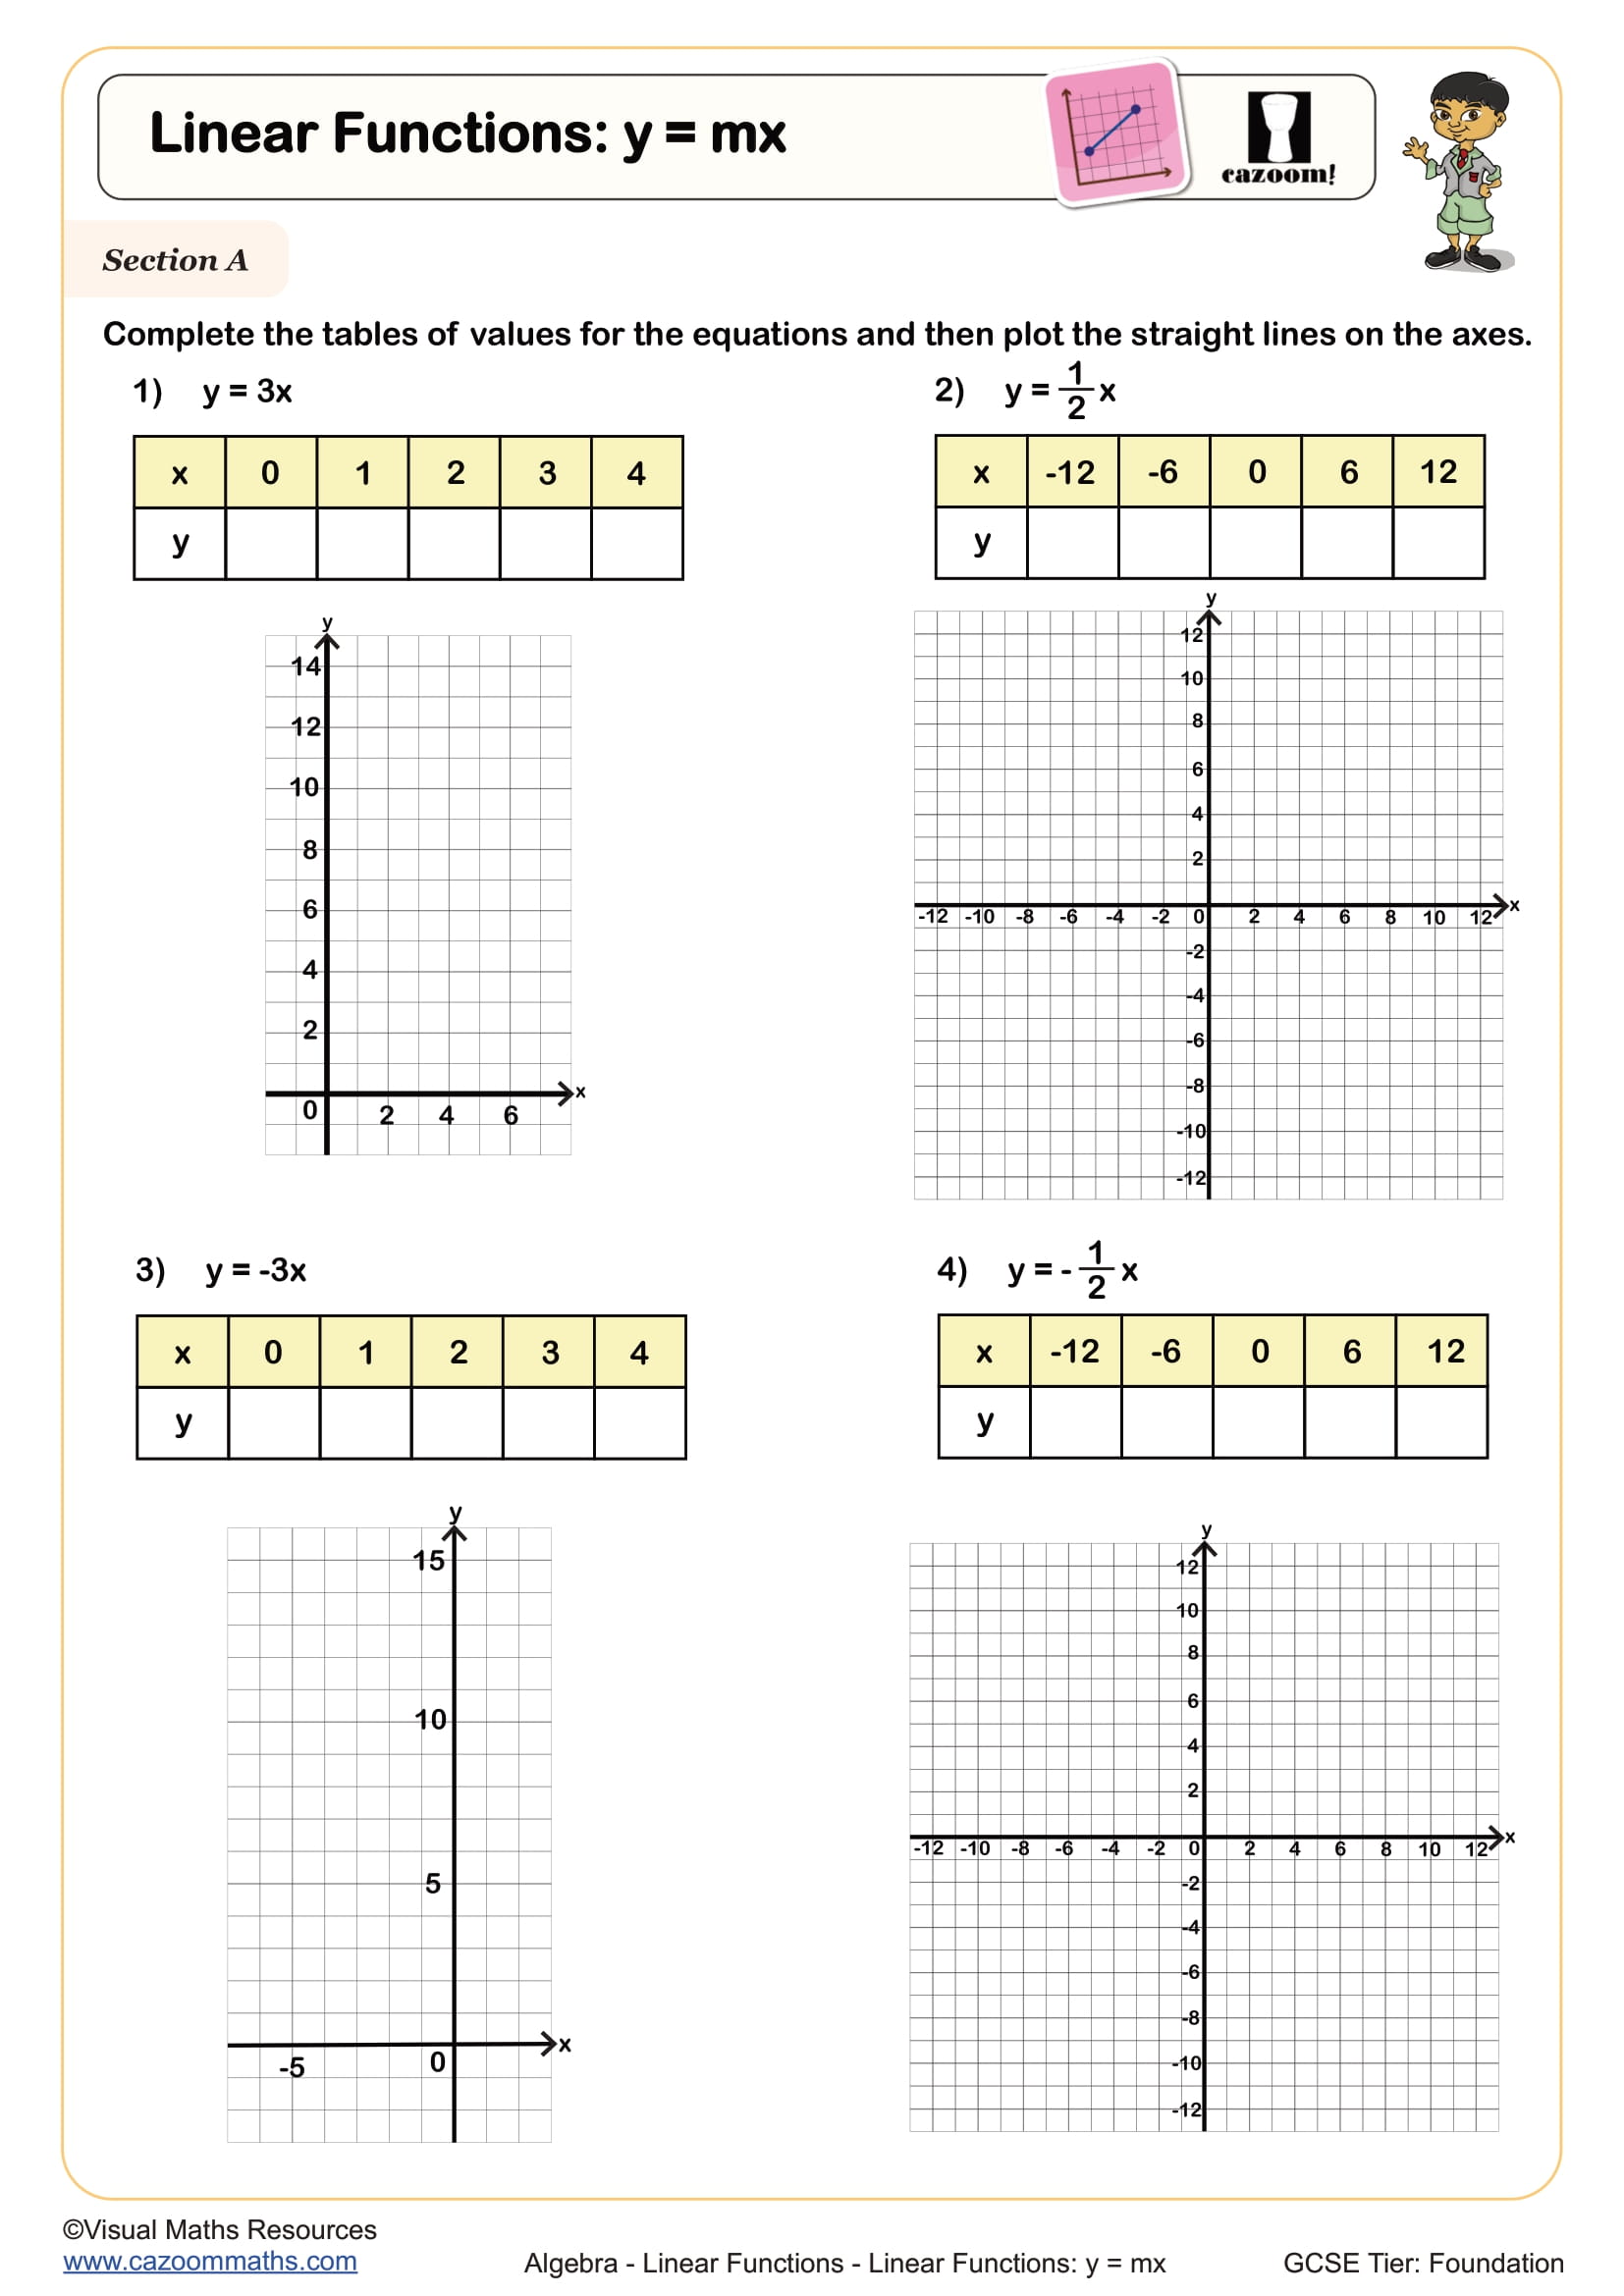
Linear Functions: y = mx
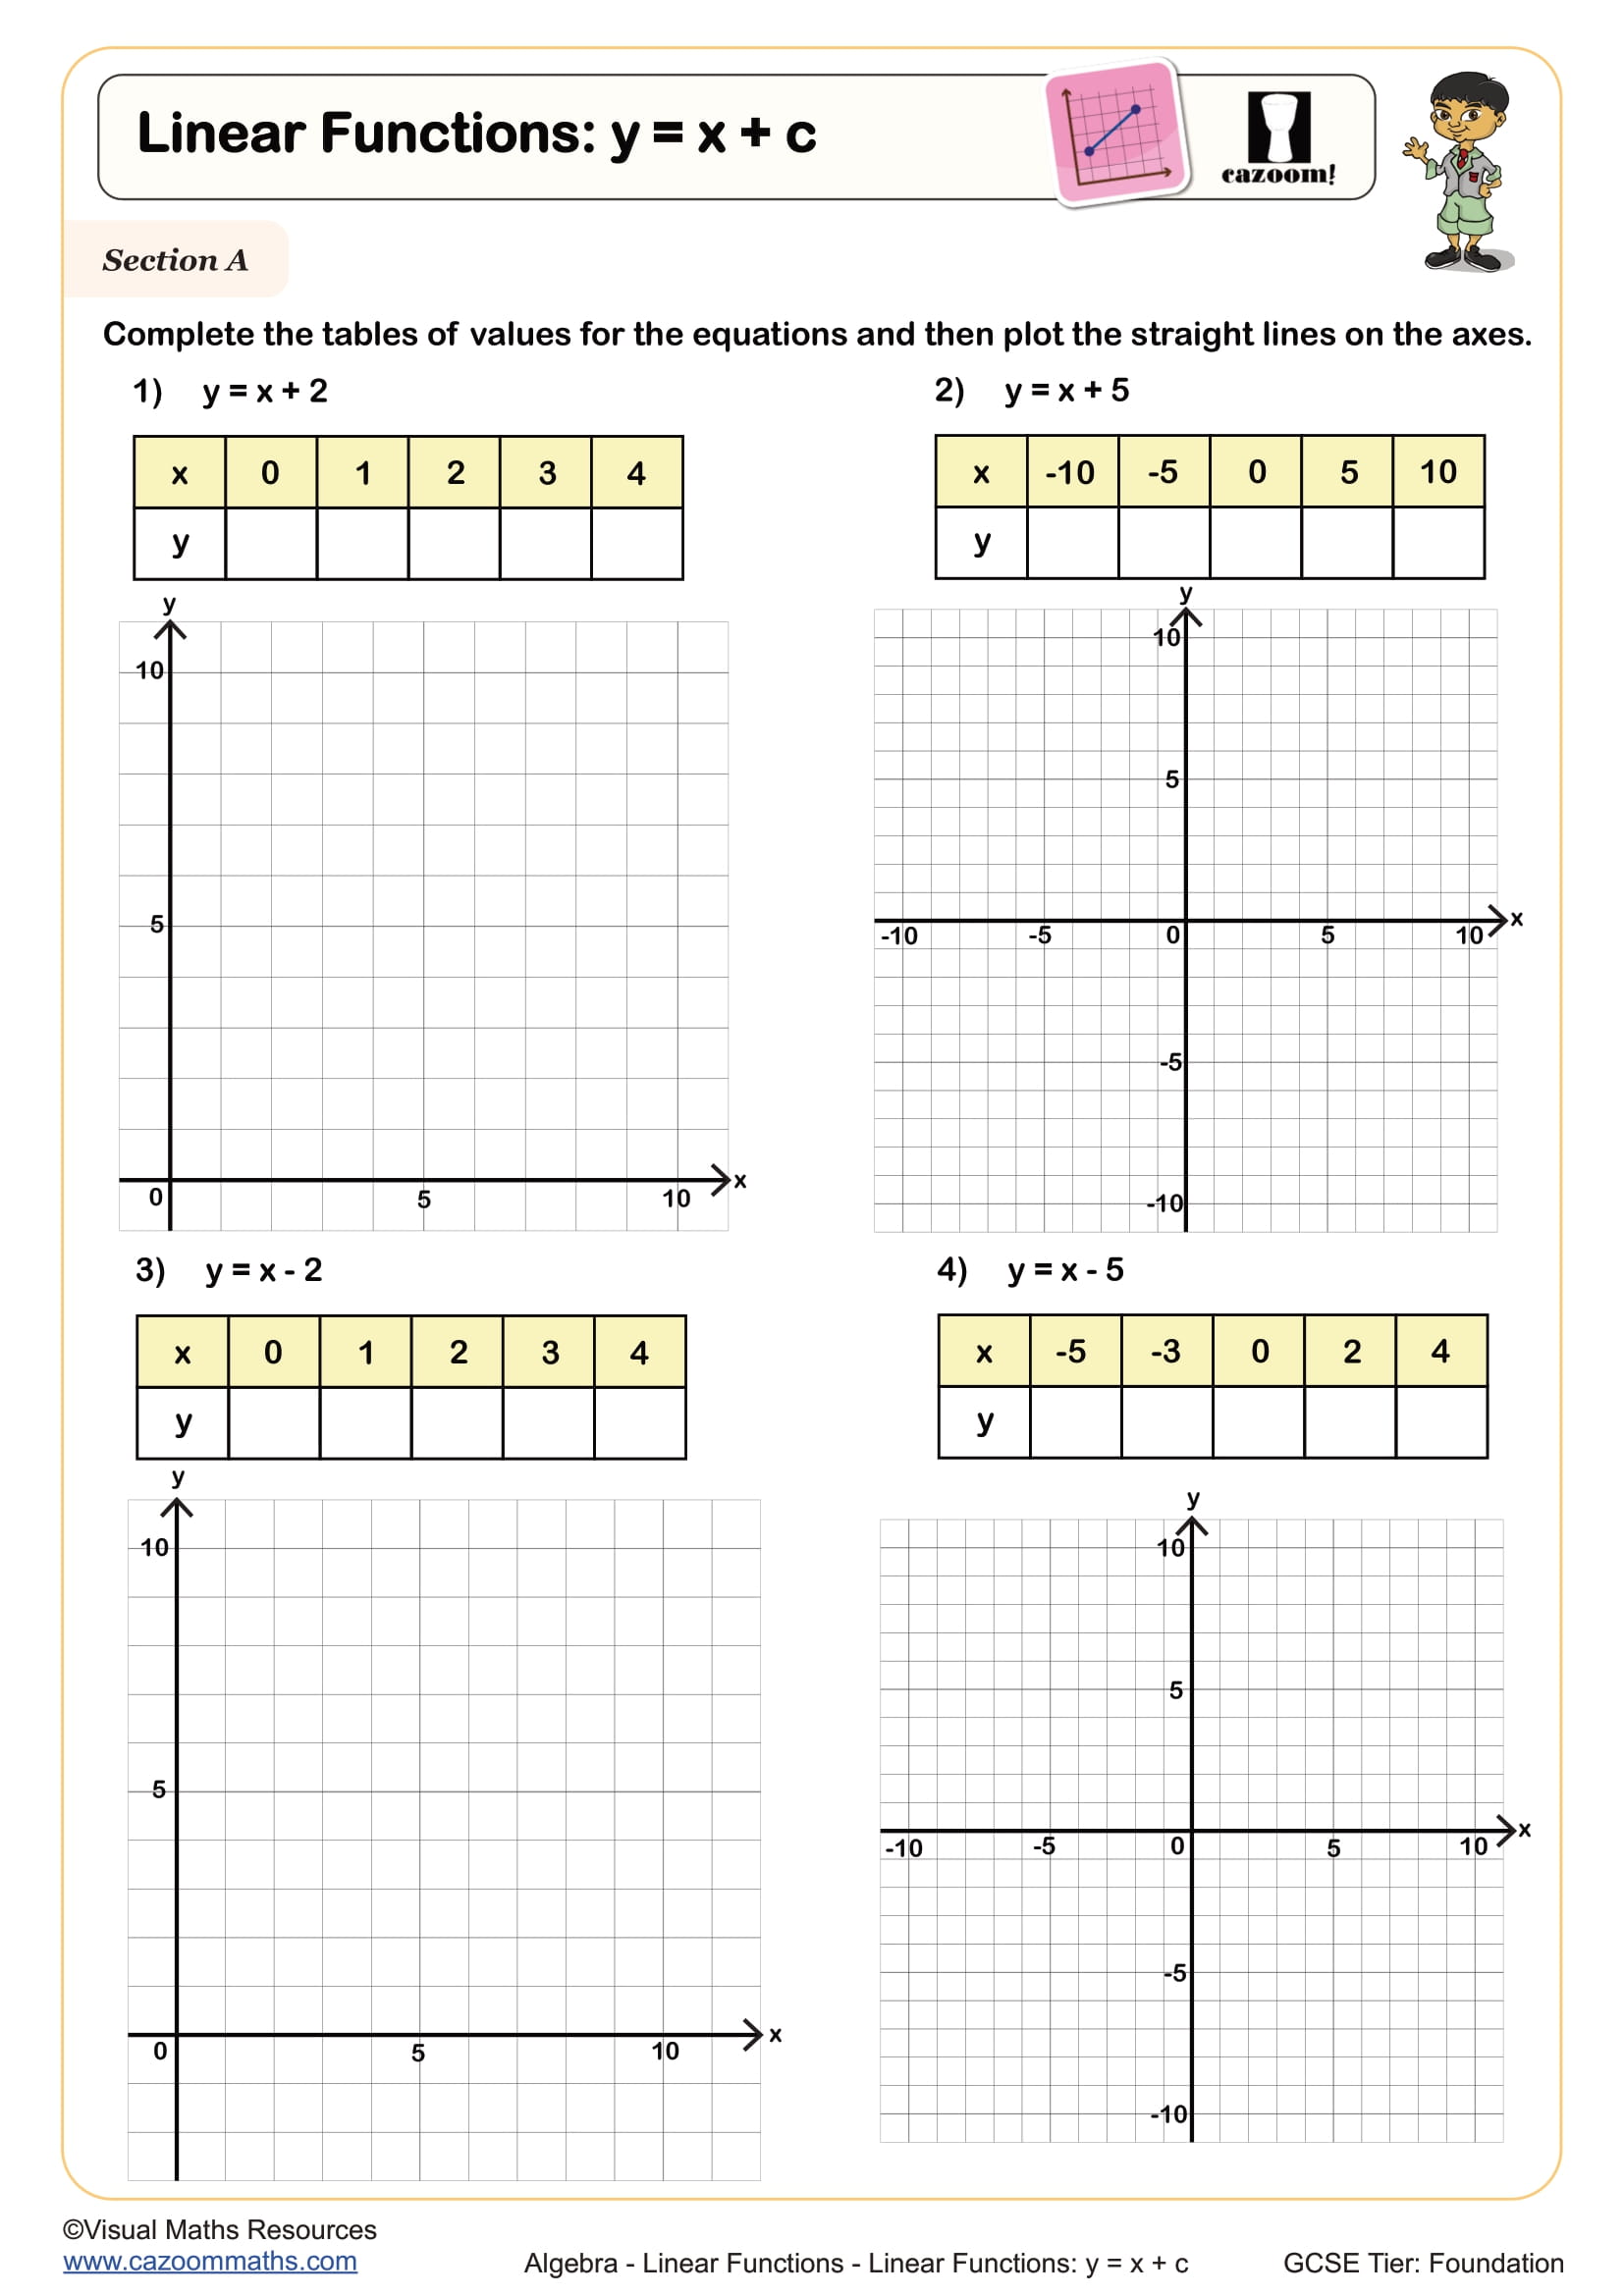
Linear Functions: y = x + c
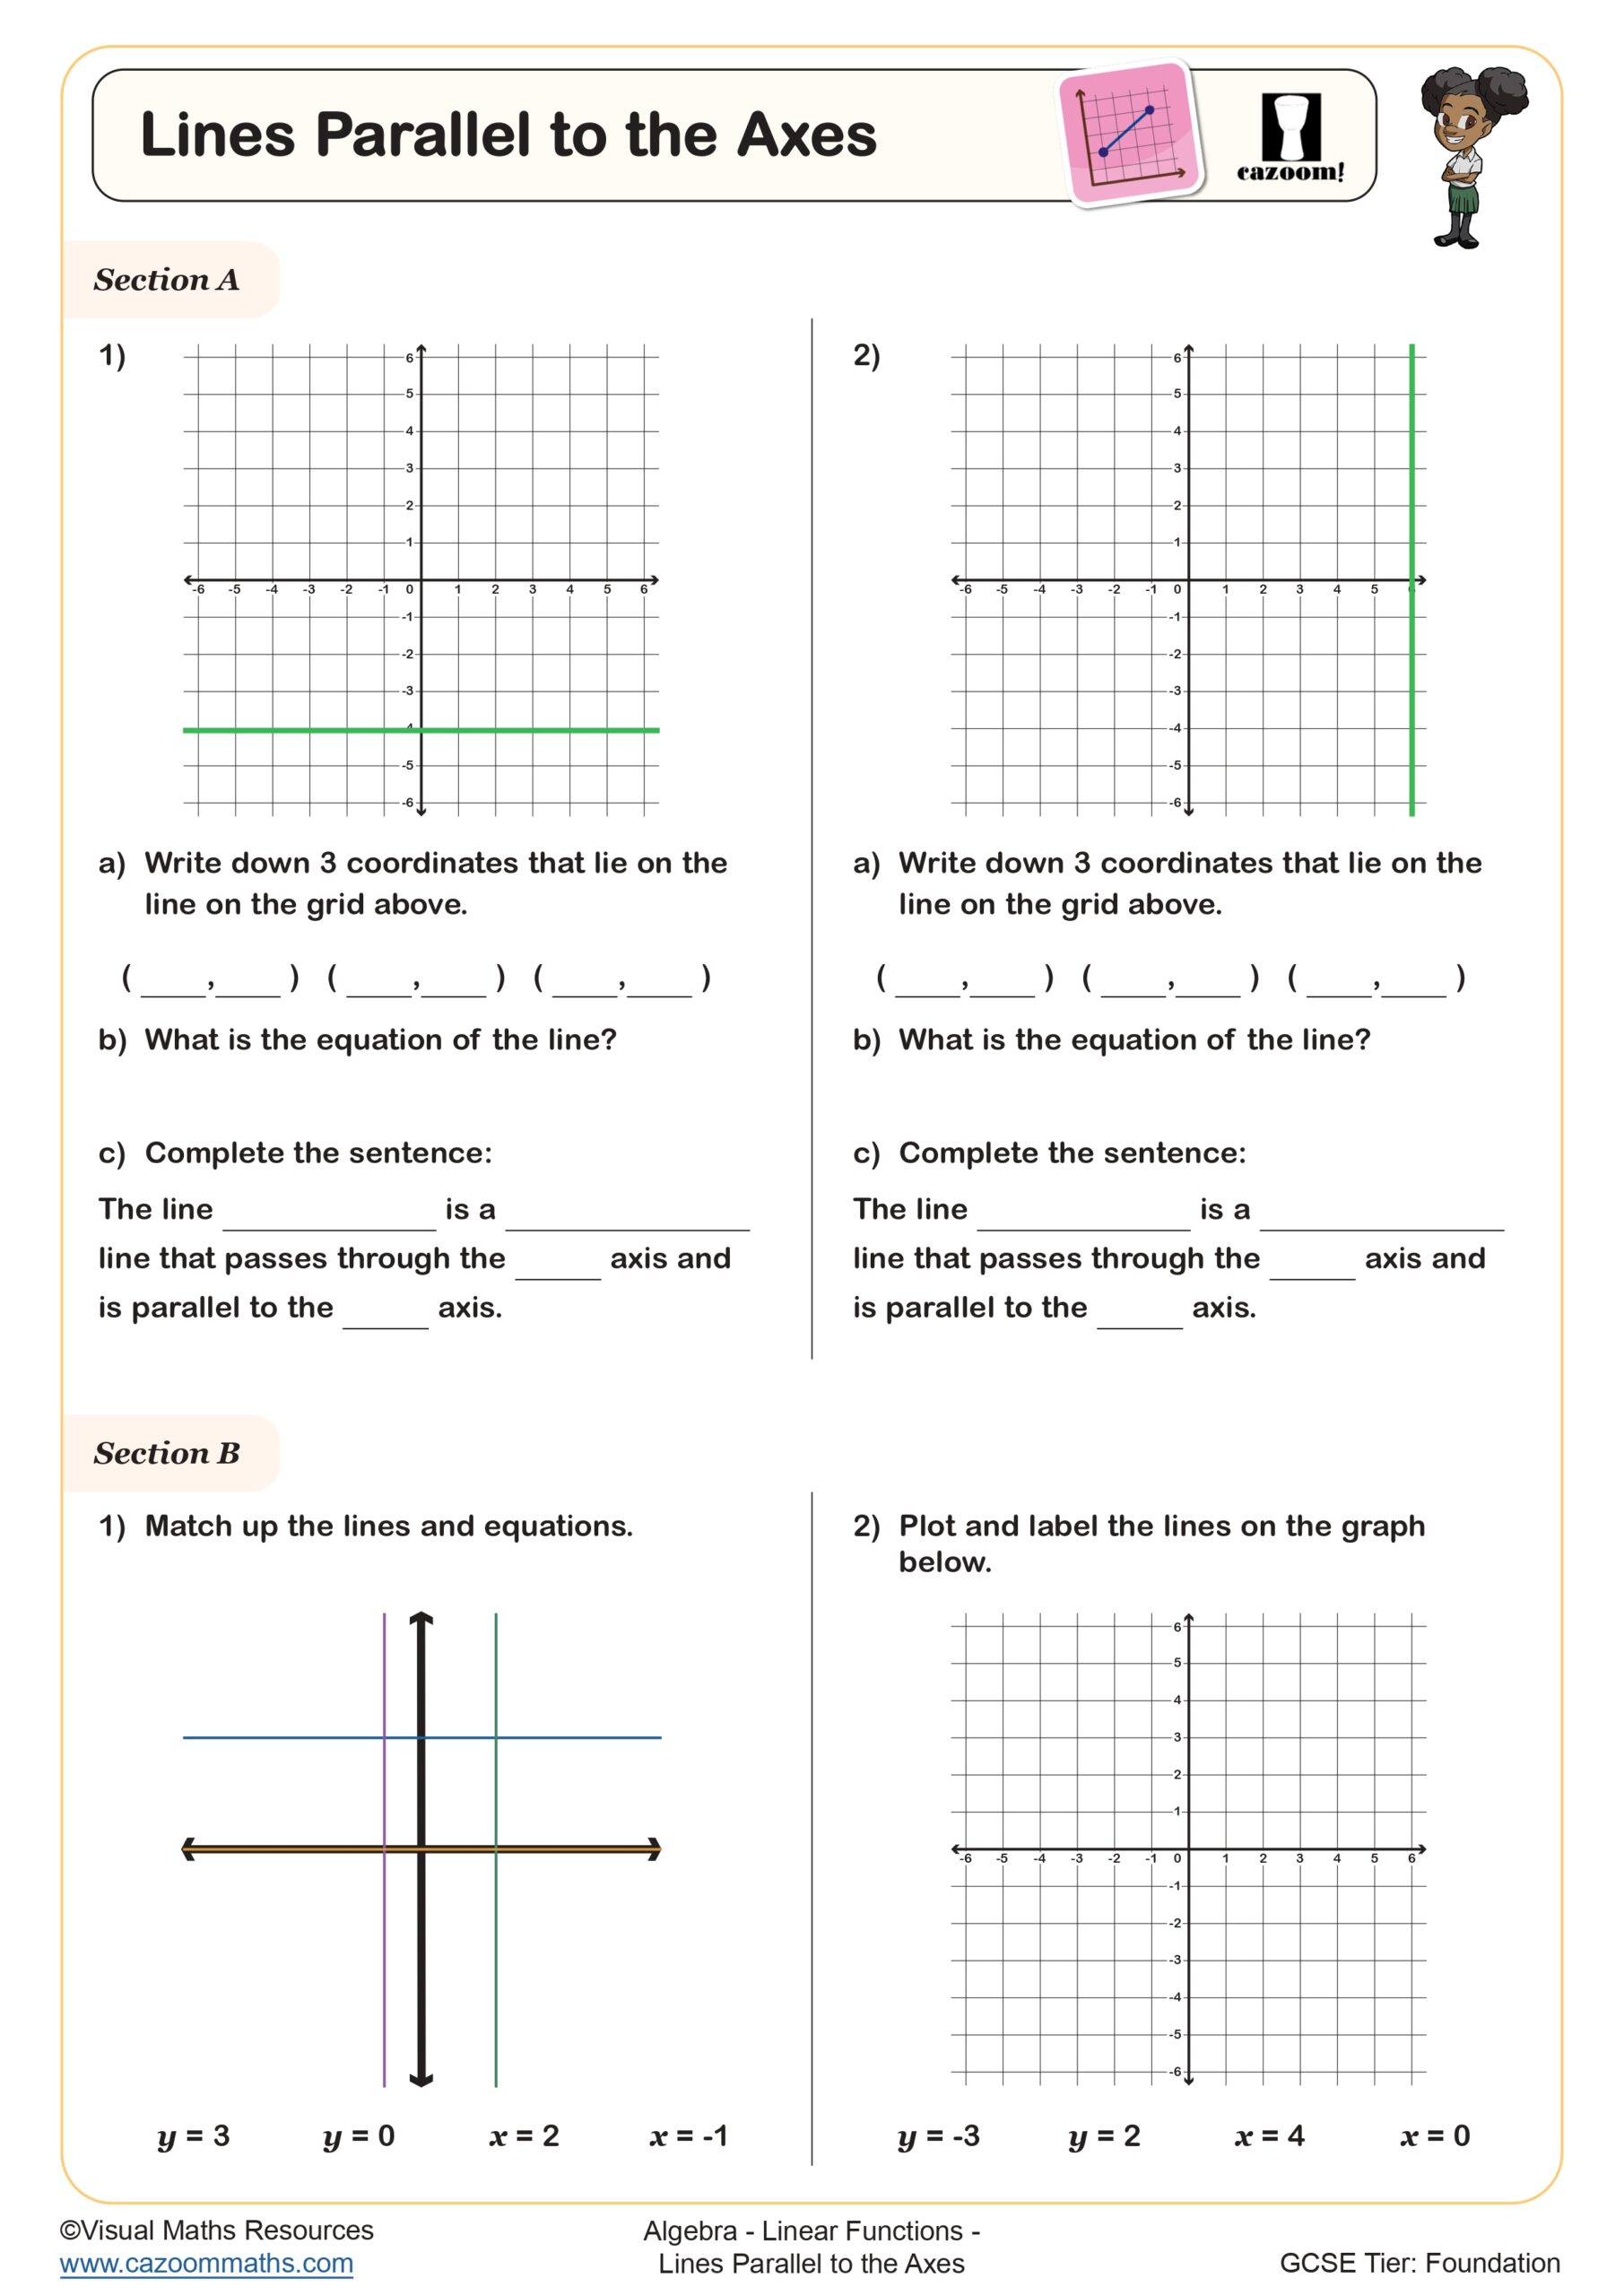
Lines Parallel to the Axes
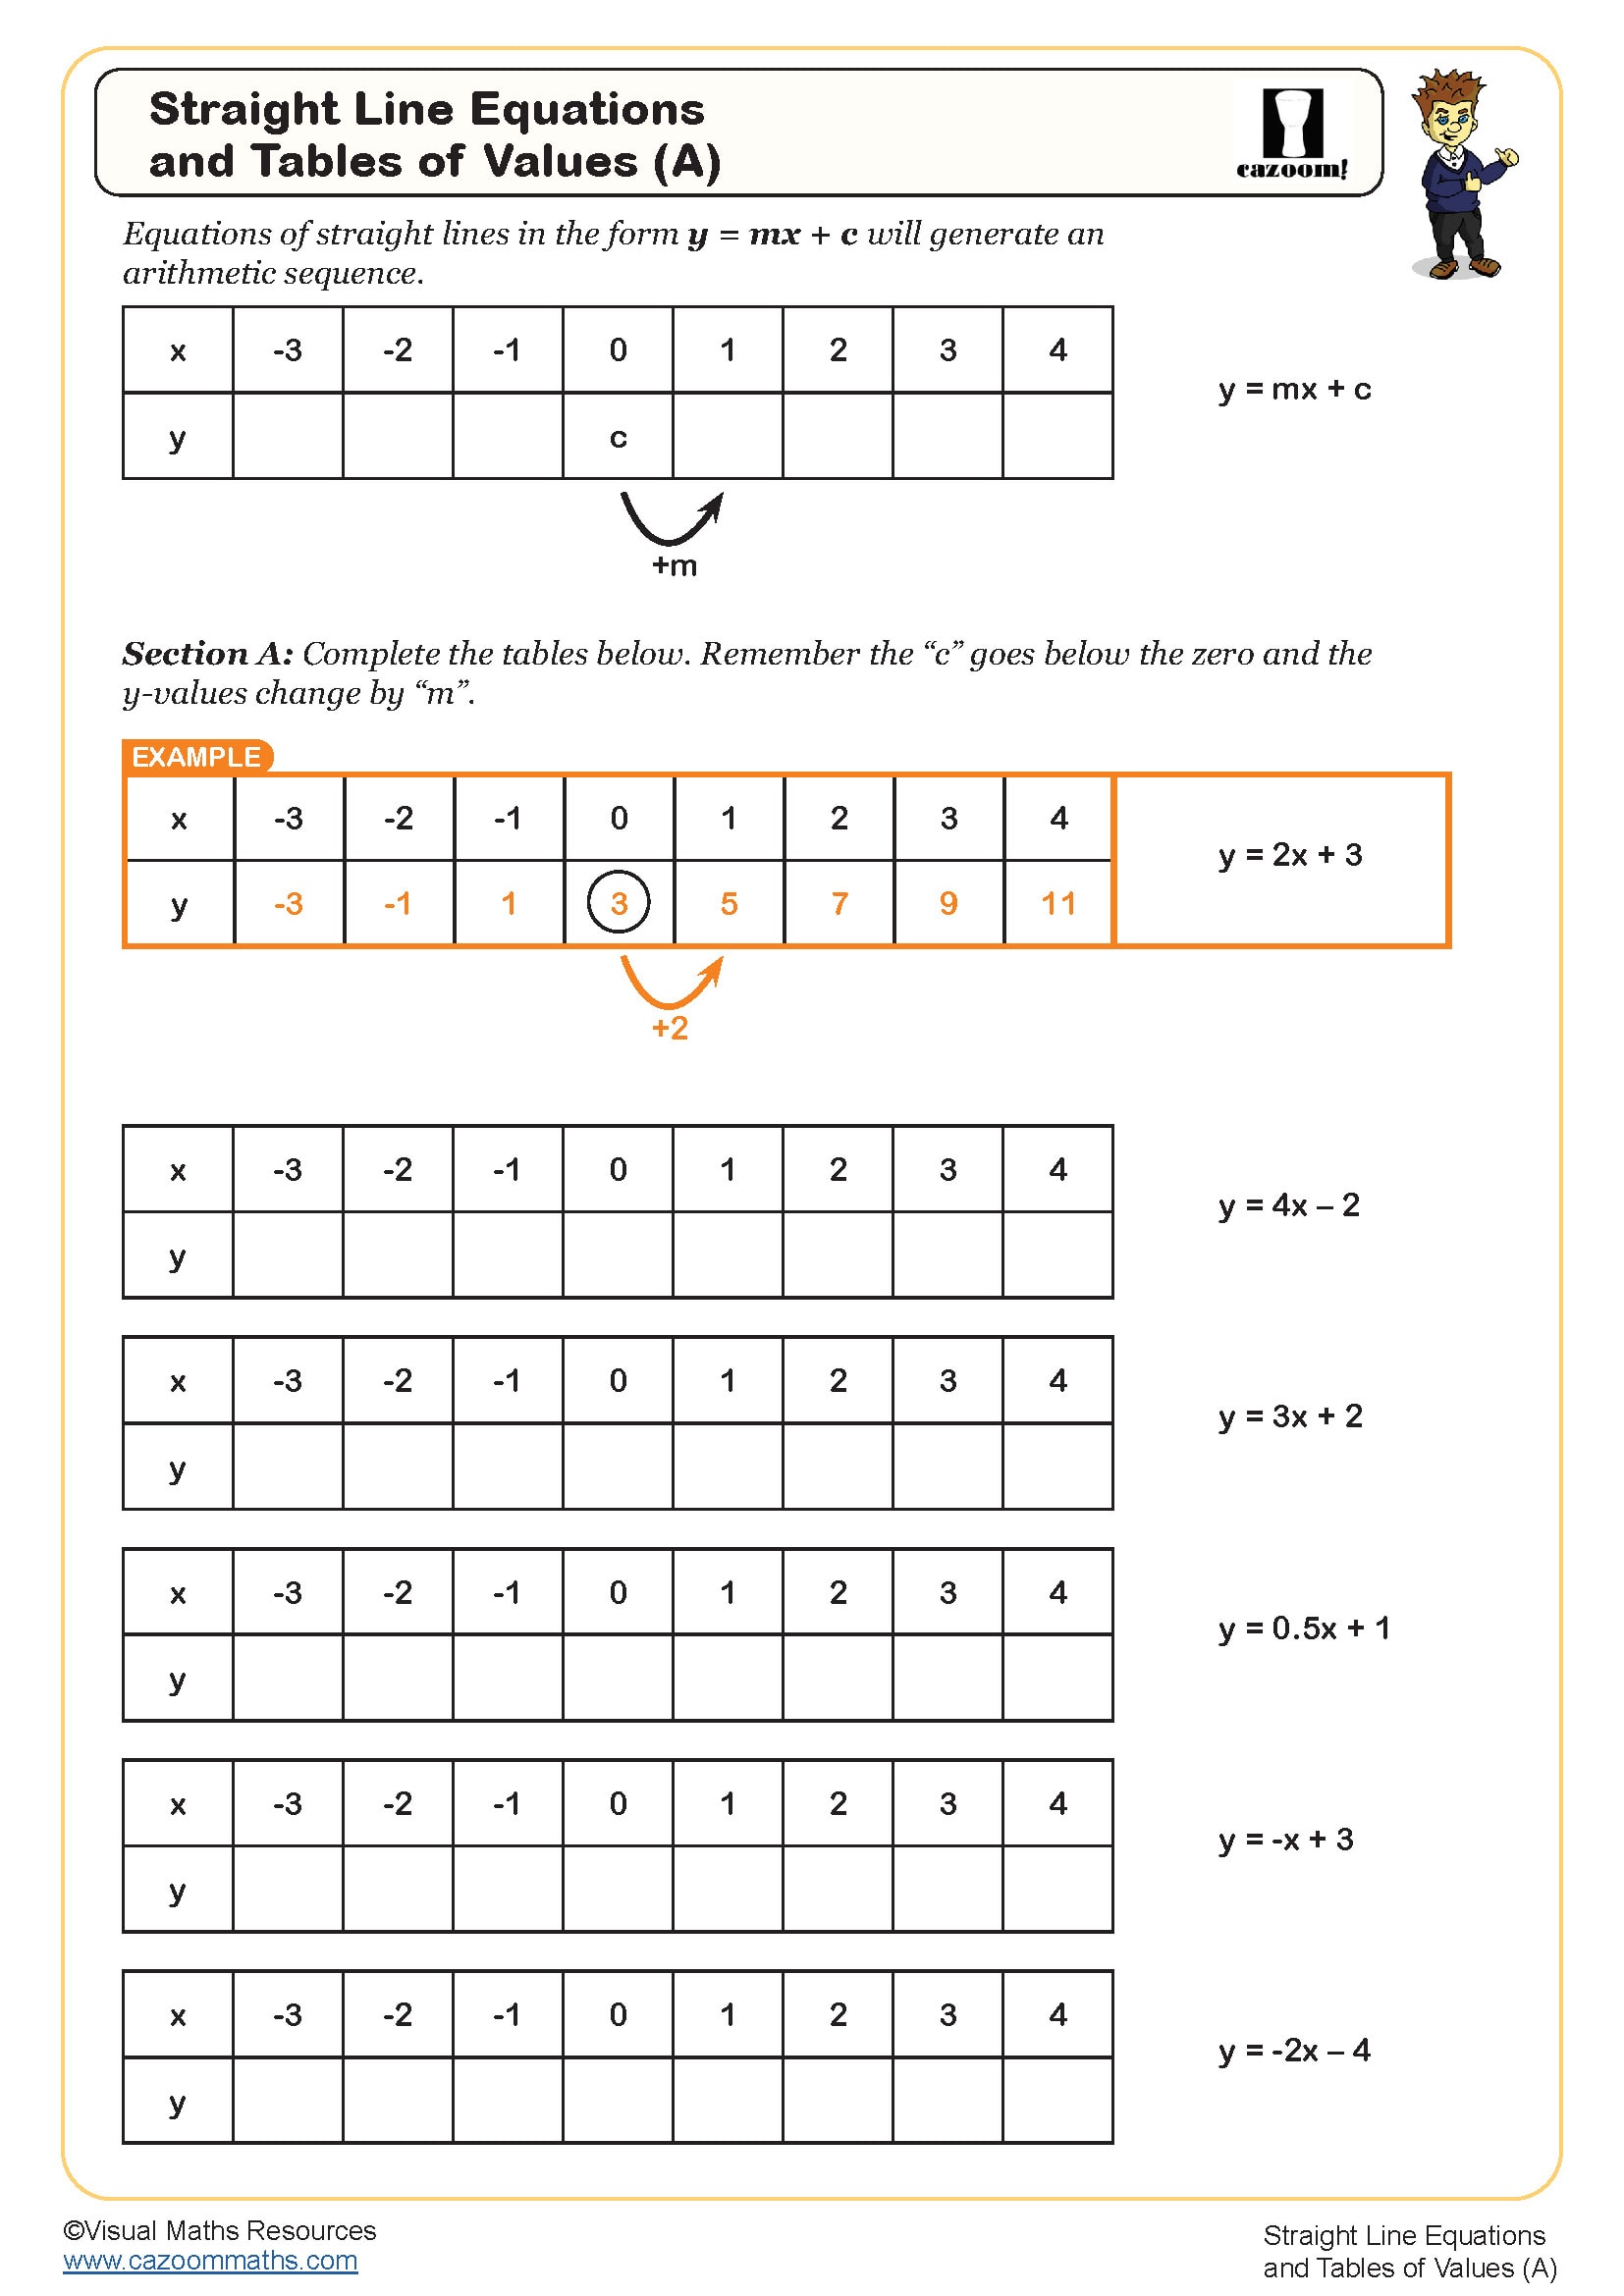
Straight Line Equations and Tables of Values (A)
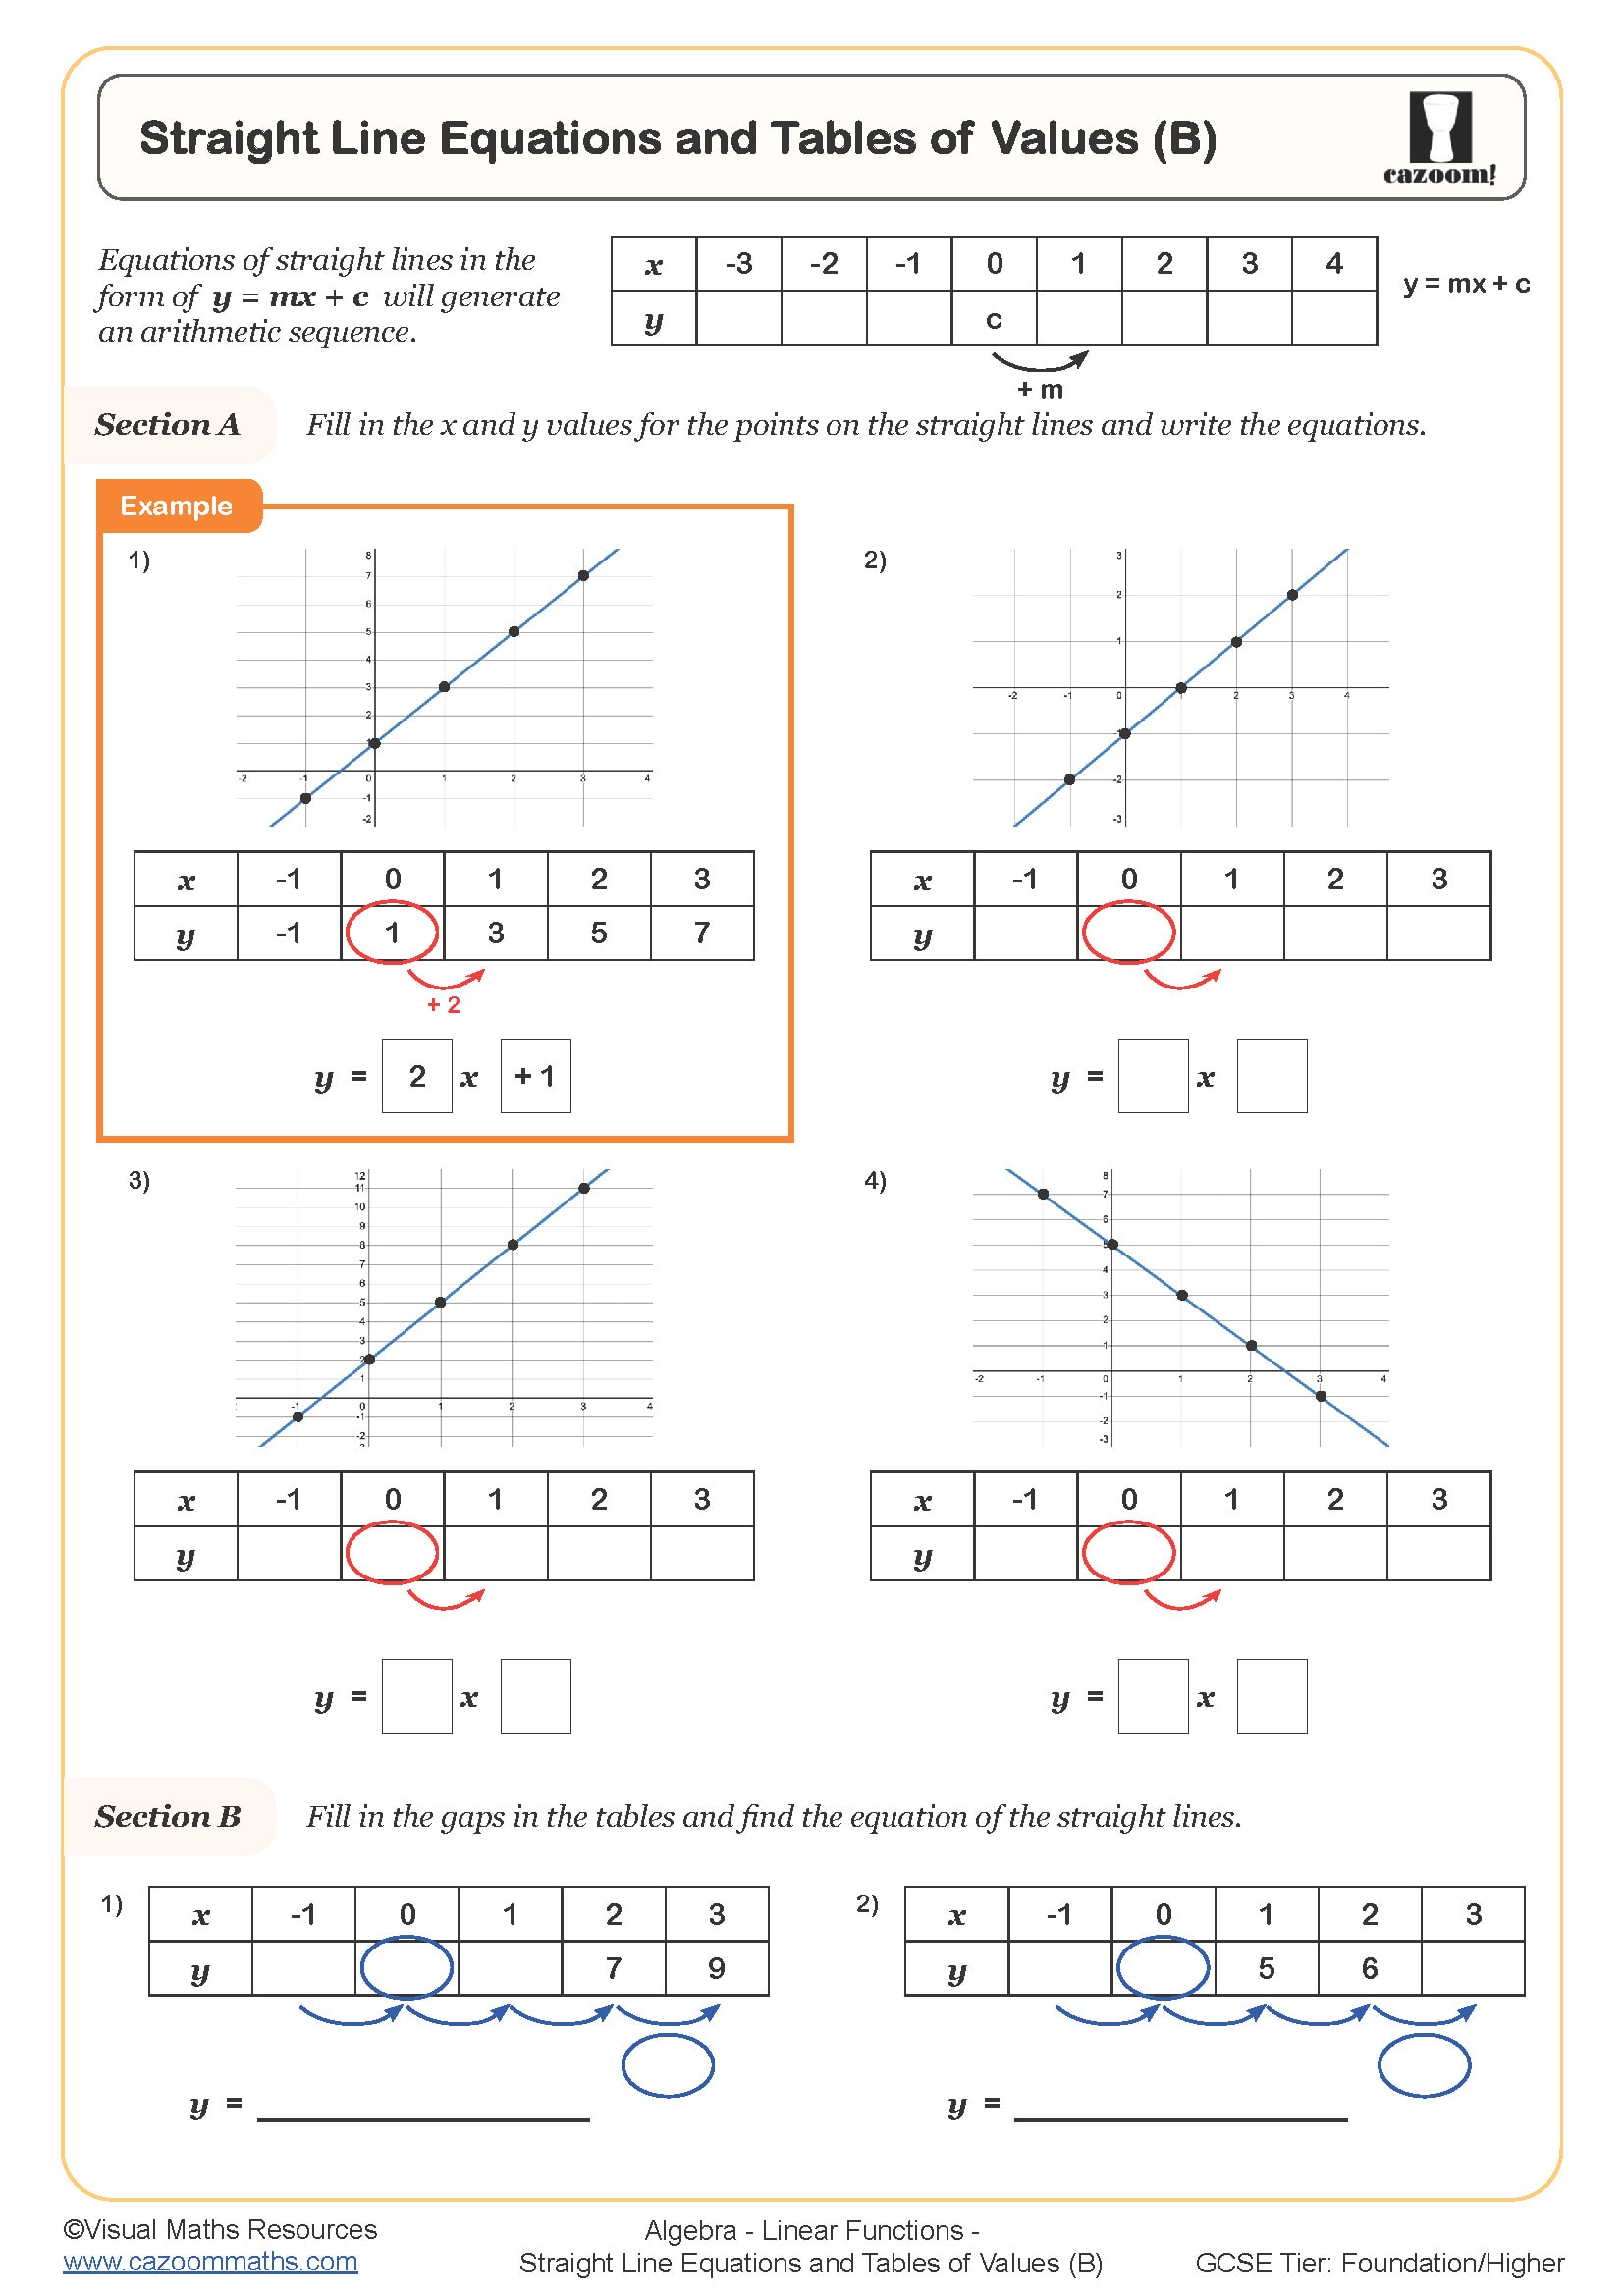
Straight Line Equations and Tables of Values (B)
All worksheets are created by the team of experienced teachers at Cazoom Maths.
What are linear functions in maths?
A linear function is a relationship between two variables that produces a straight line when plotted on a coordinate grid. In KS3, students encounter these primarily as equations in the form y = mx + c, where m represents the gradient (how steep the line is) and c represents the y-intercept (where the line crosses the vertical axis). Linear functions maintain a constant rate of change, meaning the output increases or decreases by the same amount for each unit increase in the input.
Students often struggle to recognise that equations like y = 5 - 2x are still linear functions, even though they don't immediately appear in the standard form. Rearranging to y = -2x + 5 helps them identify the gradient as negative and the y-intercept as positive 5. Exam questions regularly test whether learners can distinguish between linear functions (which graph as straight lines) and non-linear functions such as y = x² or y = 1/x, which produce curves.
Which year groups study linear functions?
Linear functions appear throughout KS3, with worksheets available for Year 7, Year 8, and Year 9. The National Curriculum introduces function notation and simple linear relationships in Year 7, often starting with patterns and sequences before formalising the y = mx + c structure. Year 8 builds fluency with plotting and interpreting straight-line graphs, whilst Year 9 extends to finding equations from graphs and solving problems involving parallel and perpendicular lines.
The progression across these year groups moves from recognising and plotting to analysing and applying. Year 7 students might plot y = 2x + 3 from a table of values, Year 8 learners identify the gradient and intercept from a drawn graph, and Year 9 students calculate the equation of a line passing through two given points. This scaffolded approach ensures students develop both procedural fluency and conceptual understanding before tackling more demanding GCSE content on simultaneous equations and quadratic graphs.
How do card sorts help with understanding linear functions?
Card sort activities require students to match equations, graphs, tables of values, and written descriptions of linear functions. This multi-representational approach strengthens connections between algebraic and graphical forms, helping learners see that y = 3x - 2 and a line with gradient 3 crossing the y-axis at -2 describe the same relationship. Teachers often use these as collaborative tasks where students must justify their matching decisions, revealing misconceptions about negative gradients or misreadings of scale on axes.
Linear functions model countless real-world situations where one quantity changes at a constant rate relative to another. Mobile phone contracts (monthly cost = fixed line rental + cost per minute of calls), taxi fares (total cost = base fare + cost per mile), and temperature conversion between Celsius and Fahrenheit all follow linear patterns. Engineers use linear functions to calculate material costs, whilst scientists plot linear calibration curves to interpret experimental data, making this topic fundamental across STEM disciplines.
How should teachers use these linear functions worksheets?
The worksheets provide structured practice that builds from identifying linear patterns through to working with function notation and graphical representations. Many include worked examples showing step-by-step methods for plotting graphs from equations or writing equations from coordinate pairs. The answer sheets allow students to self-check their understanding, particularly valuable when practising gradient calculations or reading intercepts from graphs, where small errors in counting grid squares often lead to incorrect answers.
These resources work effectively for differentiated homework, allowing teachers to assign appropriate challenges to different groups within a mixed-ability class. The card sort activities suit paired or small group work during lessons, encouraging mathematical discussion about why certain functions produce steeper or shallower lines. Several teachers use these worksheets for targeted intervention with students who struggle to connect algebraic and graphical representations, whilst others deploy them as revision material before end-of-topic assessments or as starter activities to revisit prior learning.