KS4 Non-Linear Functions Worksheets
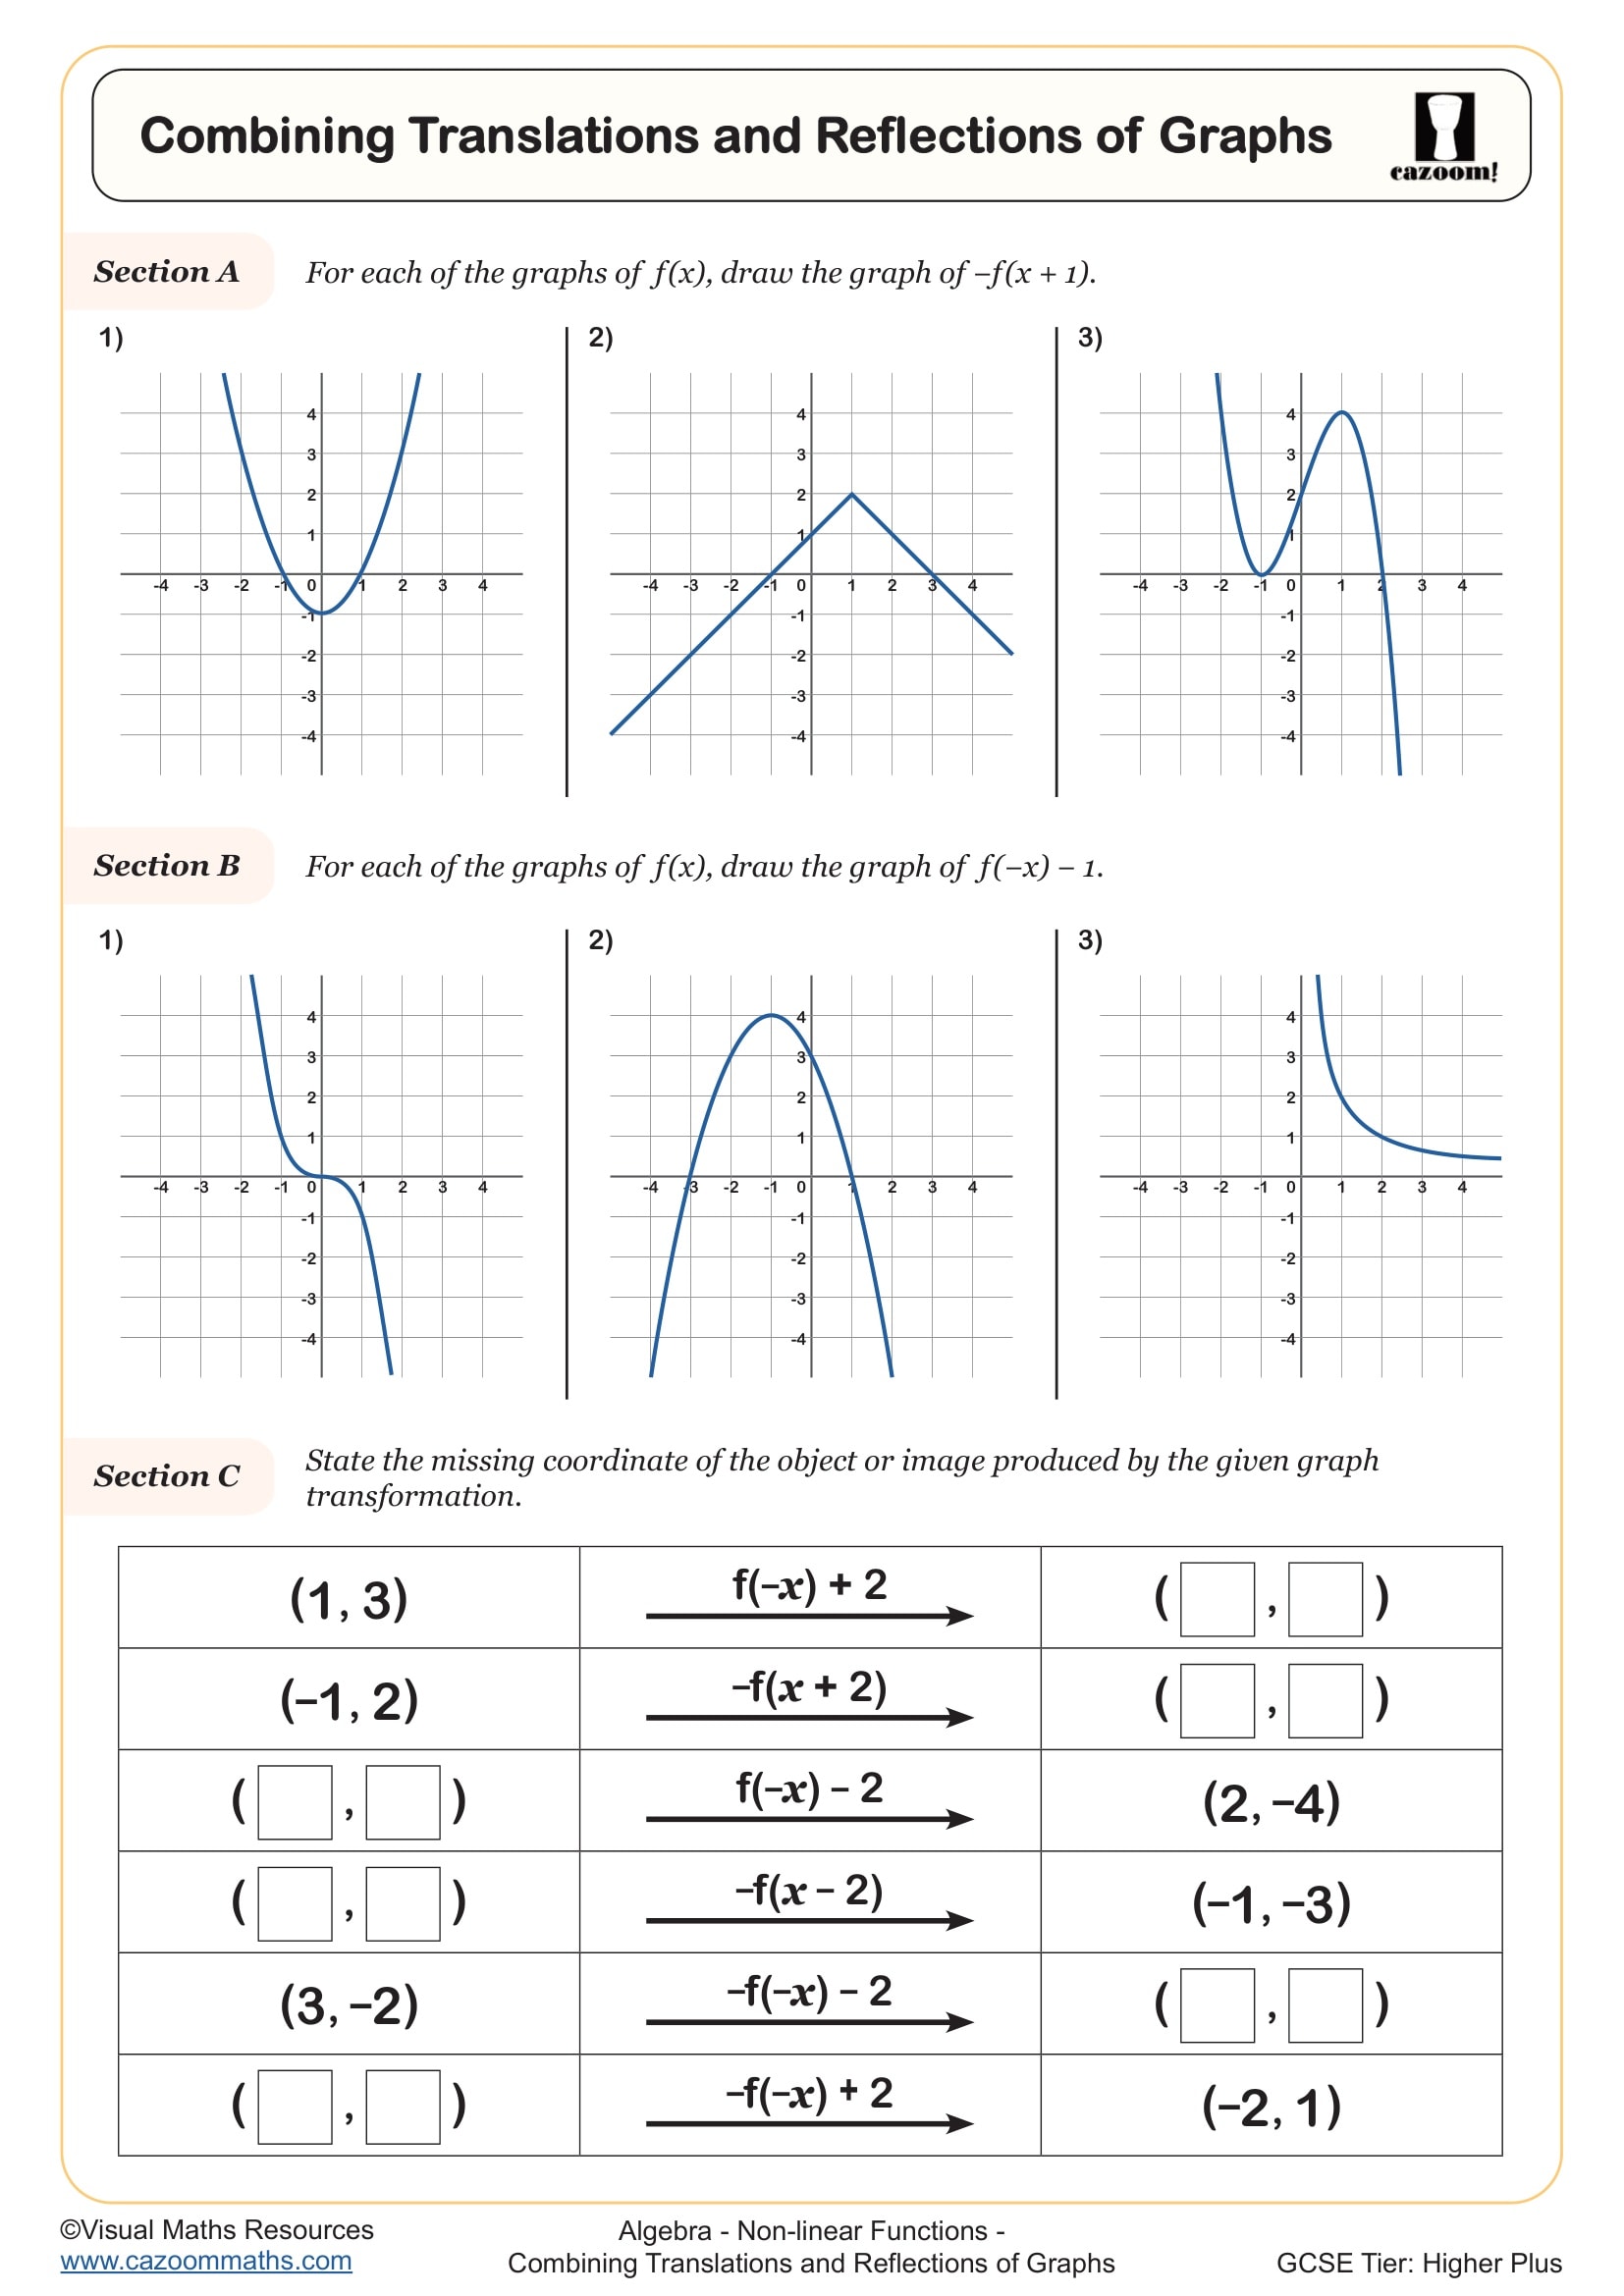
Combining Translations and Reflections of Graphs
Completing the Square - Using Algebra Tiles
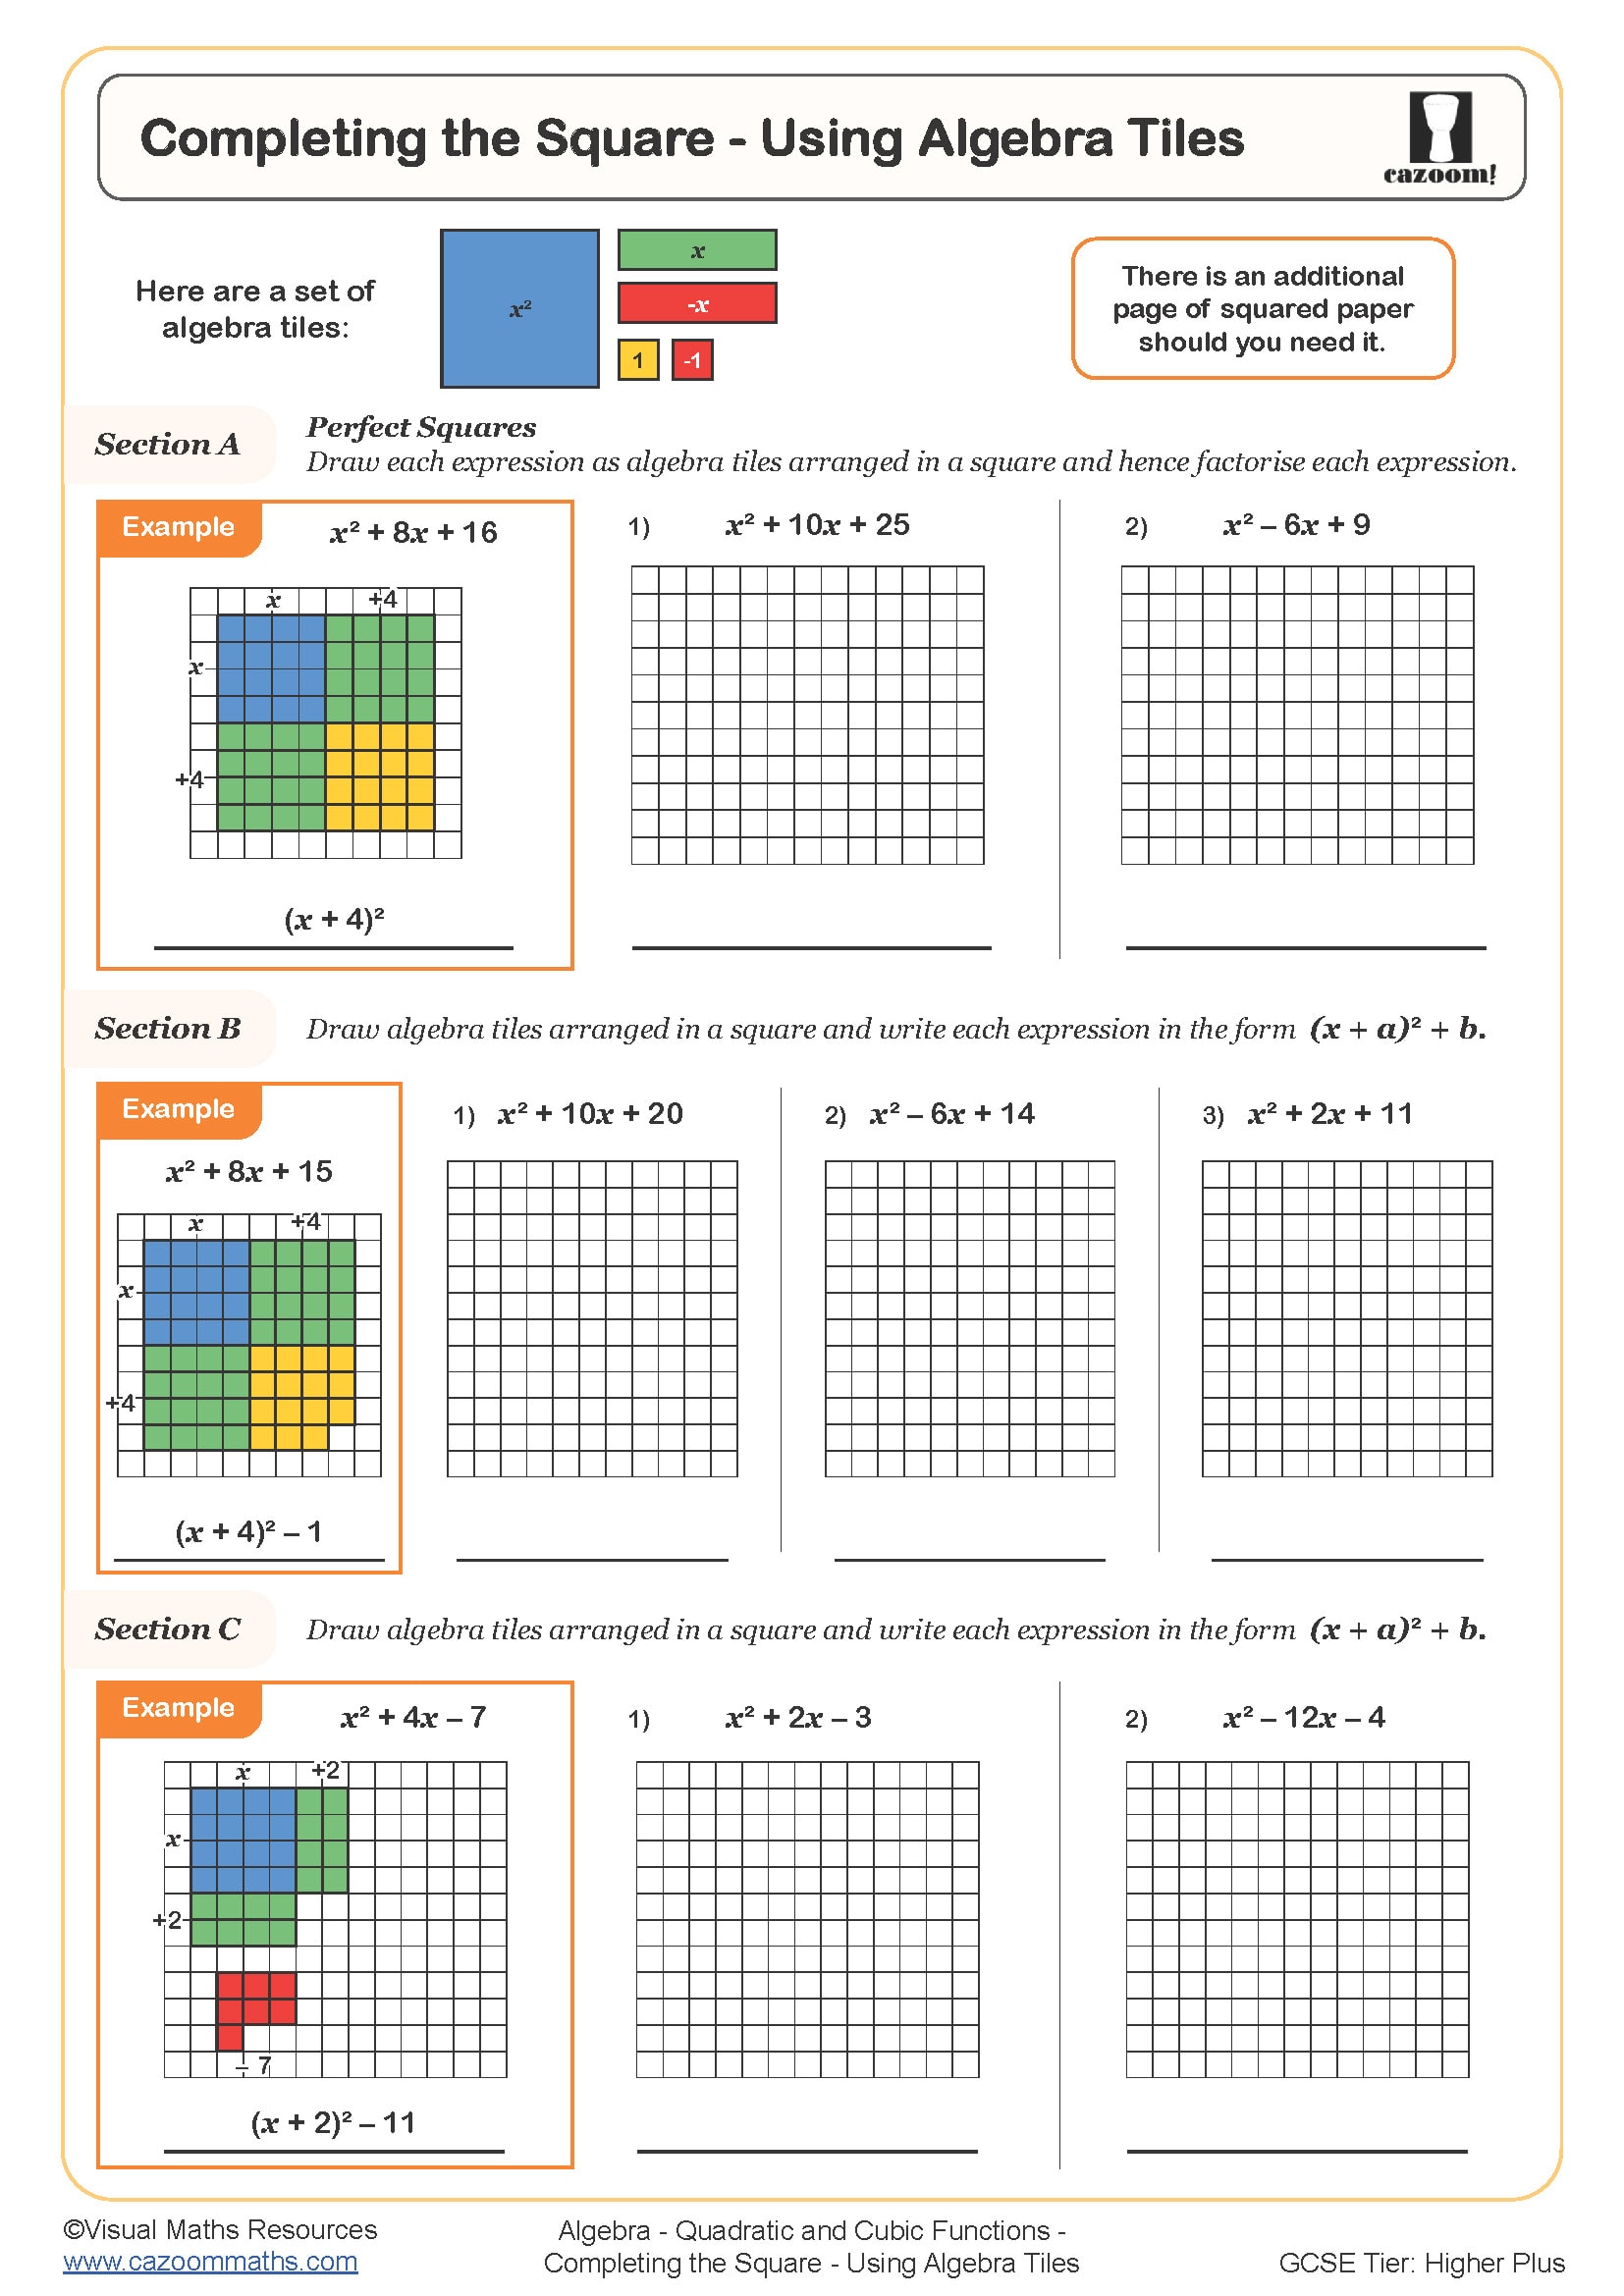
Completing the Square (A)
-Worksheet.jpg?w=3840)
Completing the Square (B)
-Worksheet.jpg?w=3840)
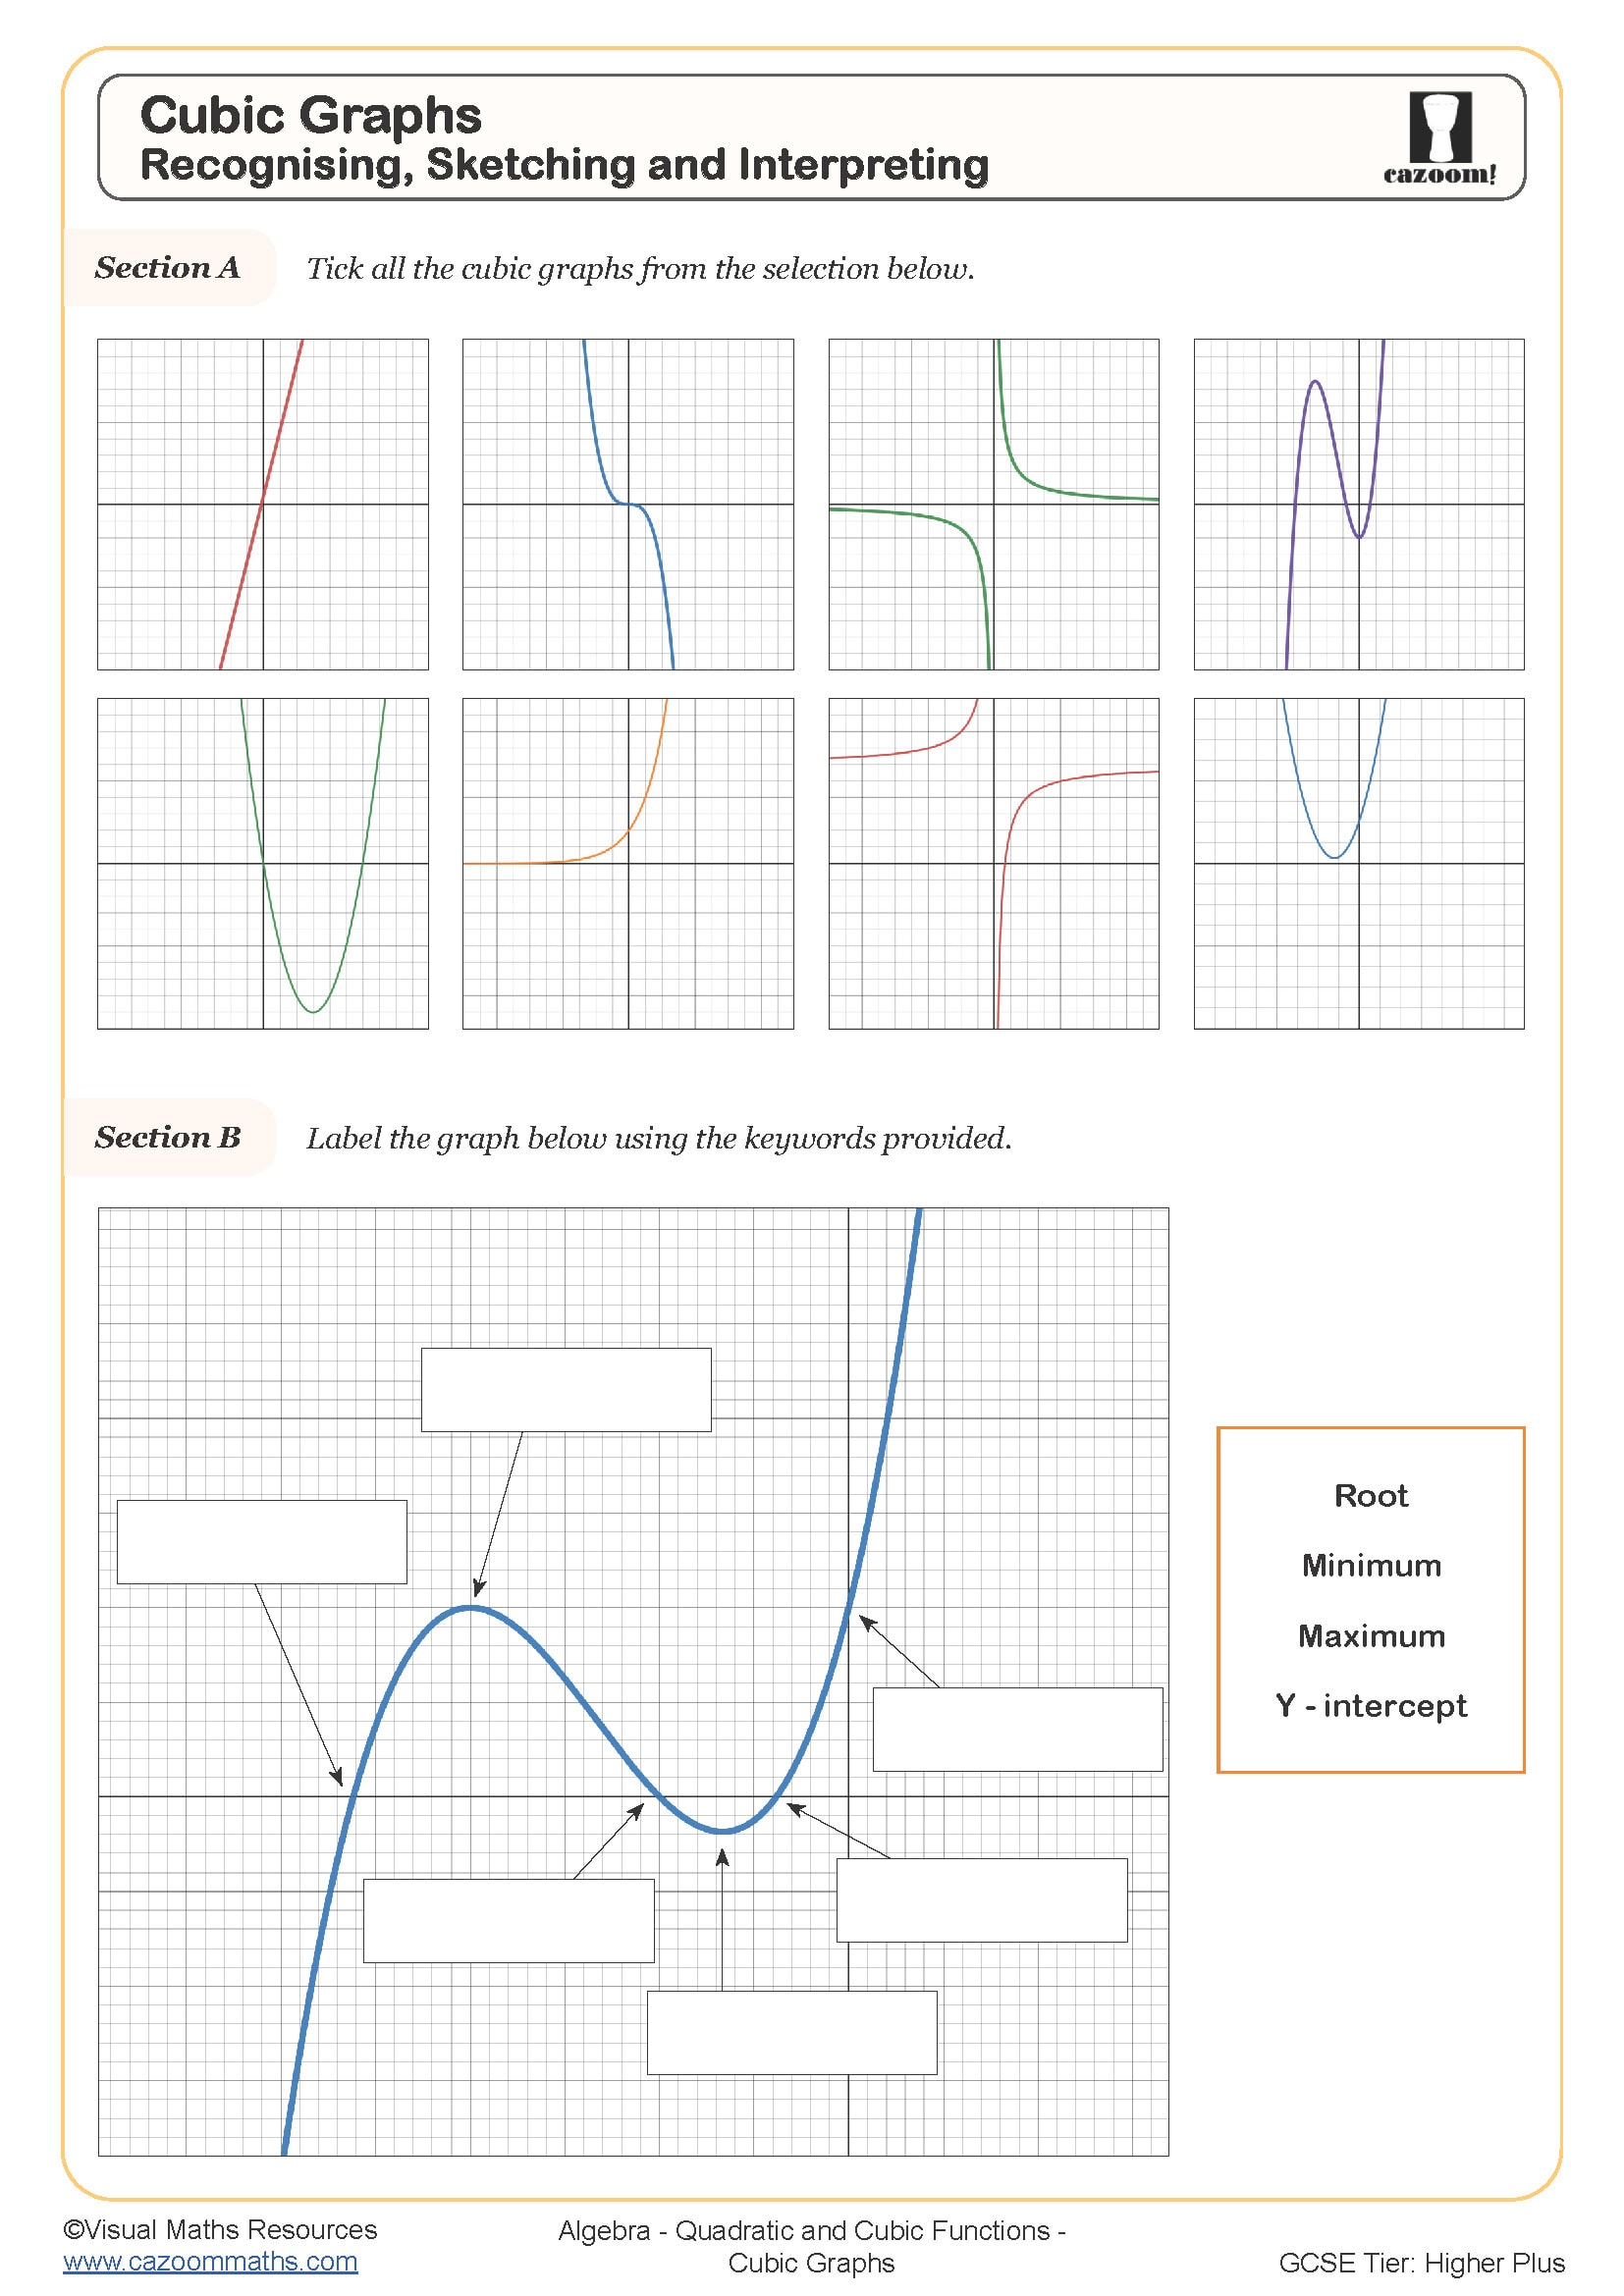
Cubic Graphs - Recognising, Sketching and Interpreting
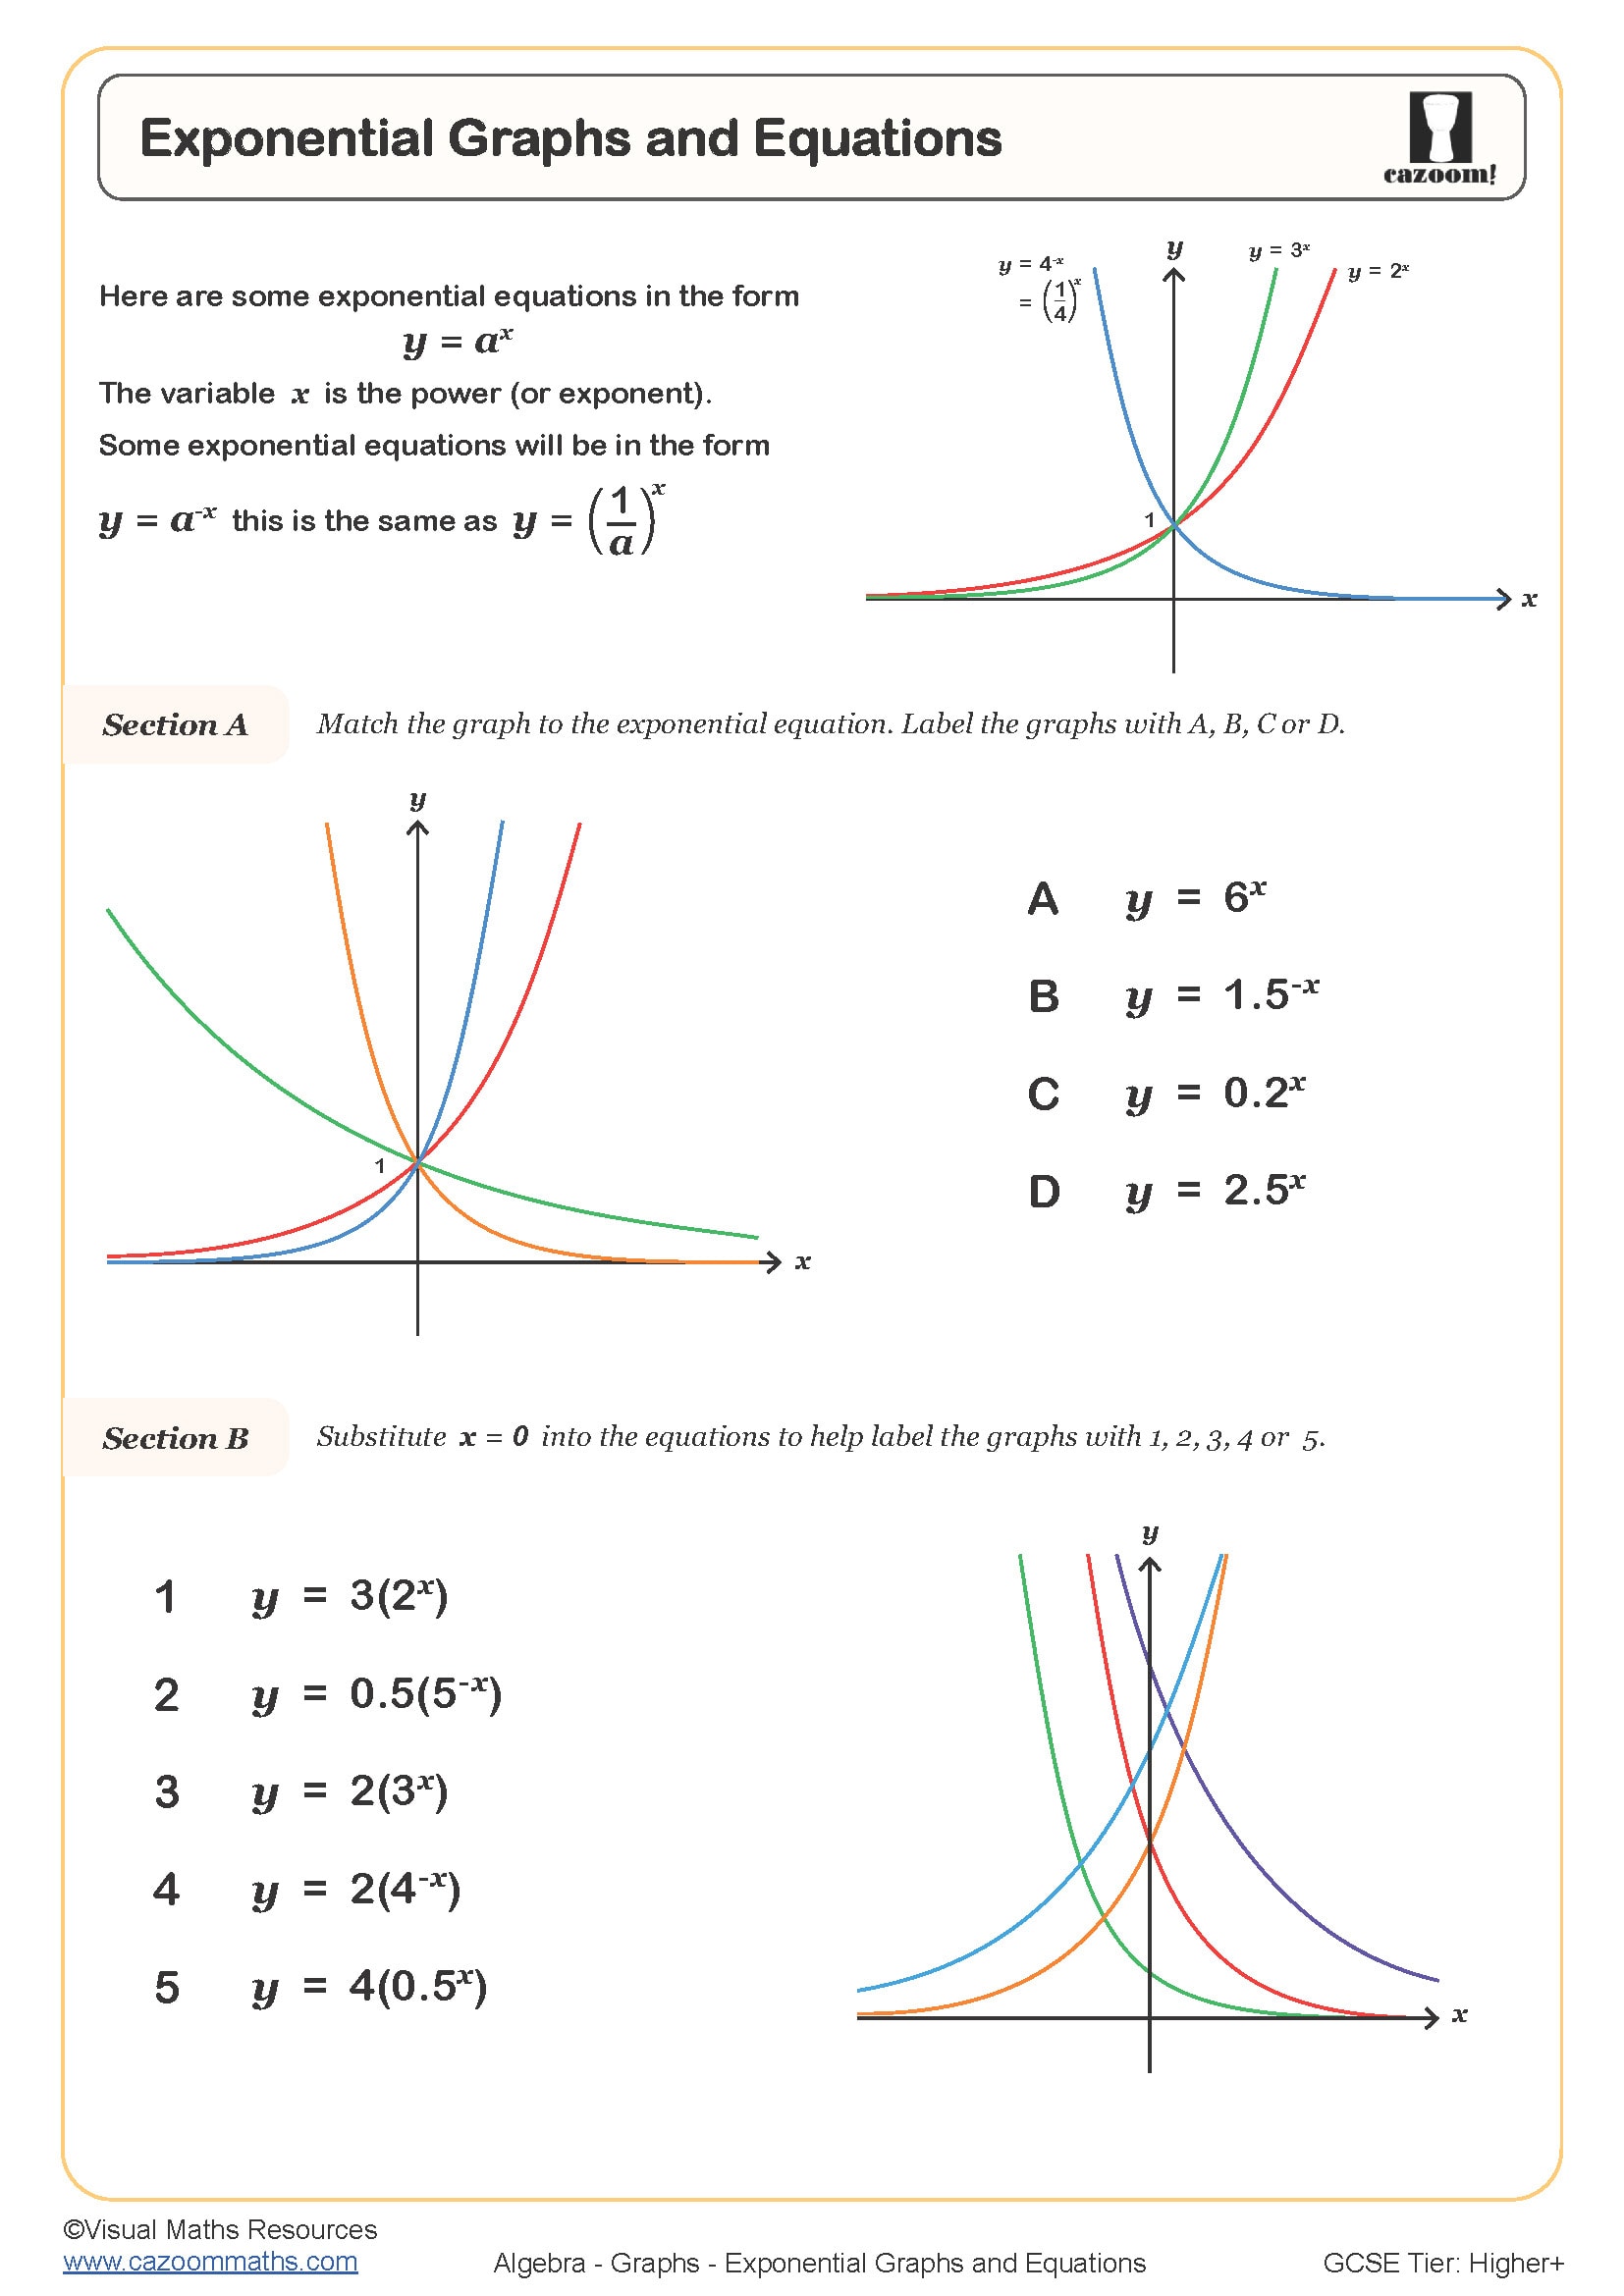
Exponential Graphs and Equations
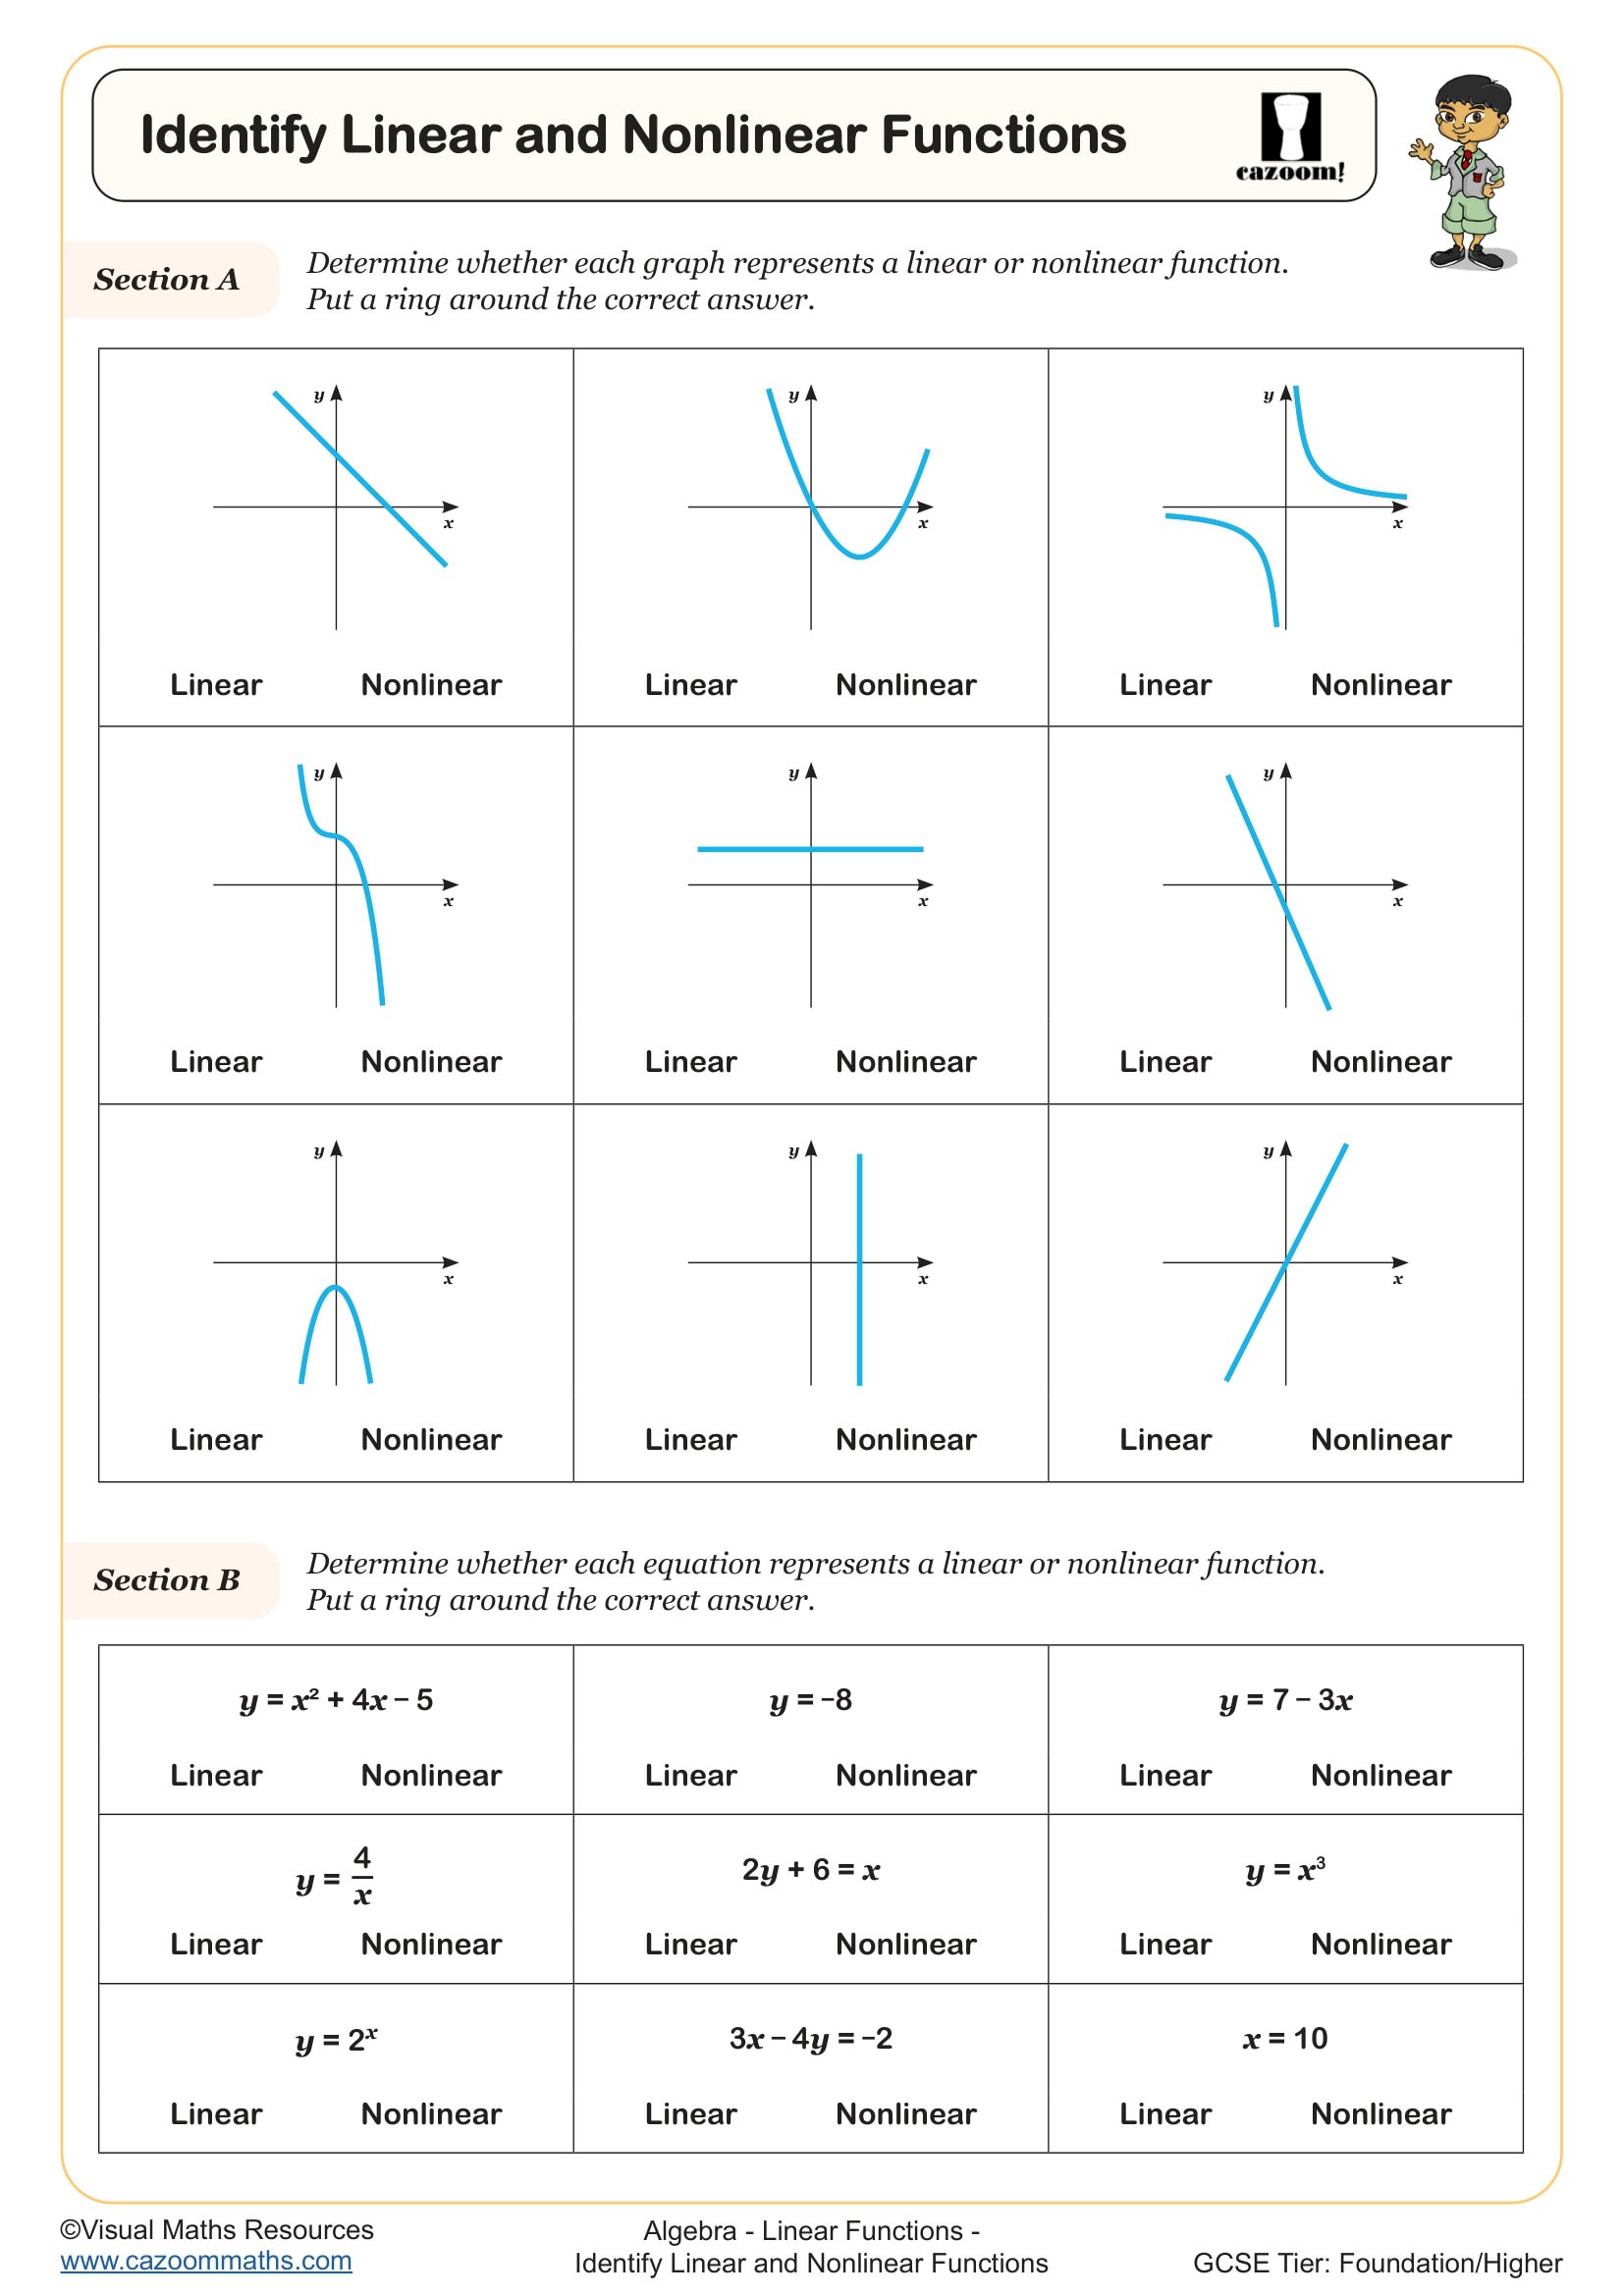
Identify Linear and Non Linear Functions
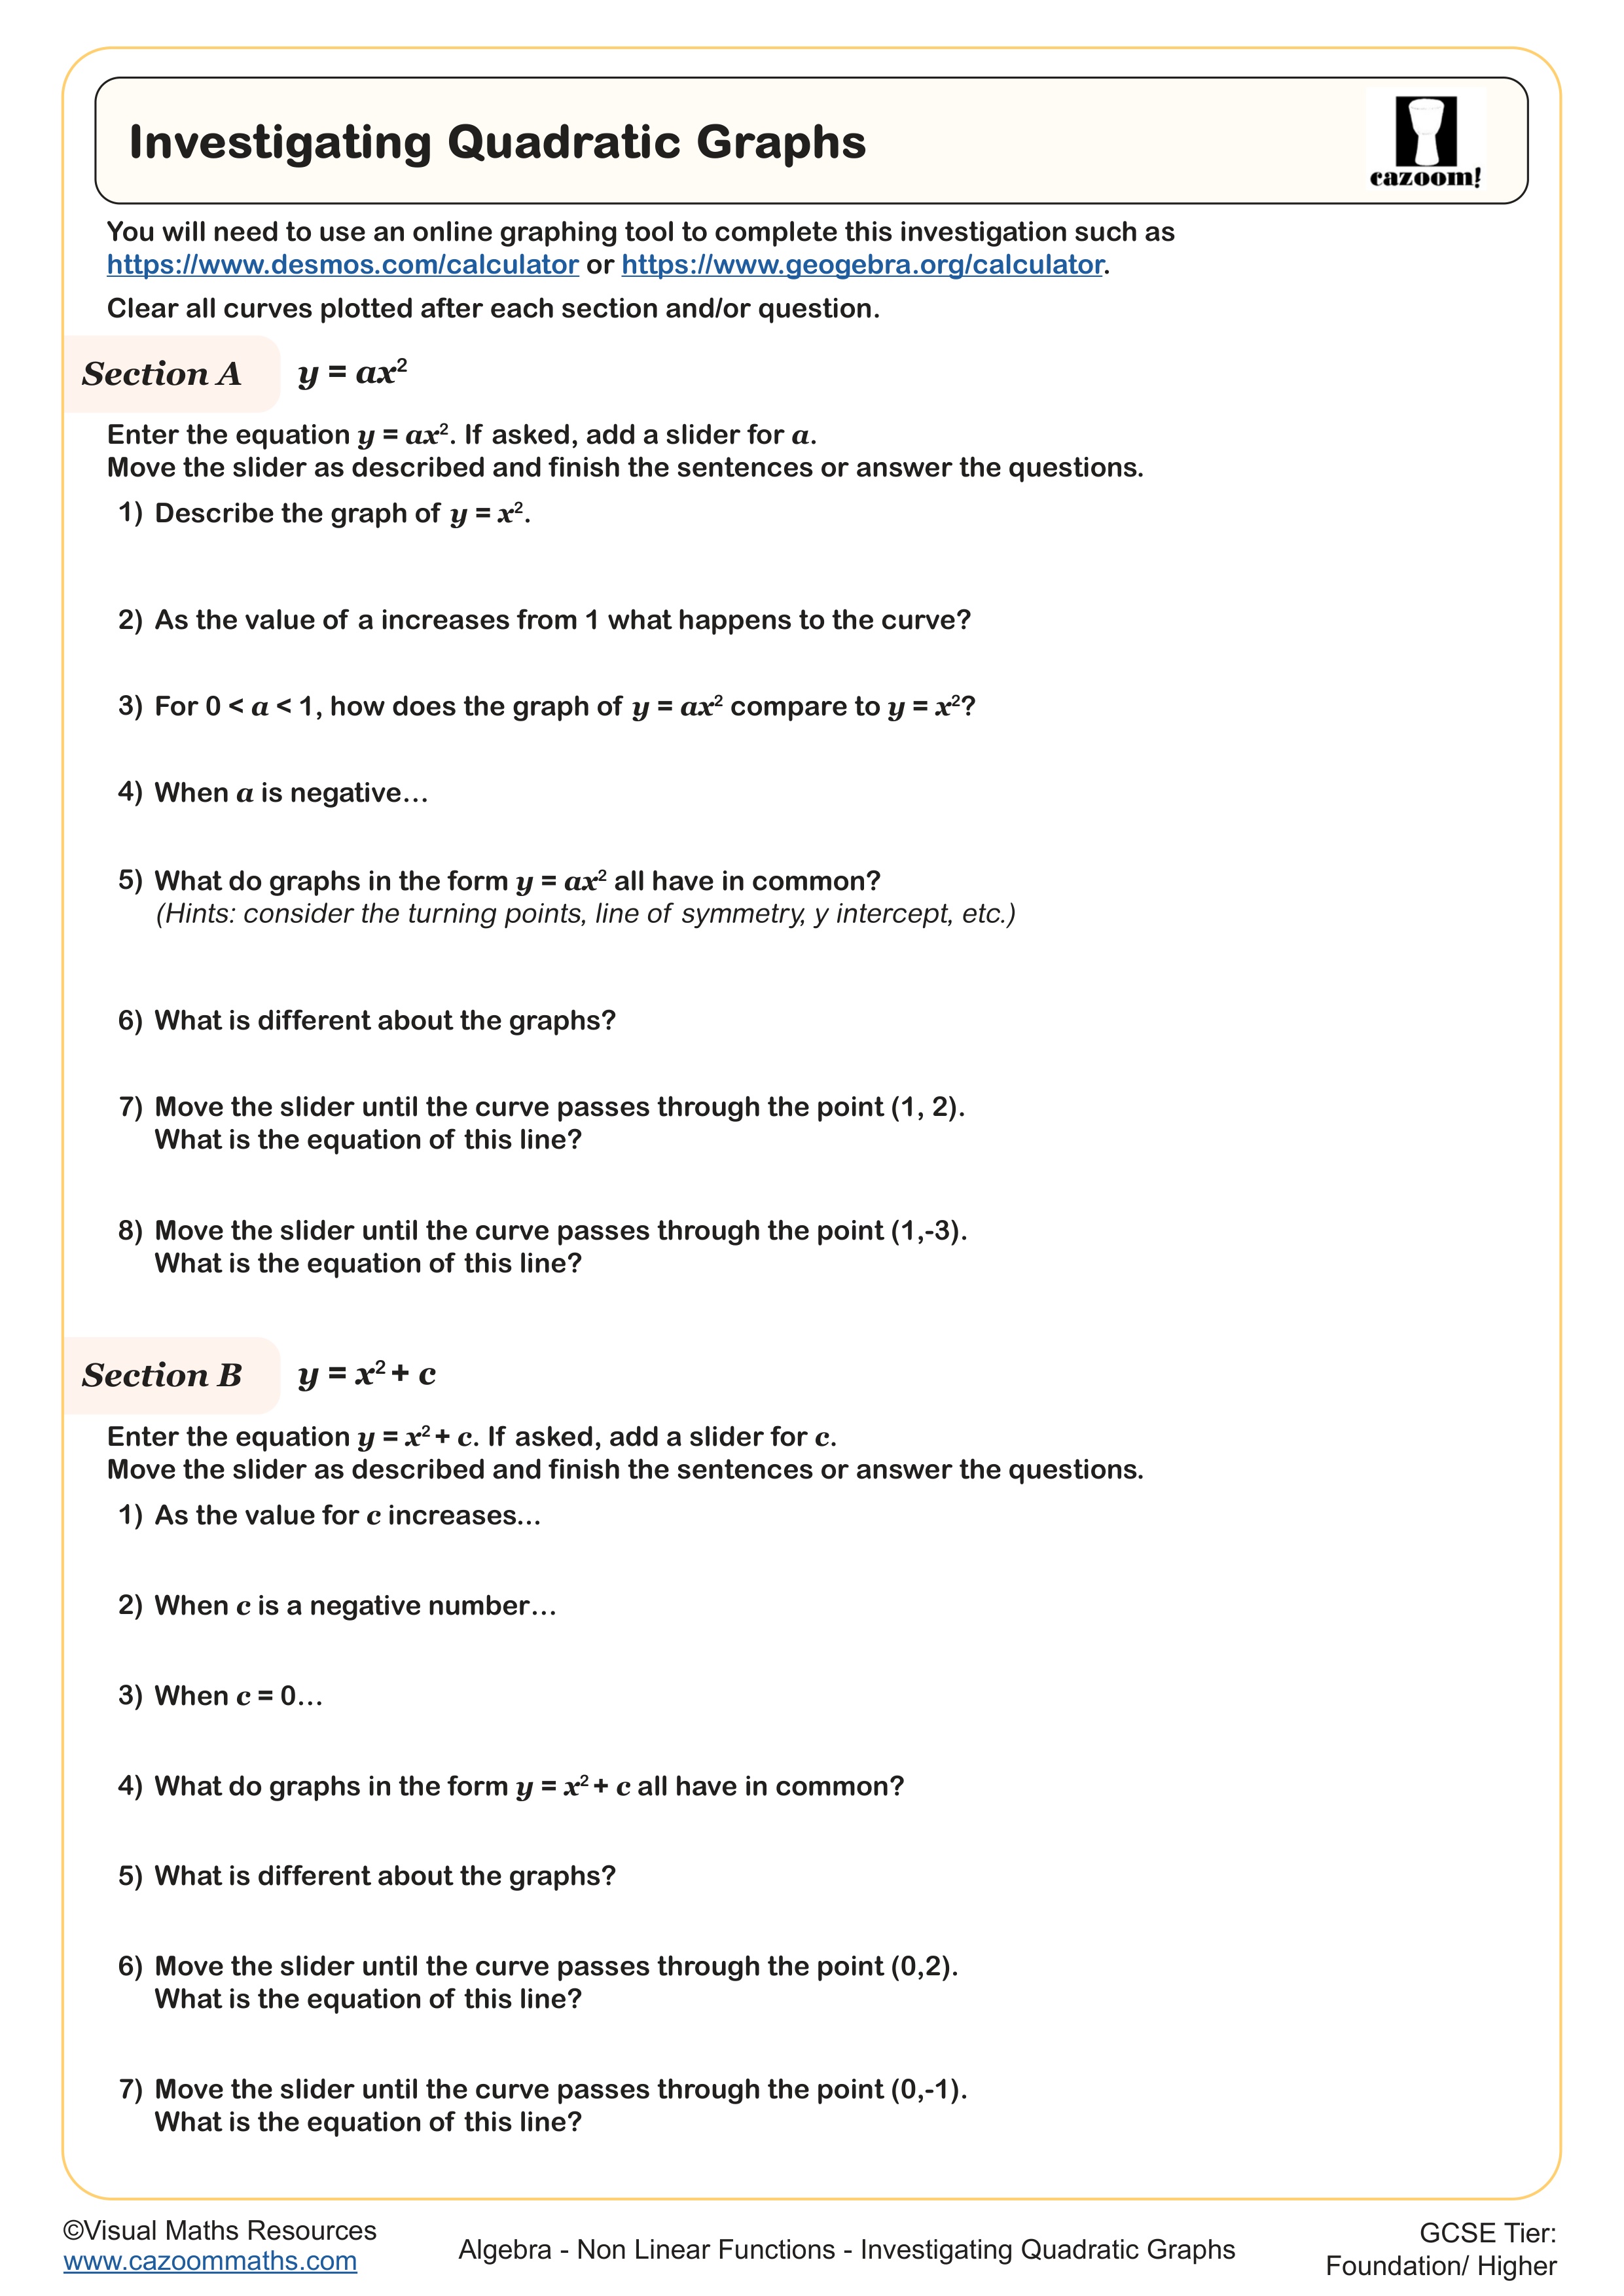
Investigating Quadratic Graphs
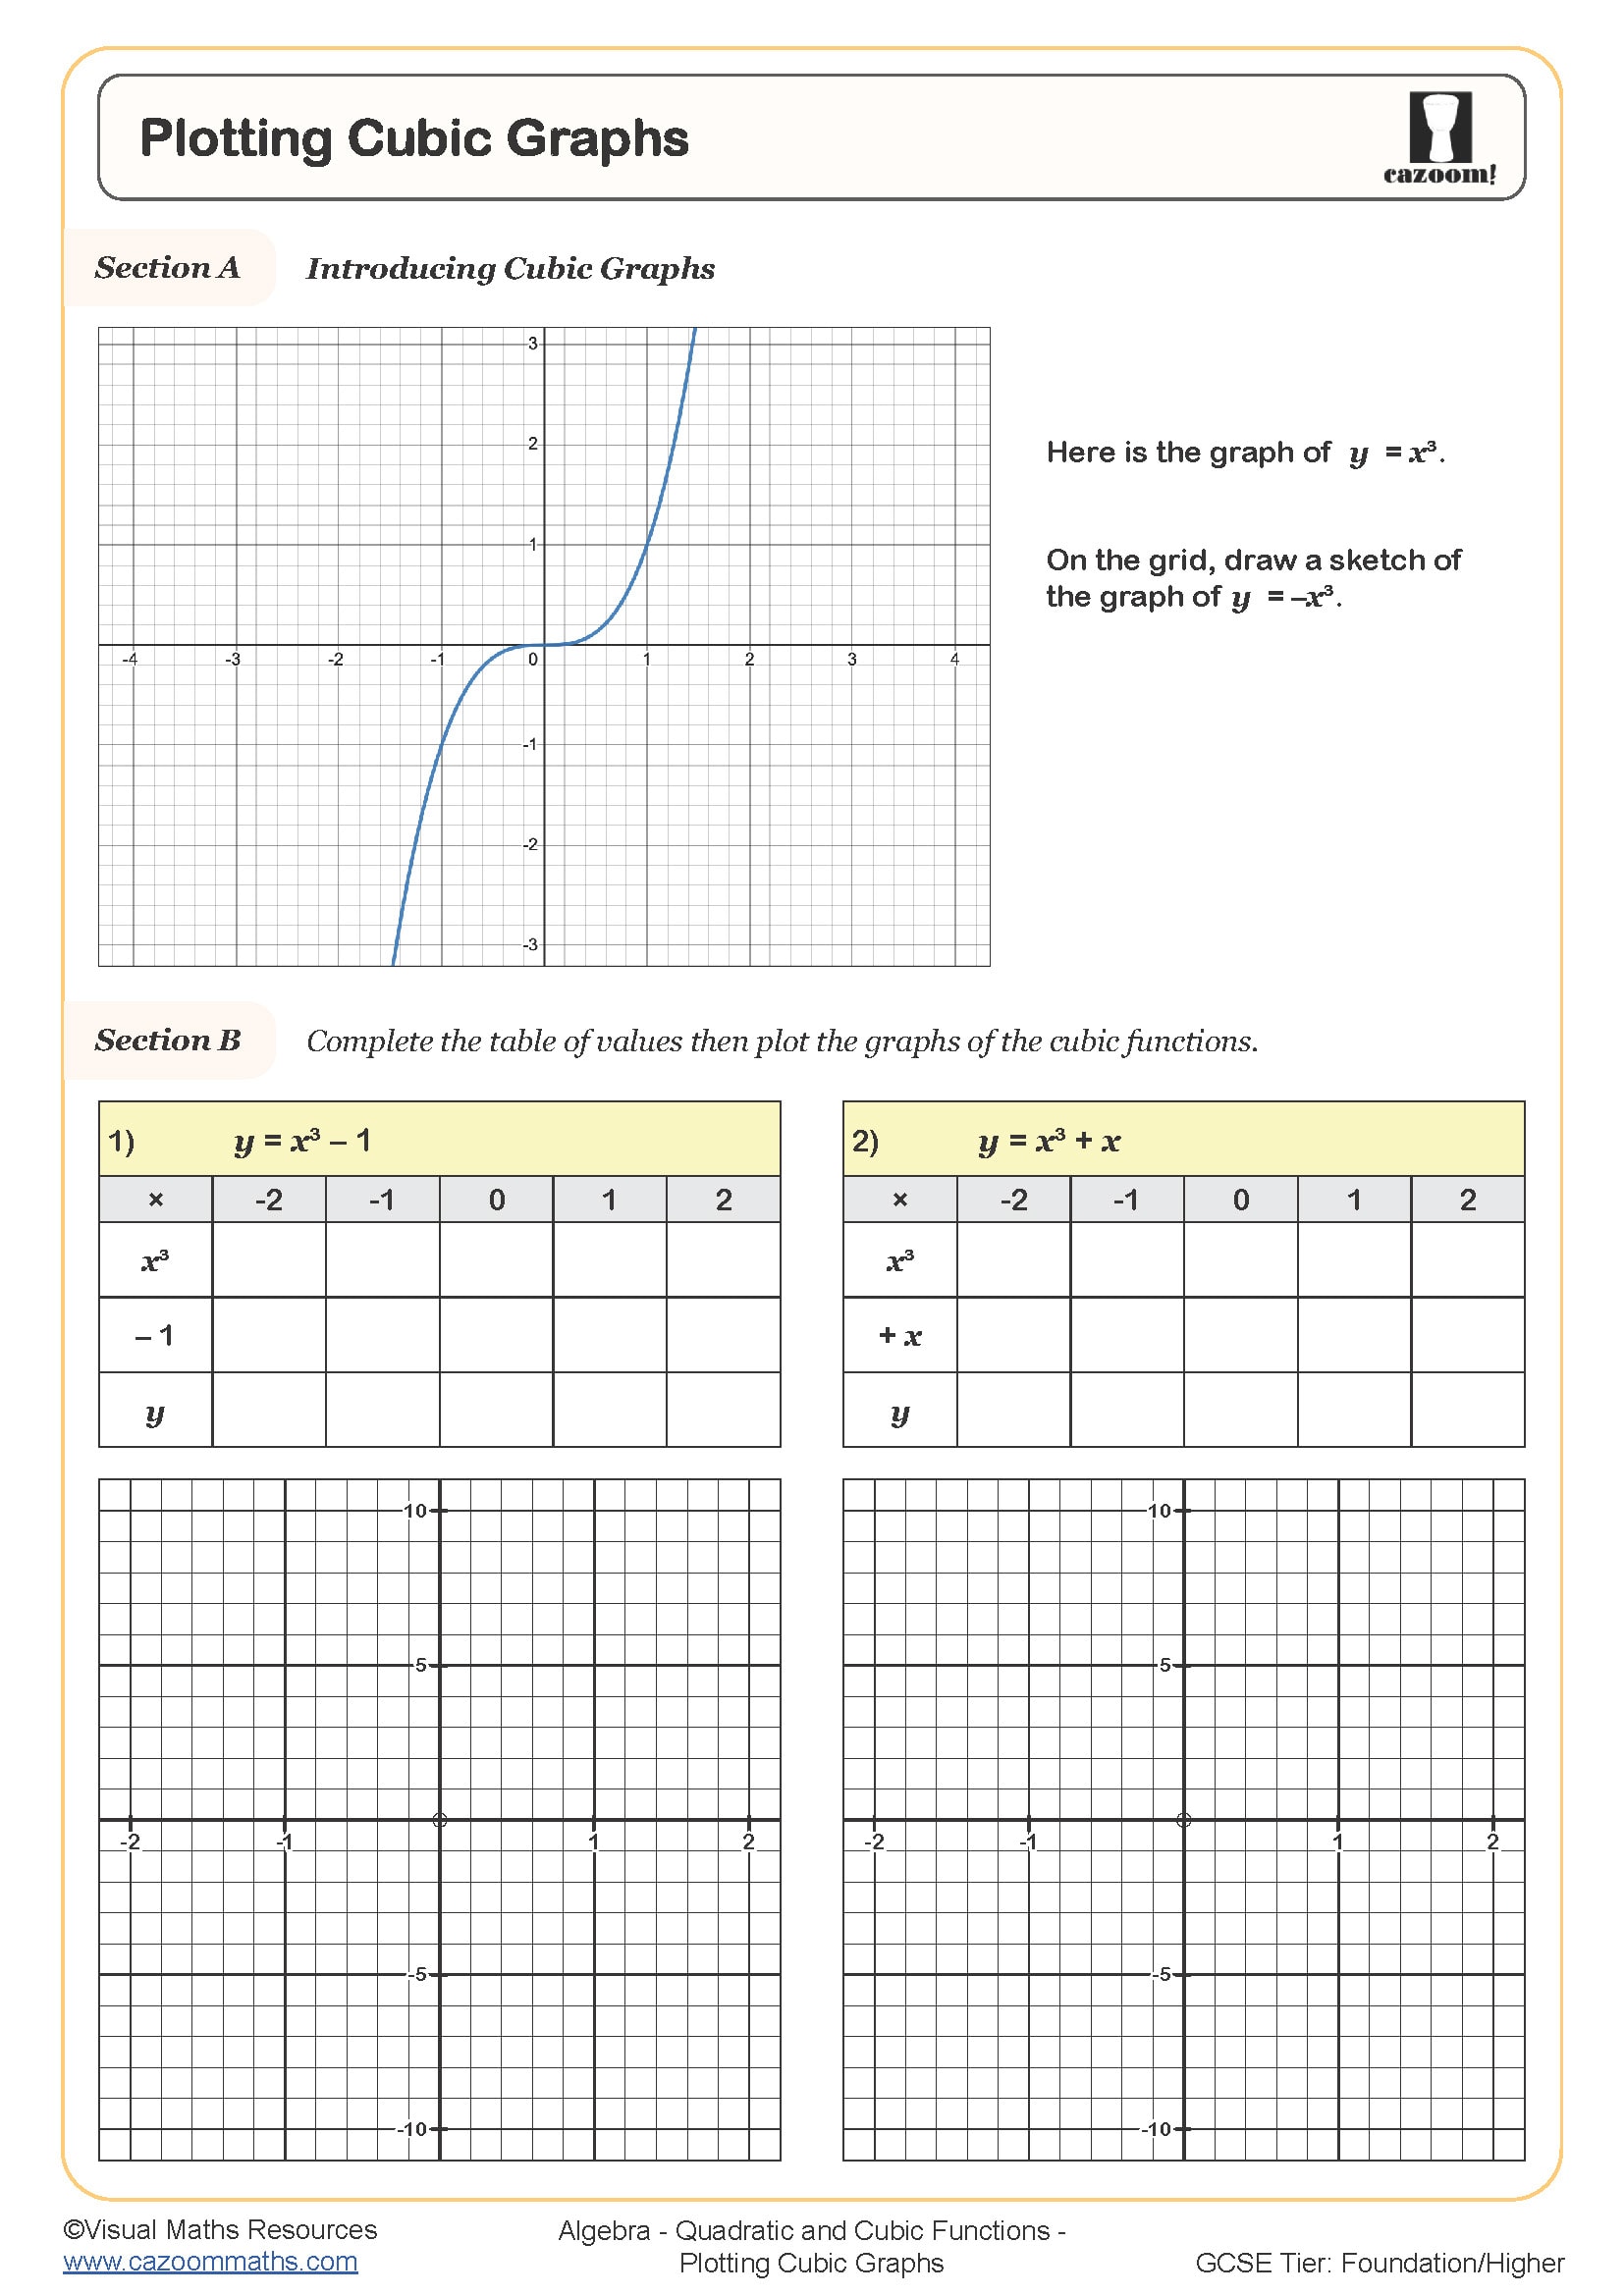
Plotting Cubic Graphs
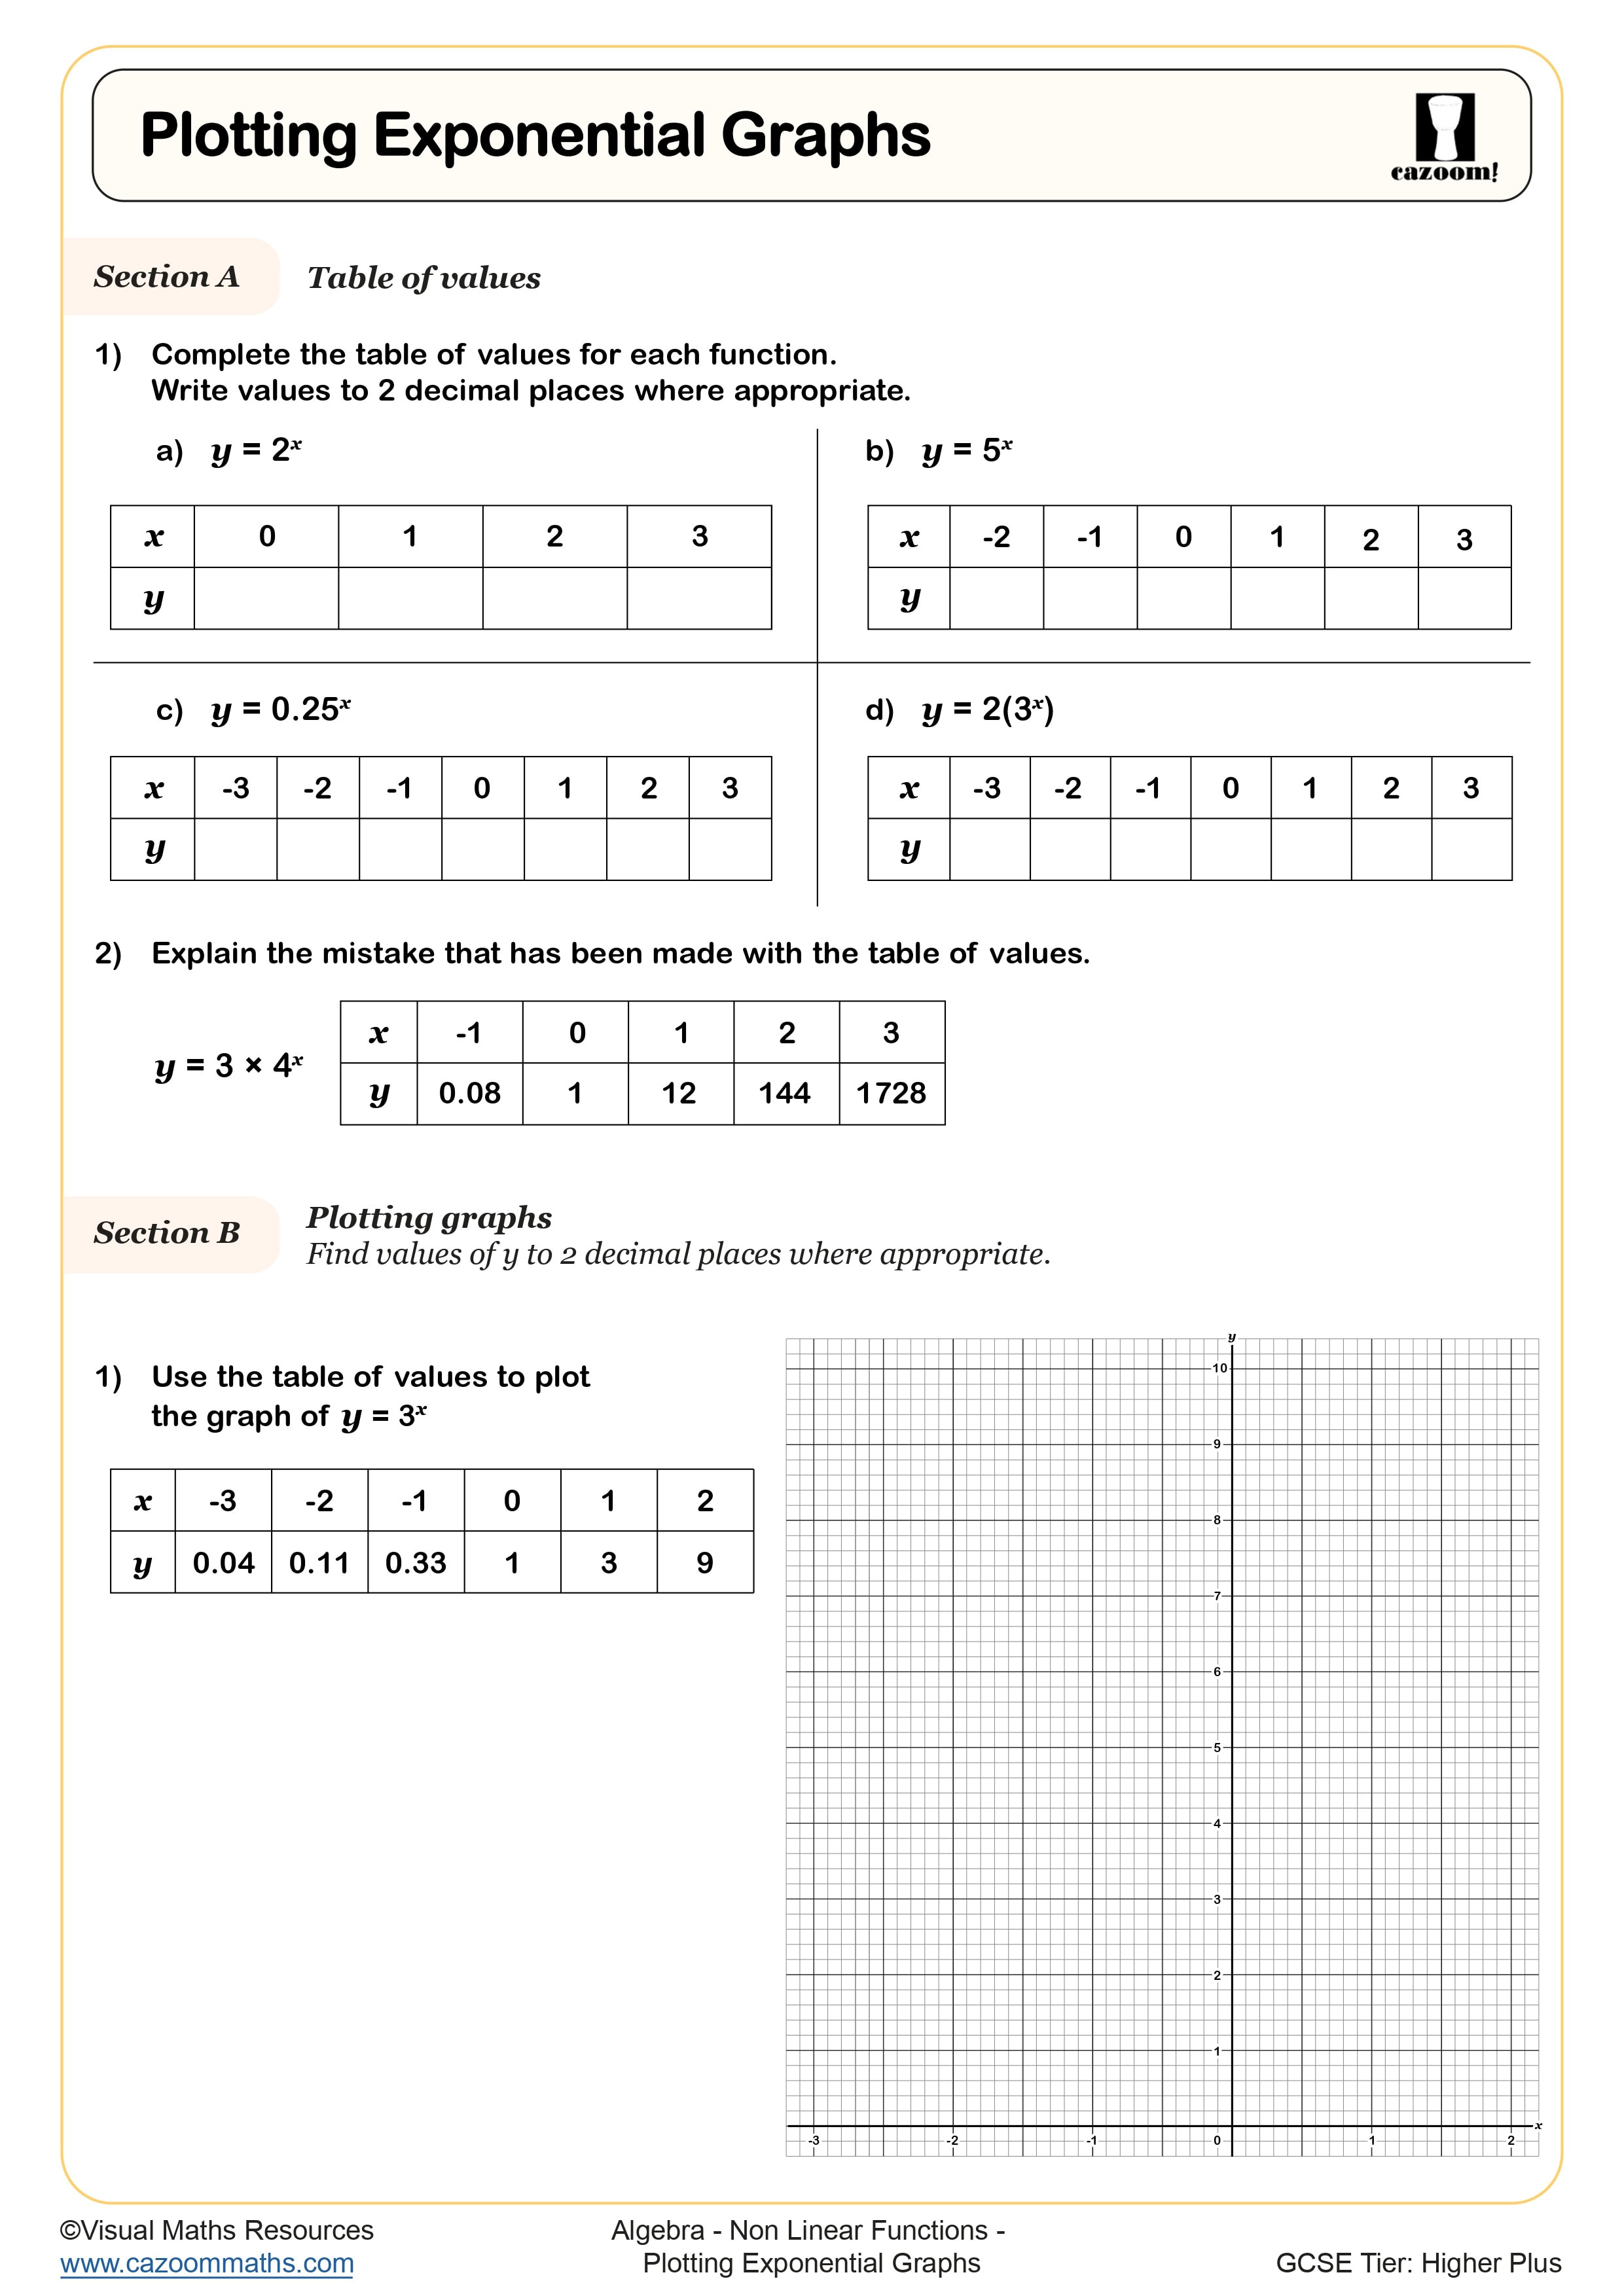
Plotting Exponential Graphs
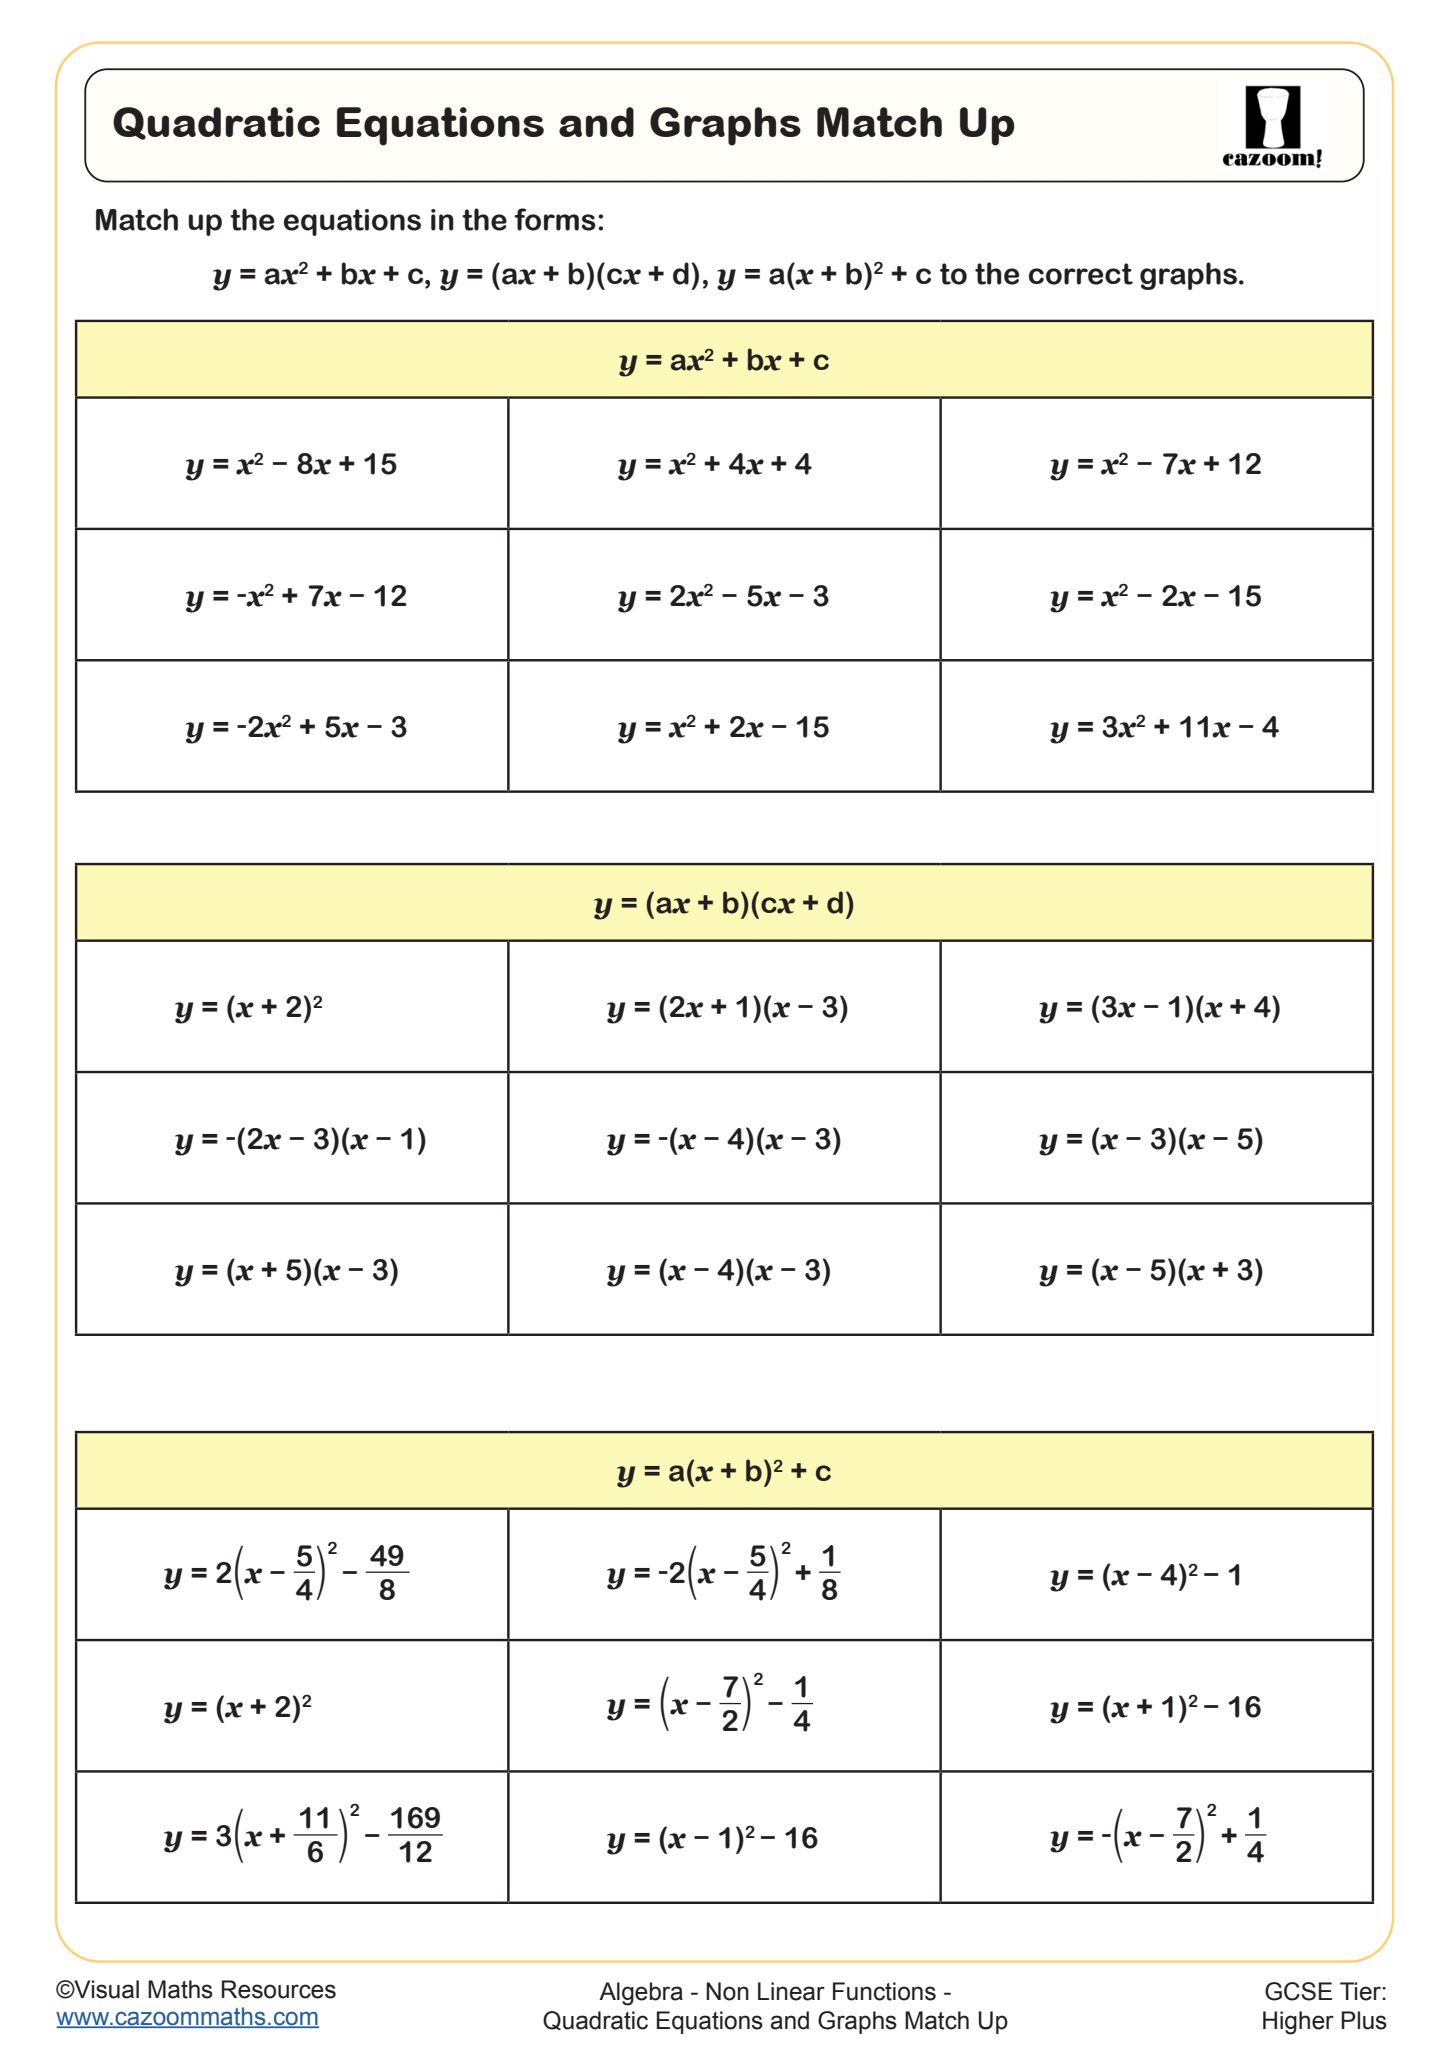
Quadratic Equations and Graphs Match Up
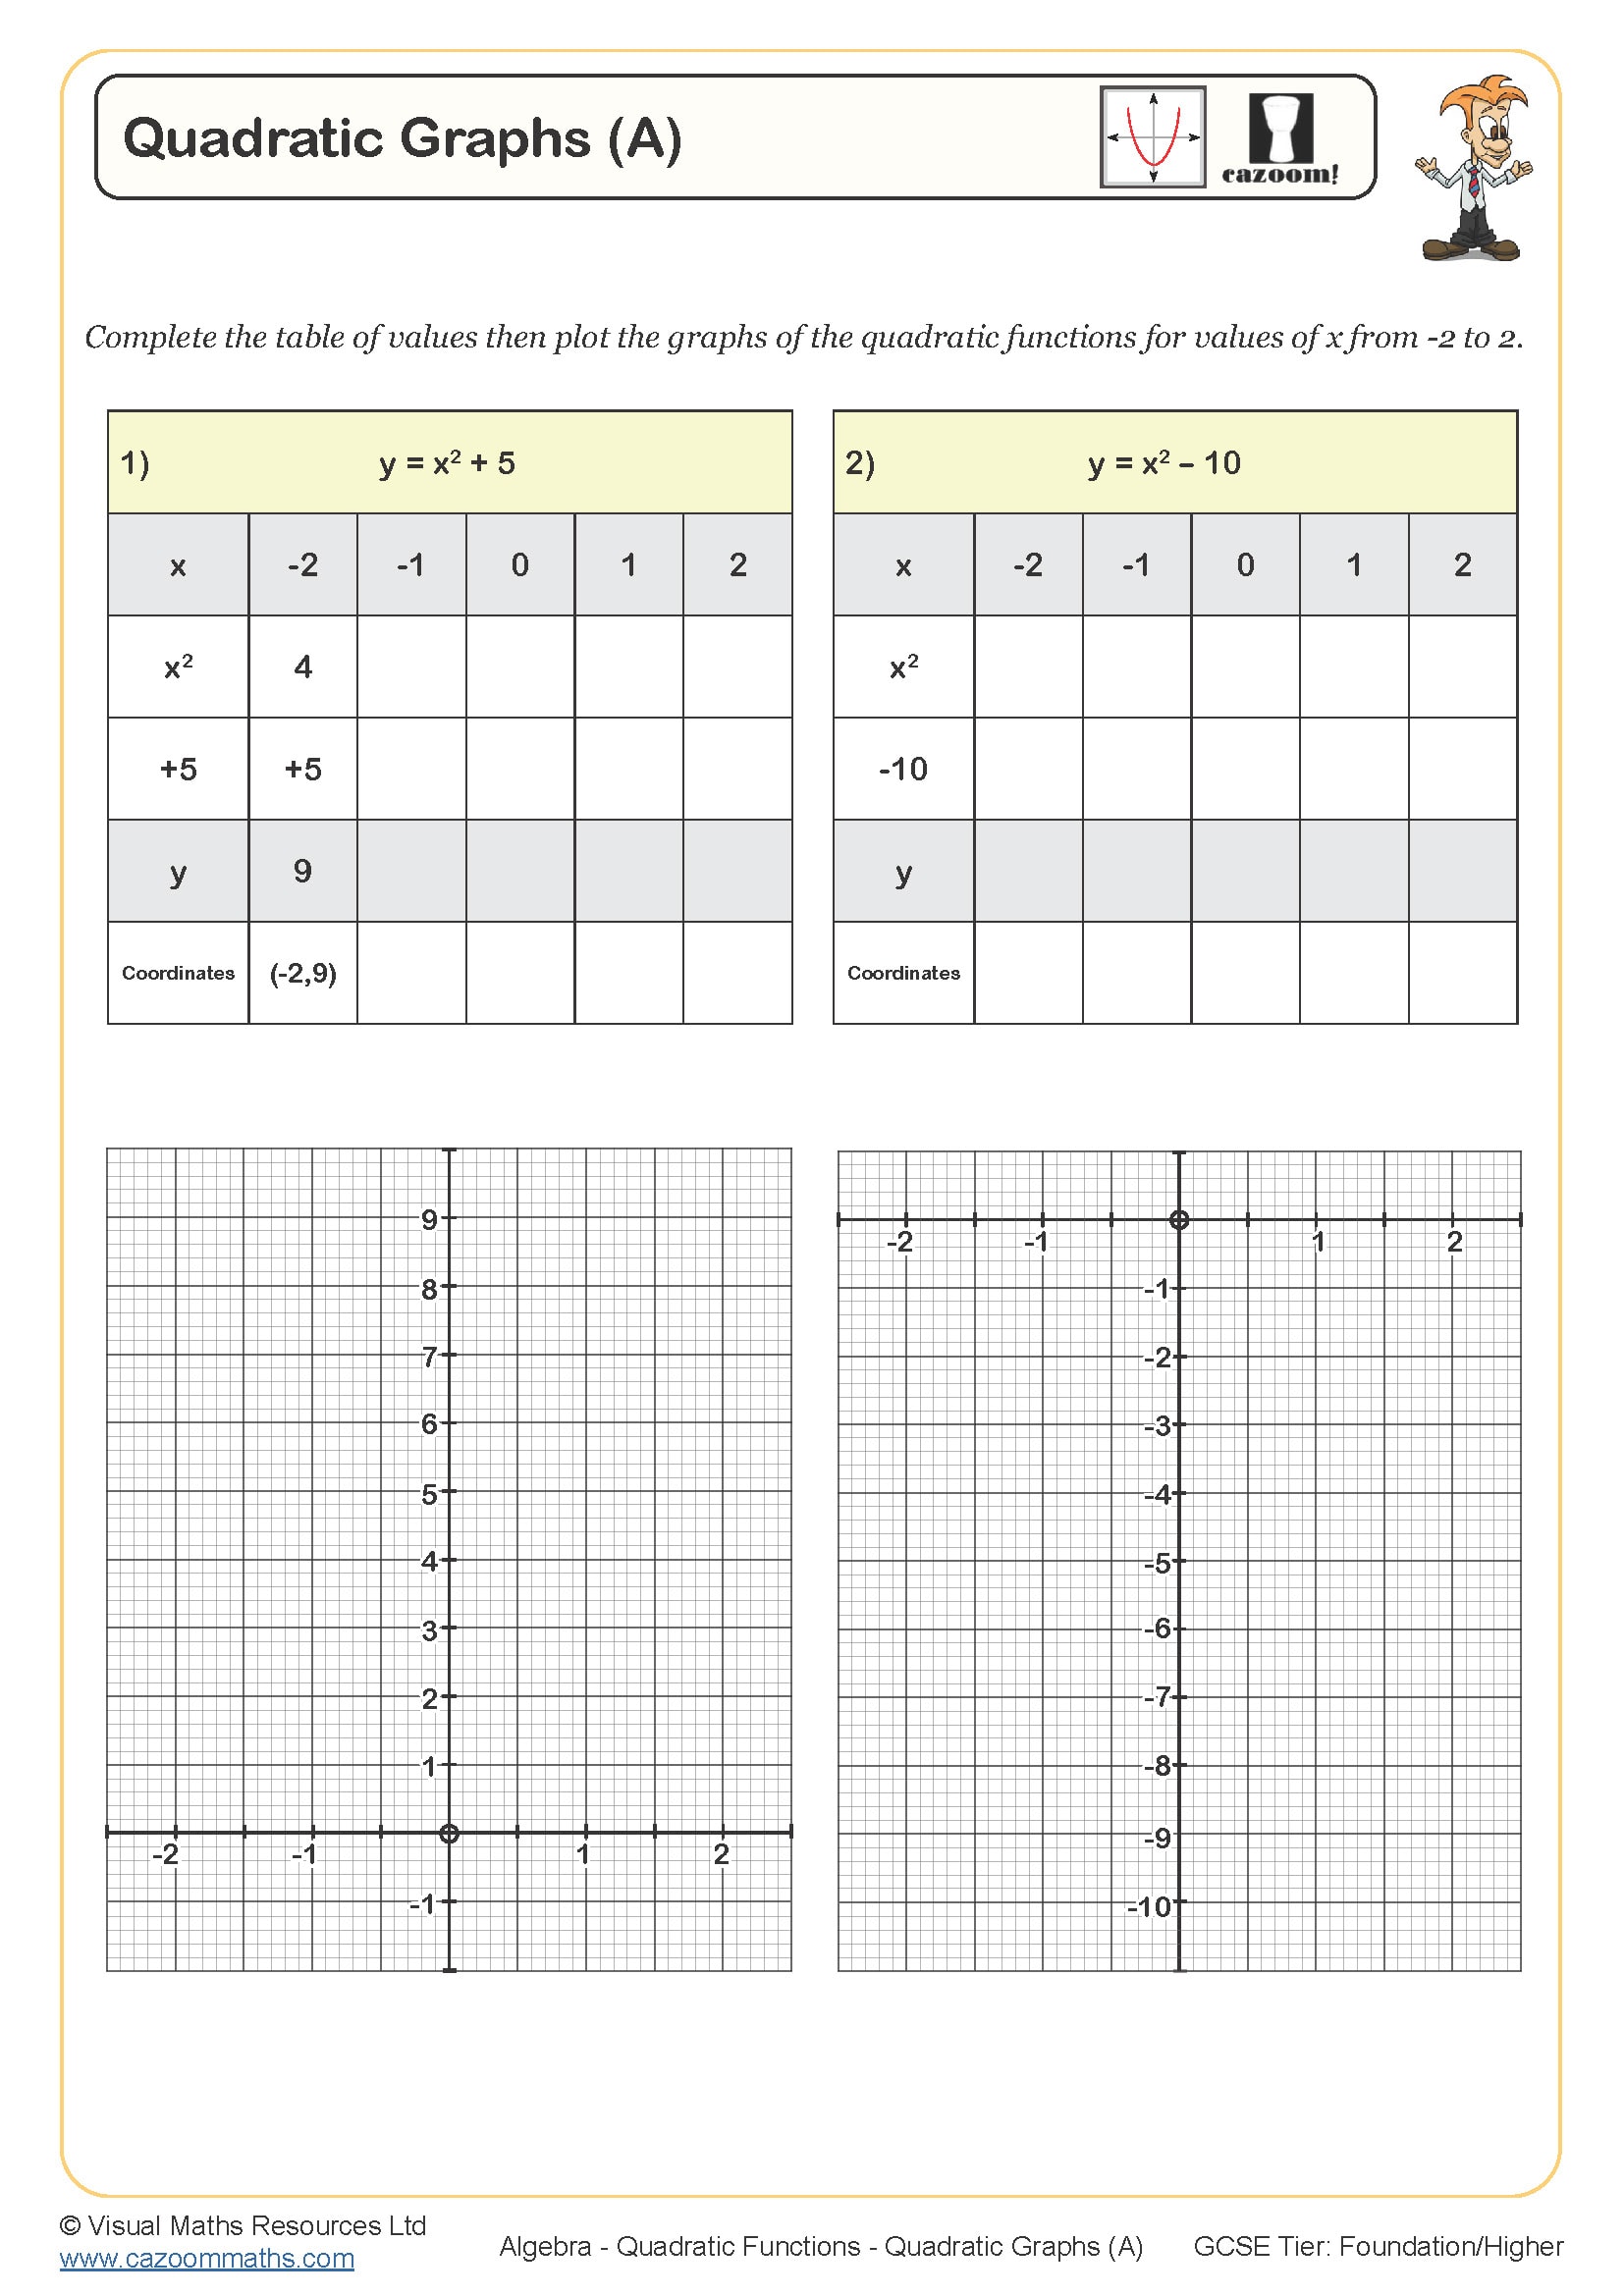
Quadratic Graphs (A)
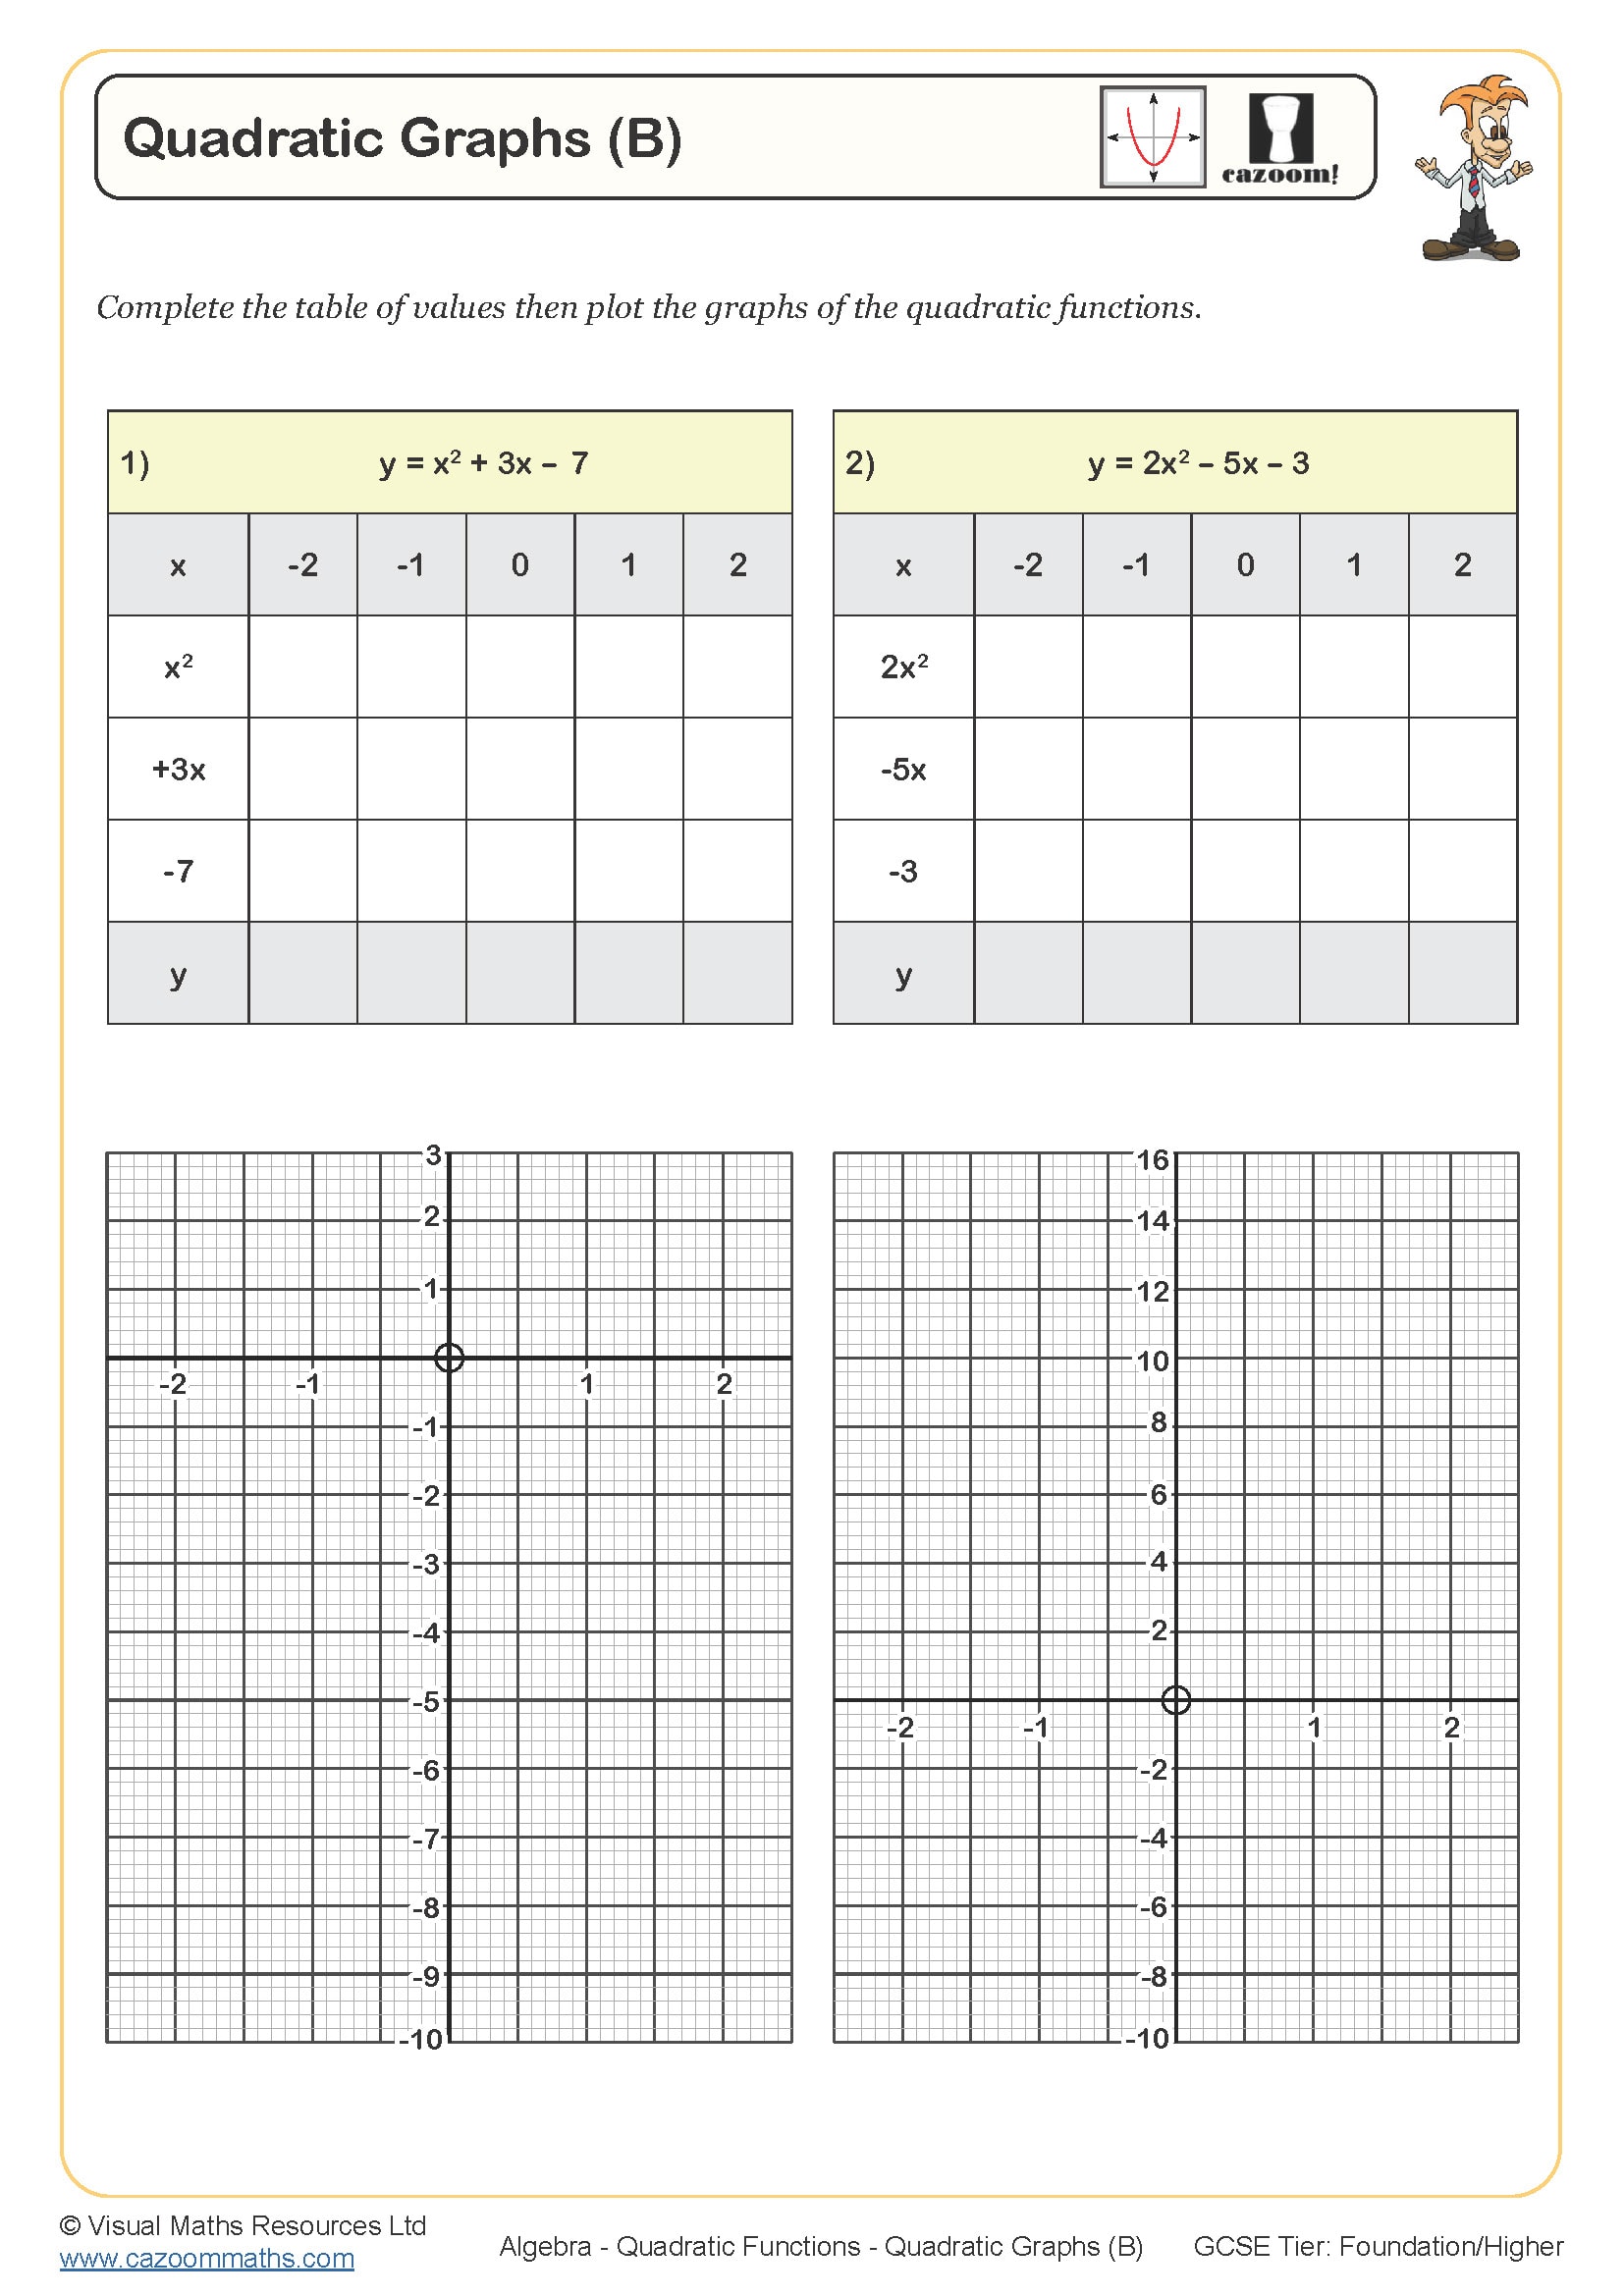
Quadratic Graphs (B)
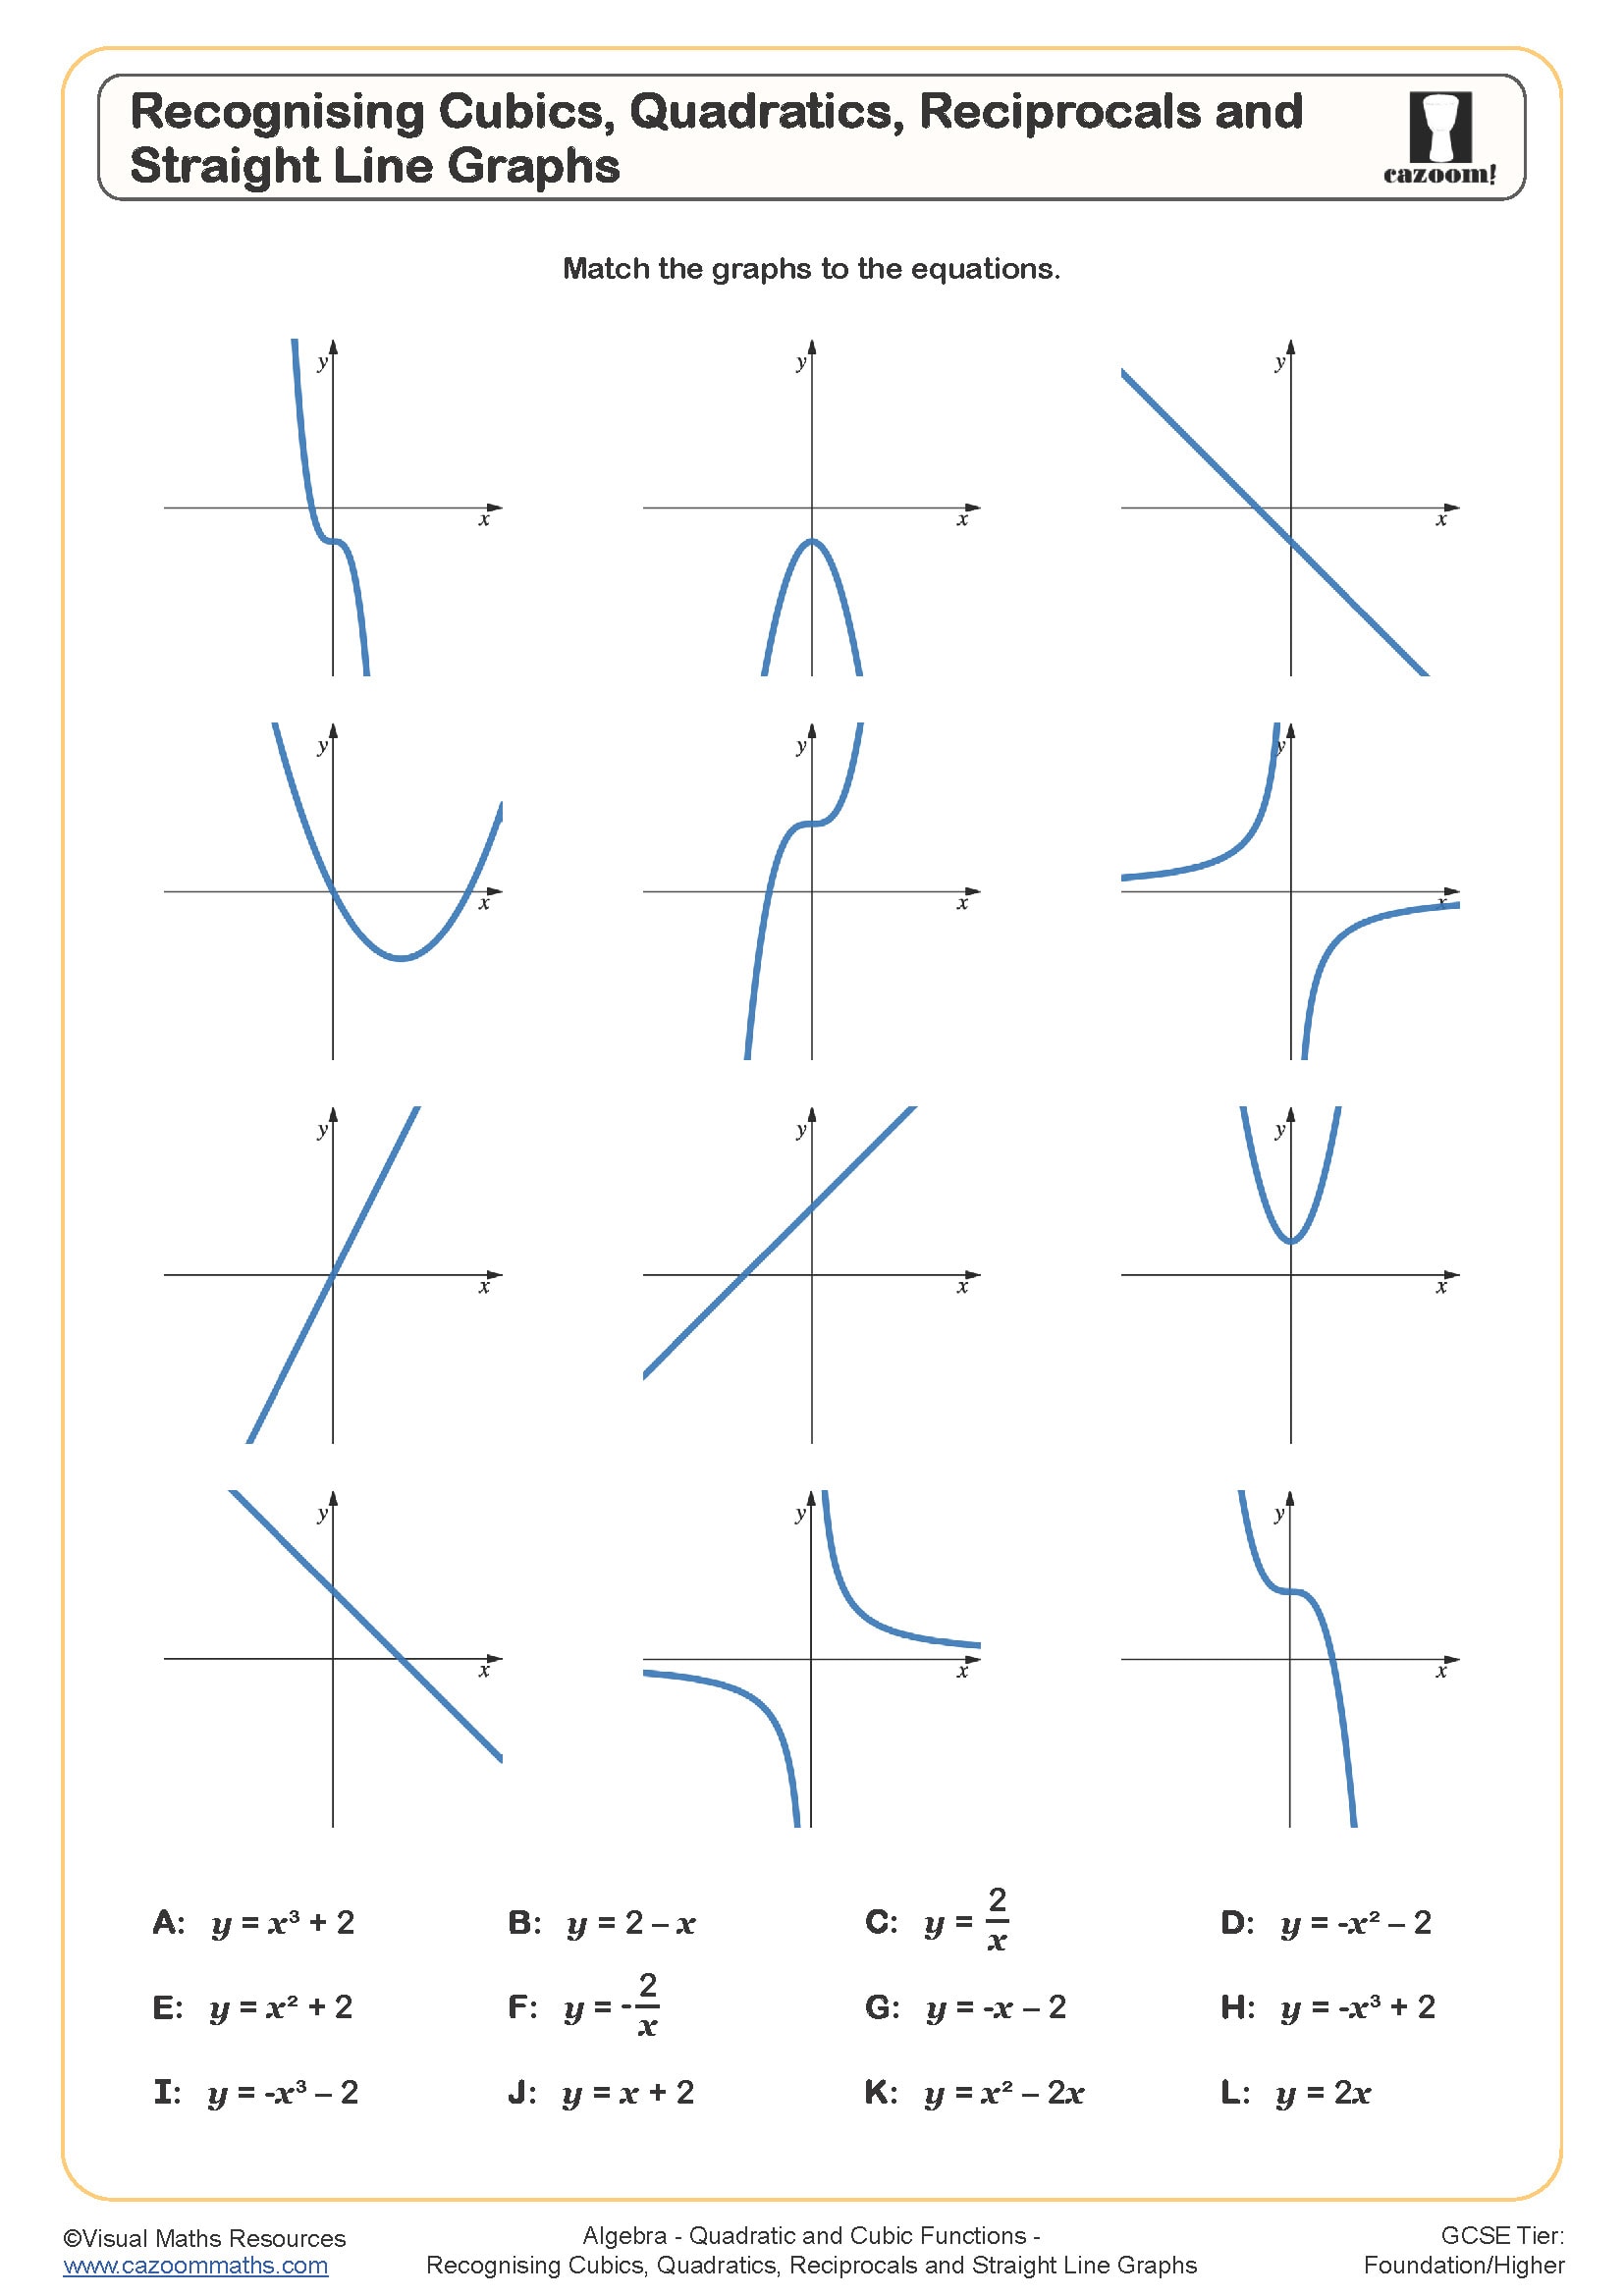
Recognising Cubics, Quadratics, Reciprocals and Straight Line Graphs
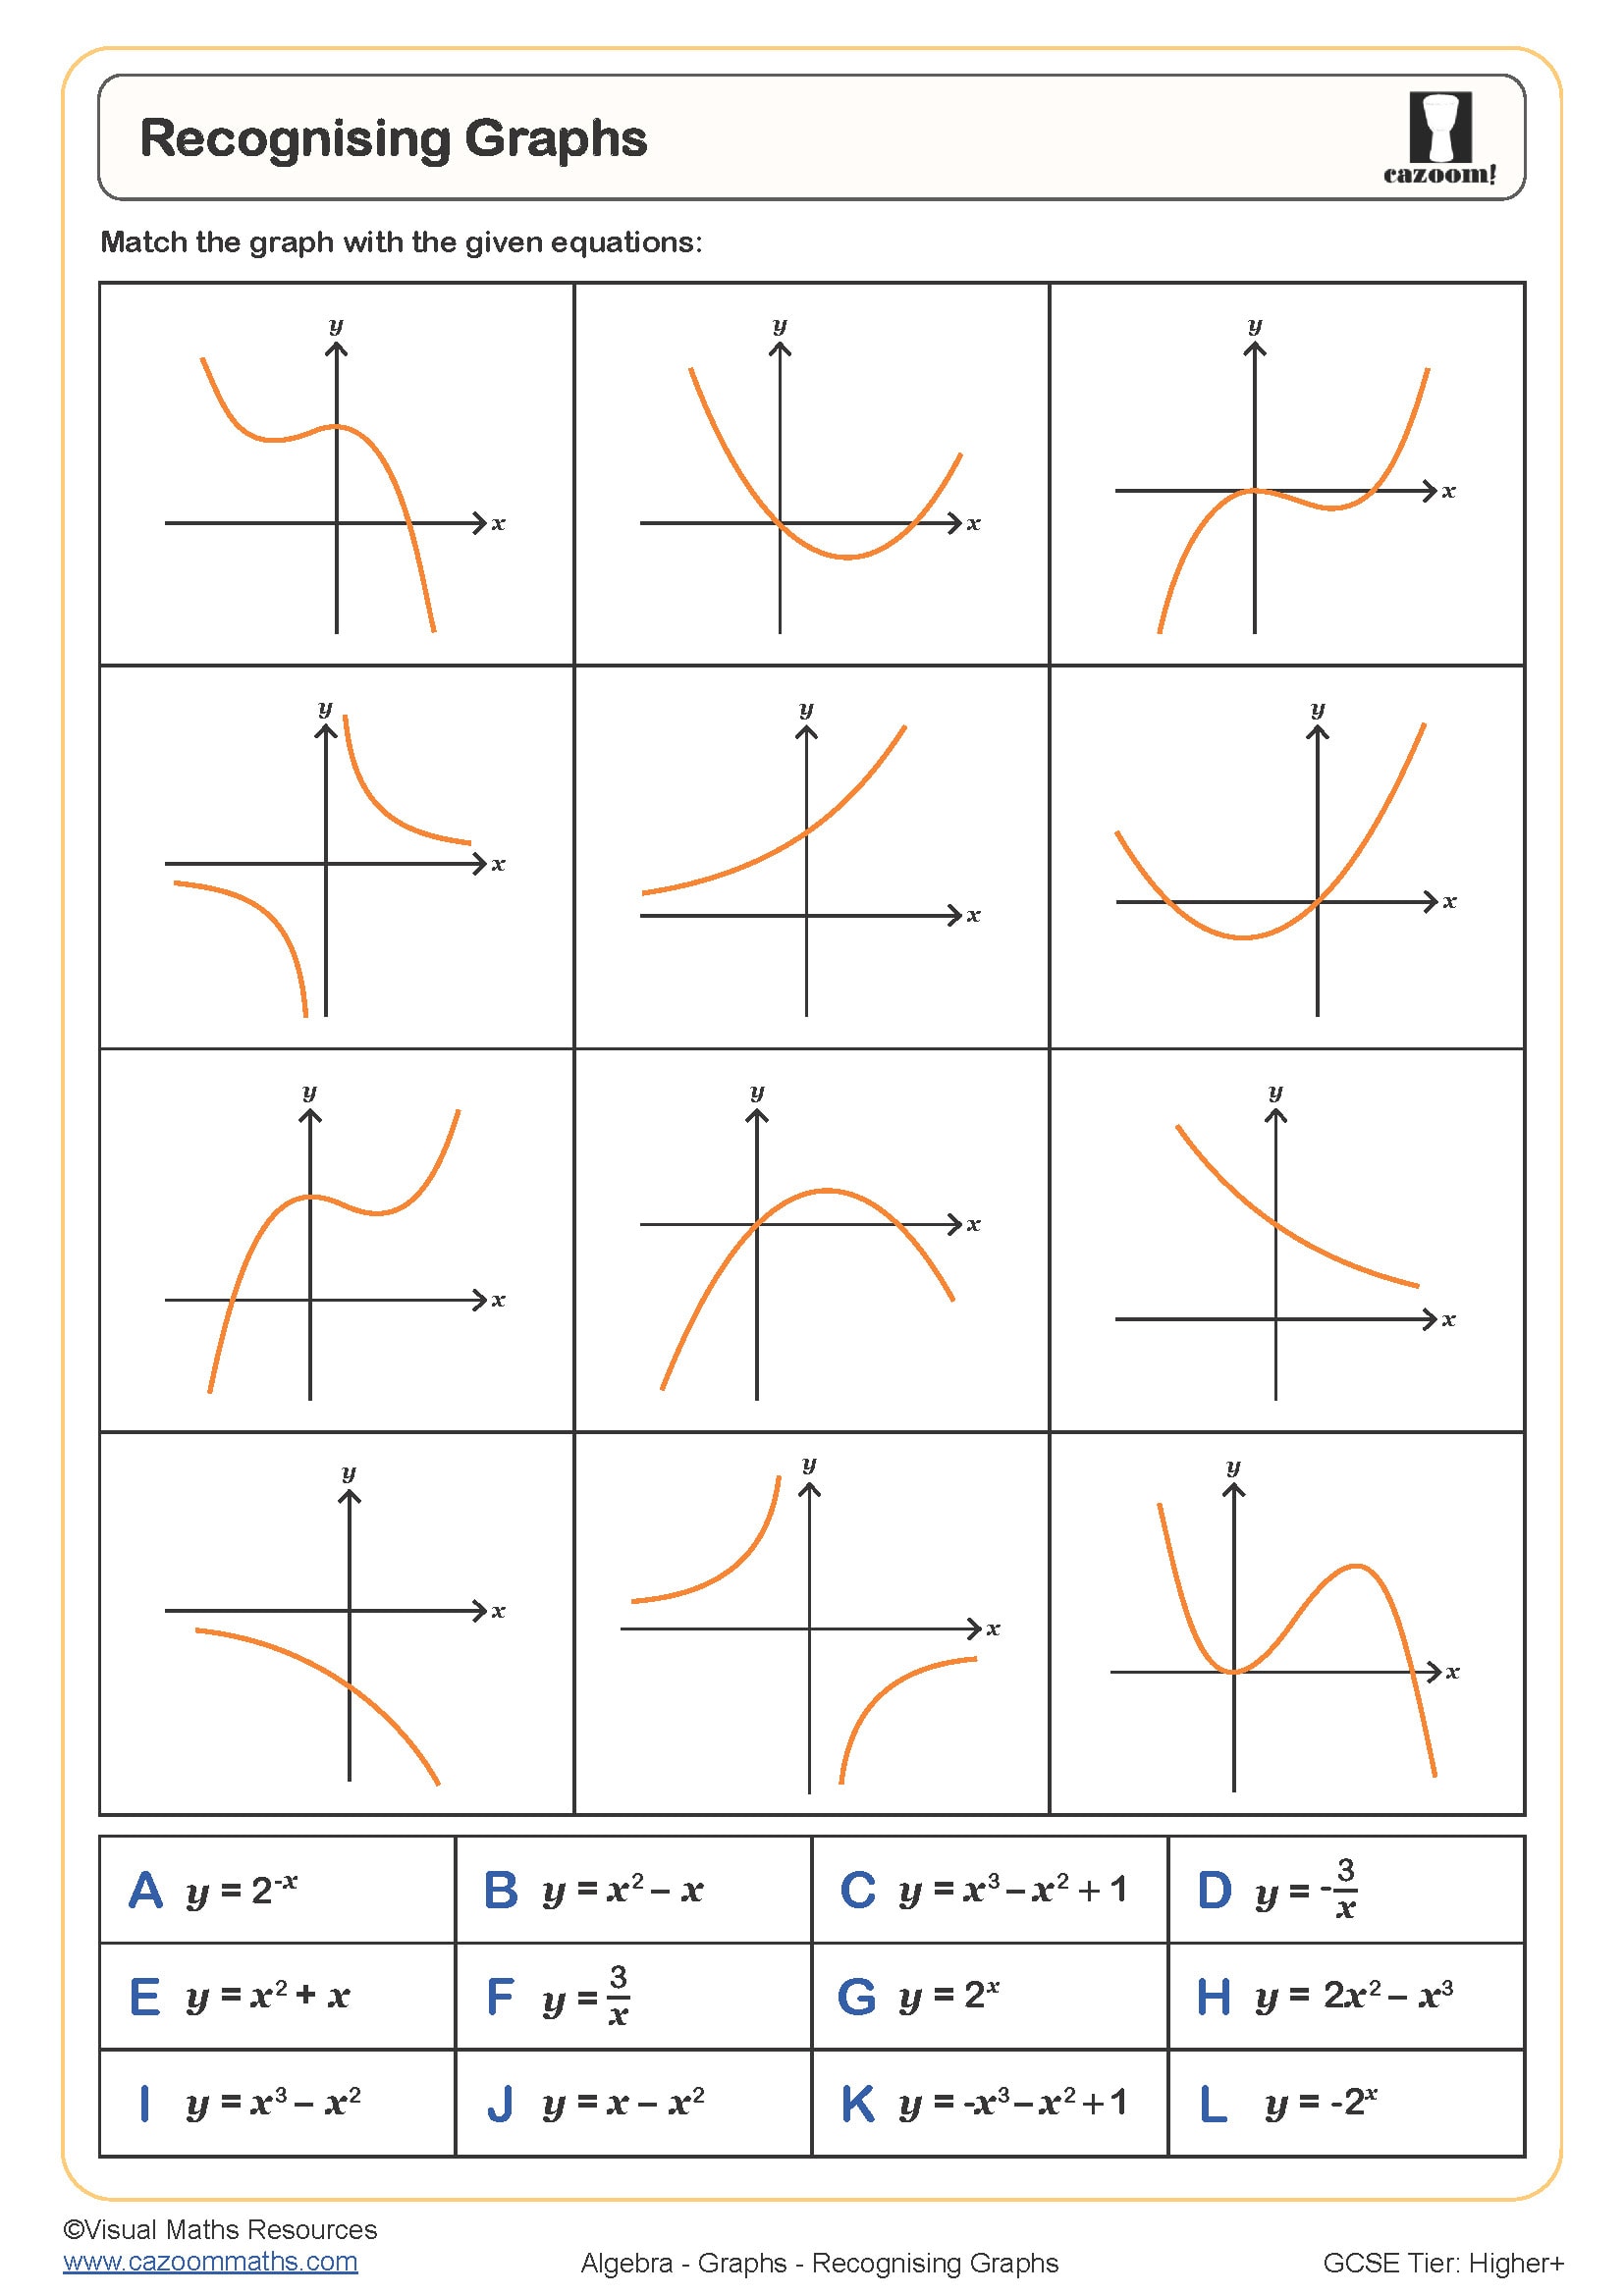
Recognising Graphs
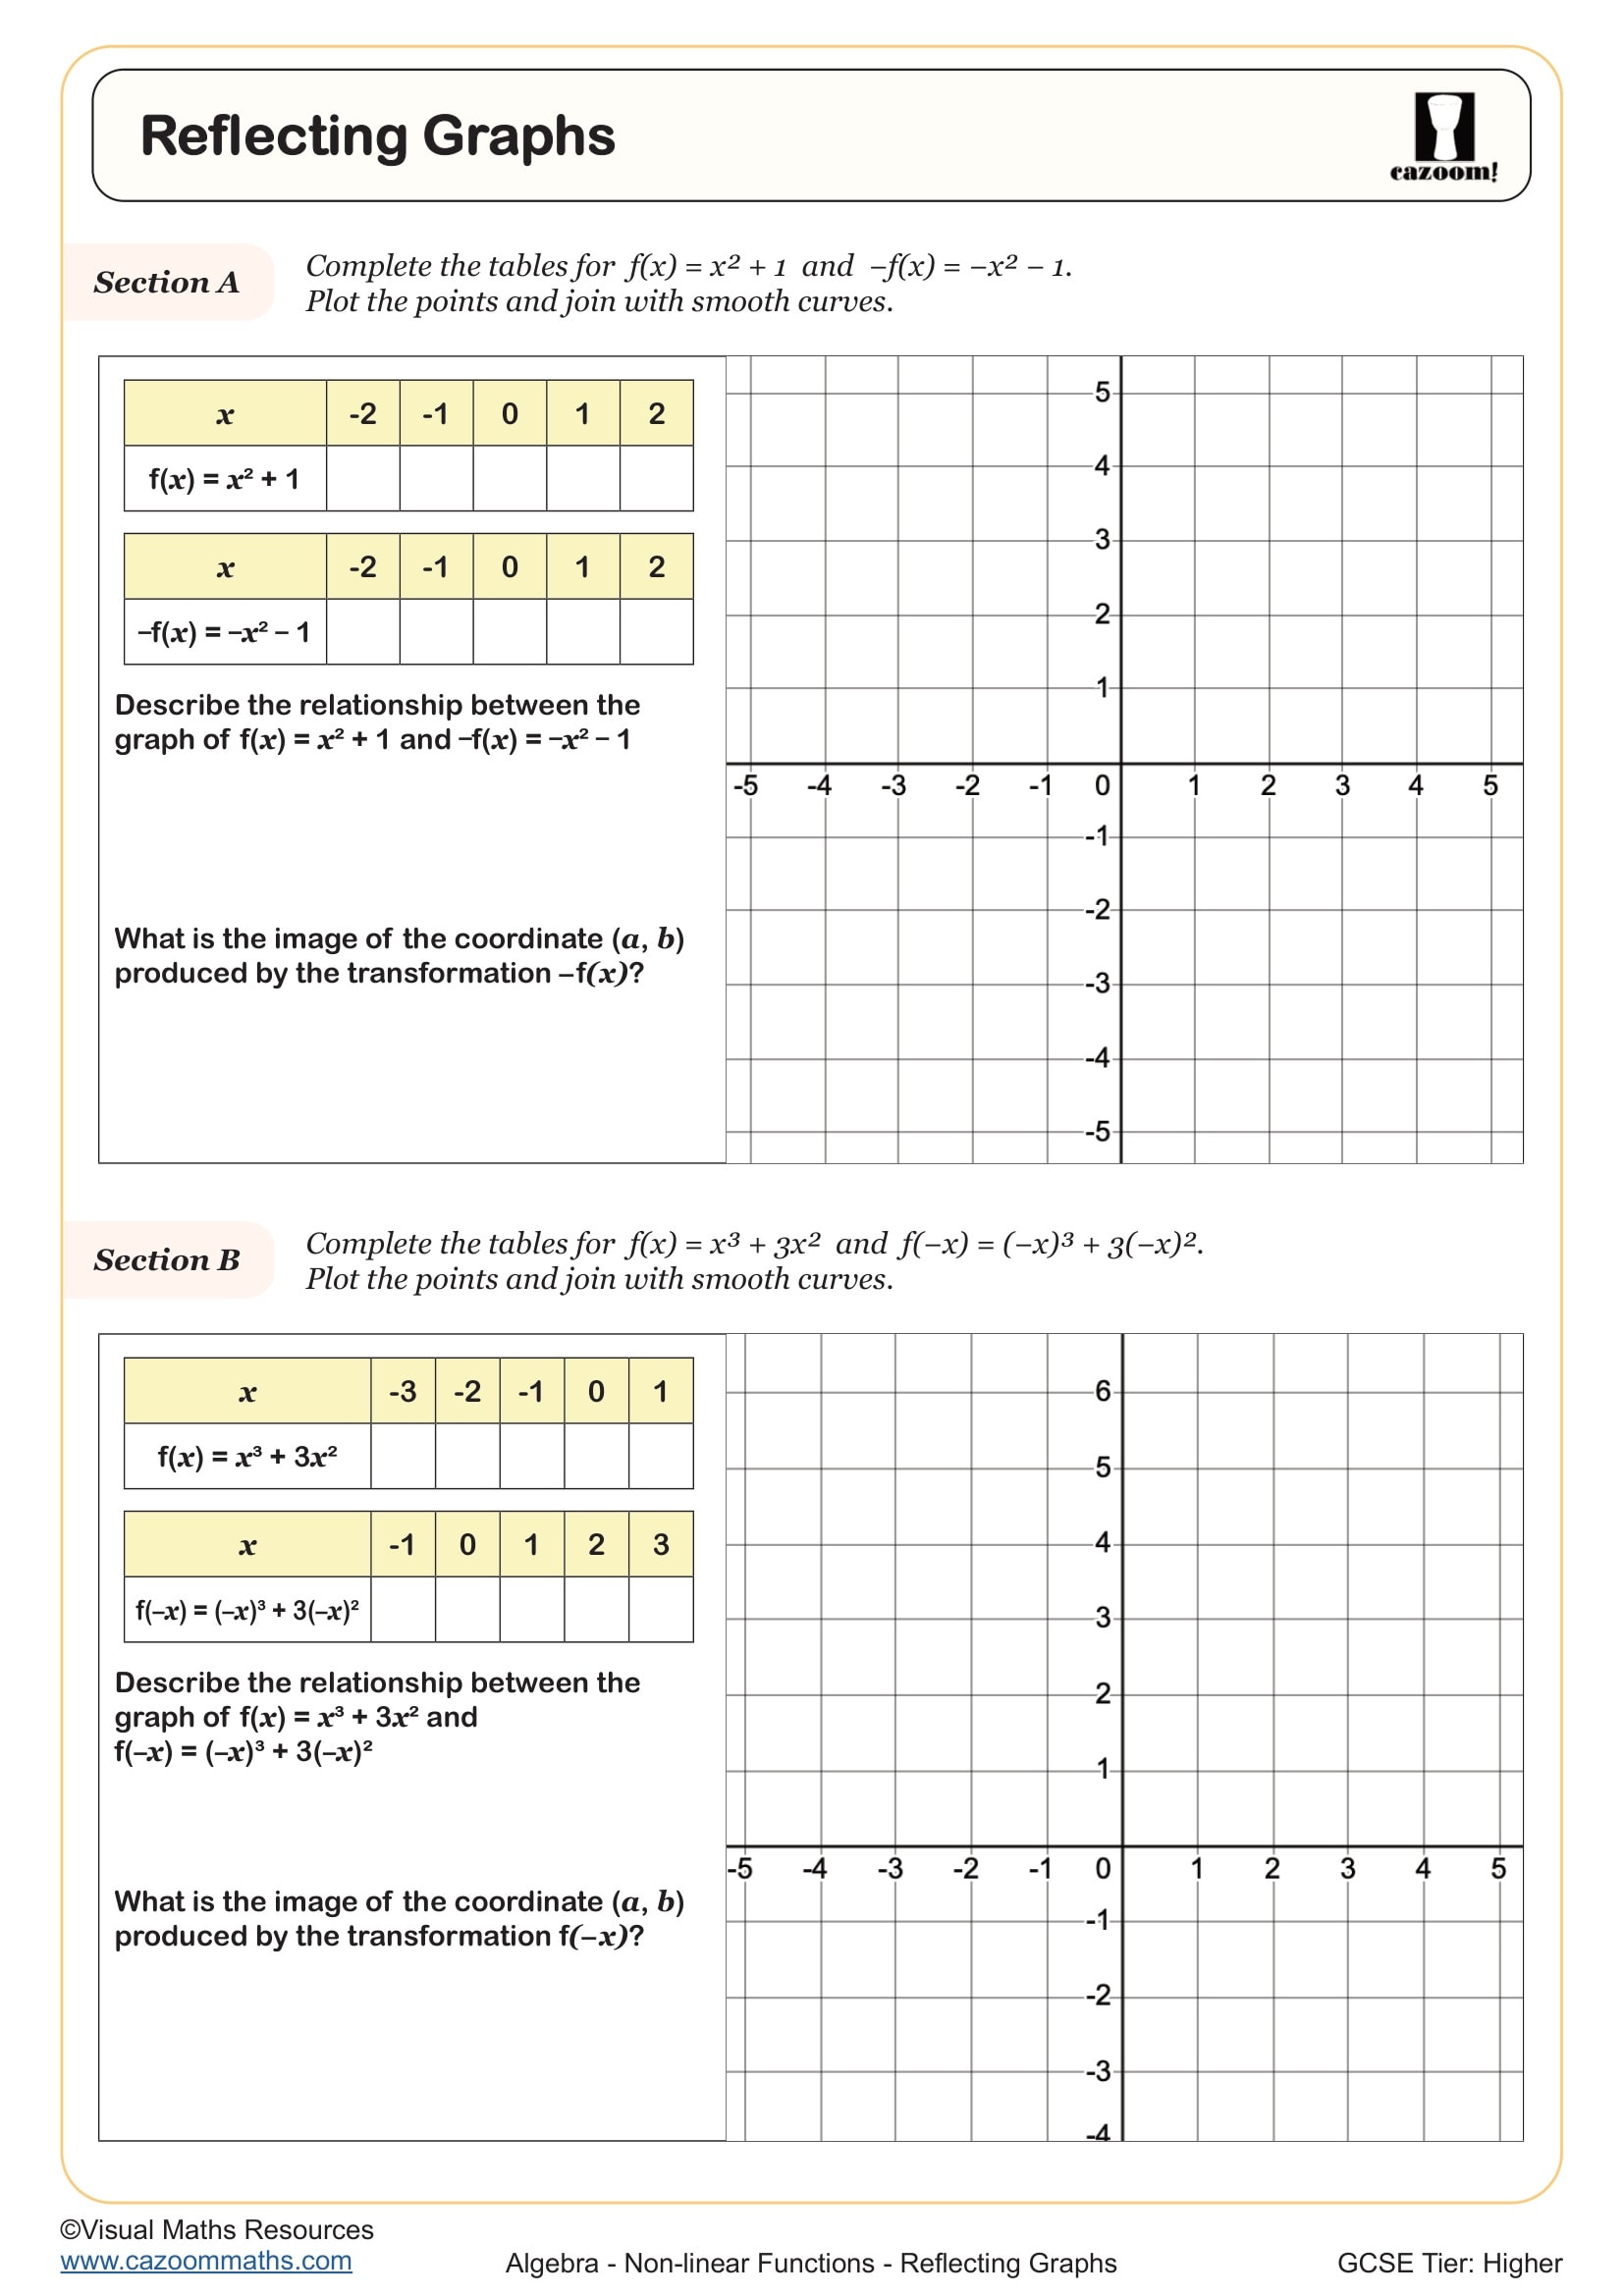
Reflecting Graphs
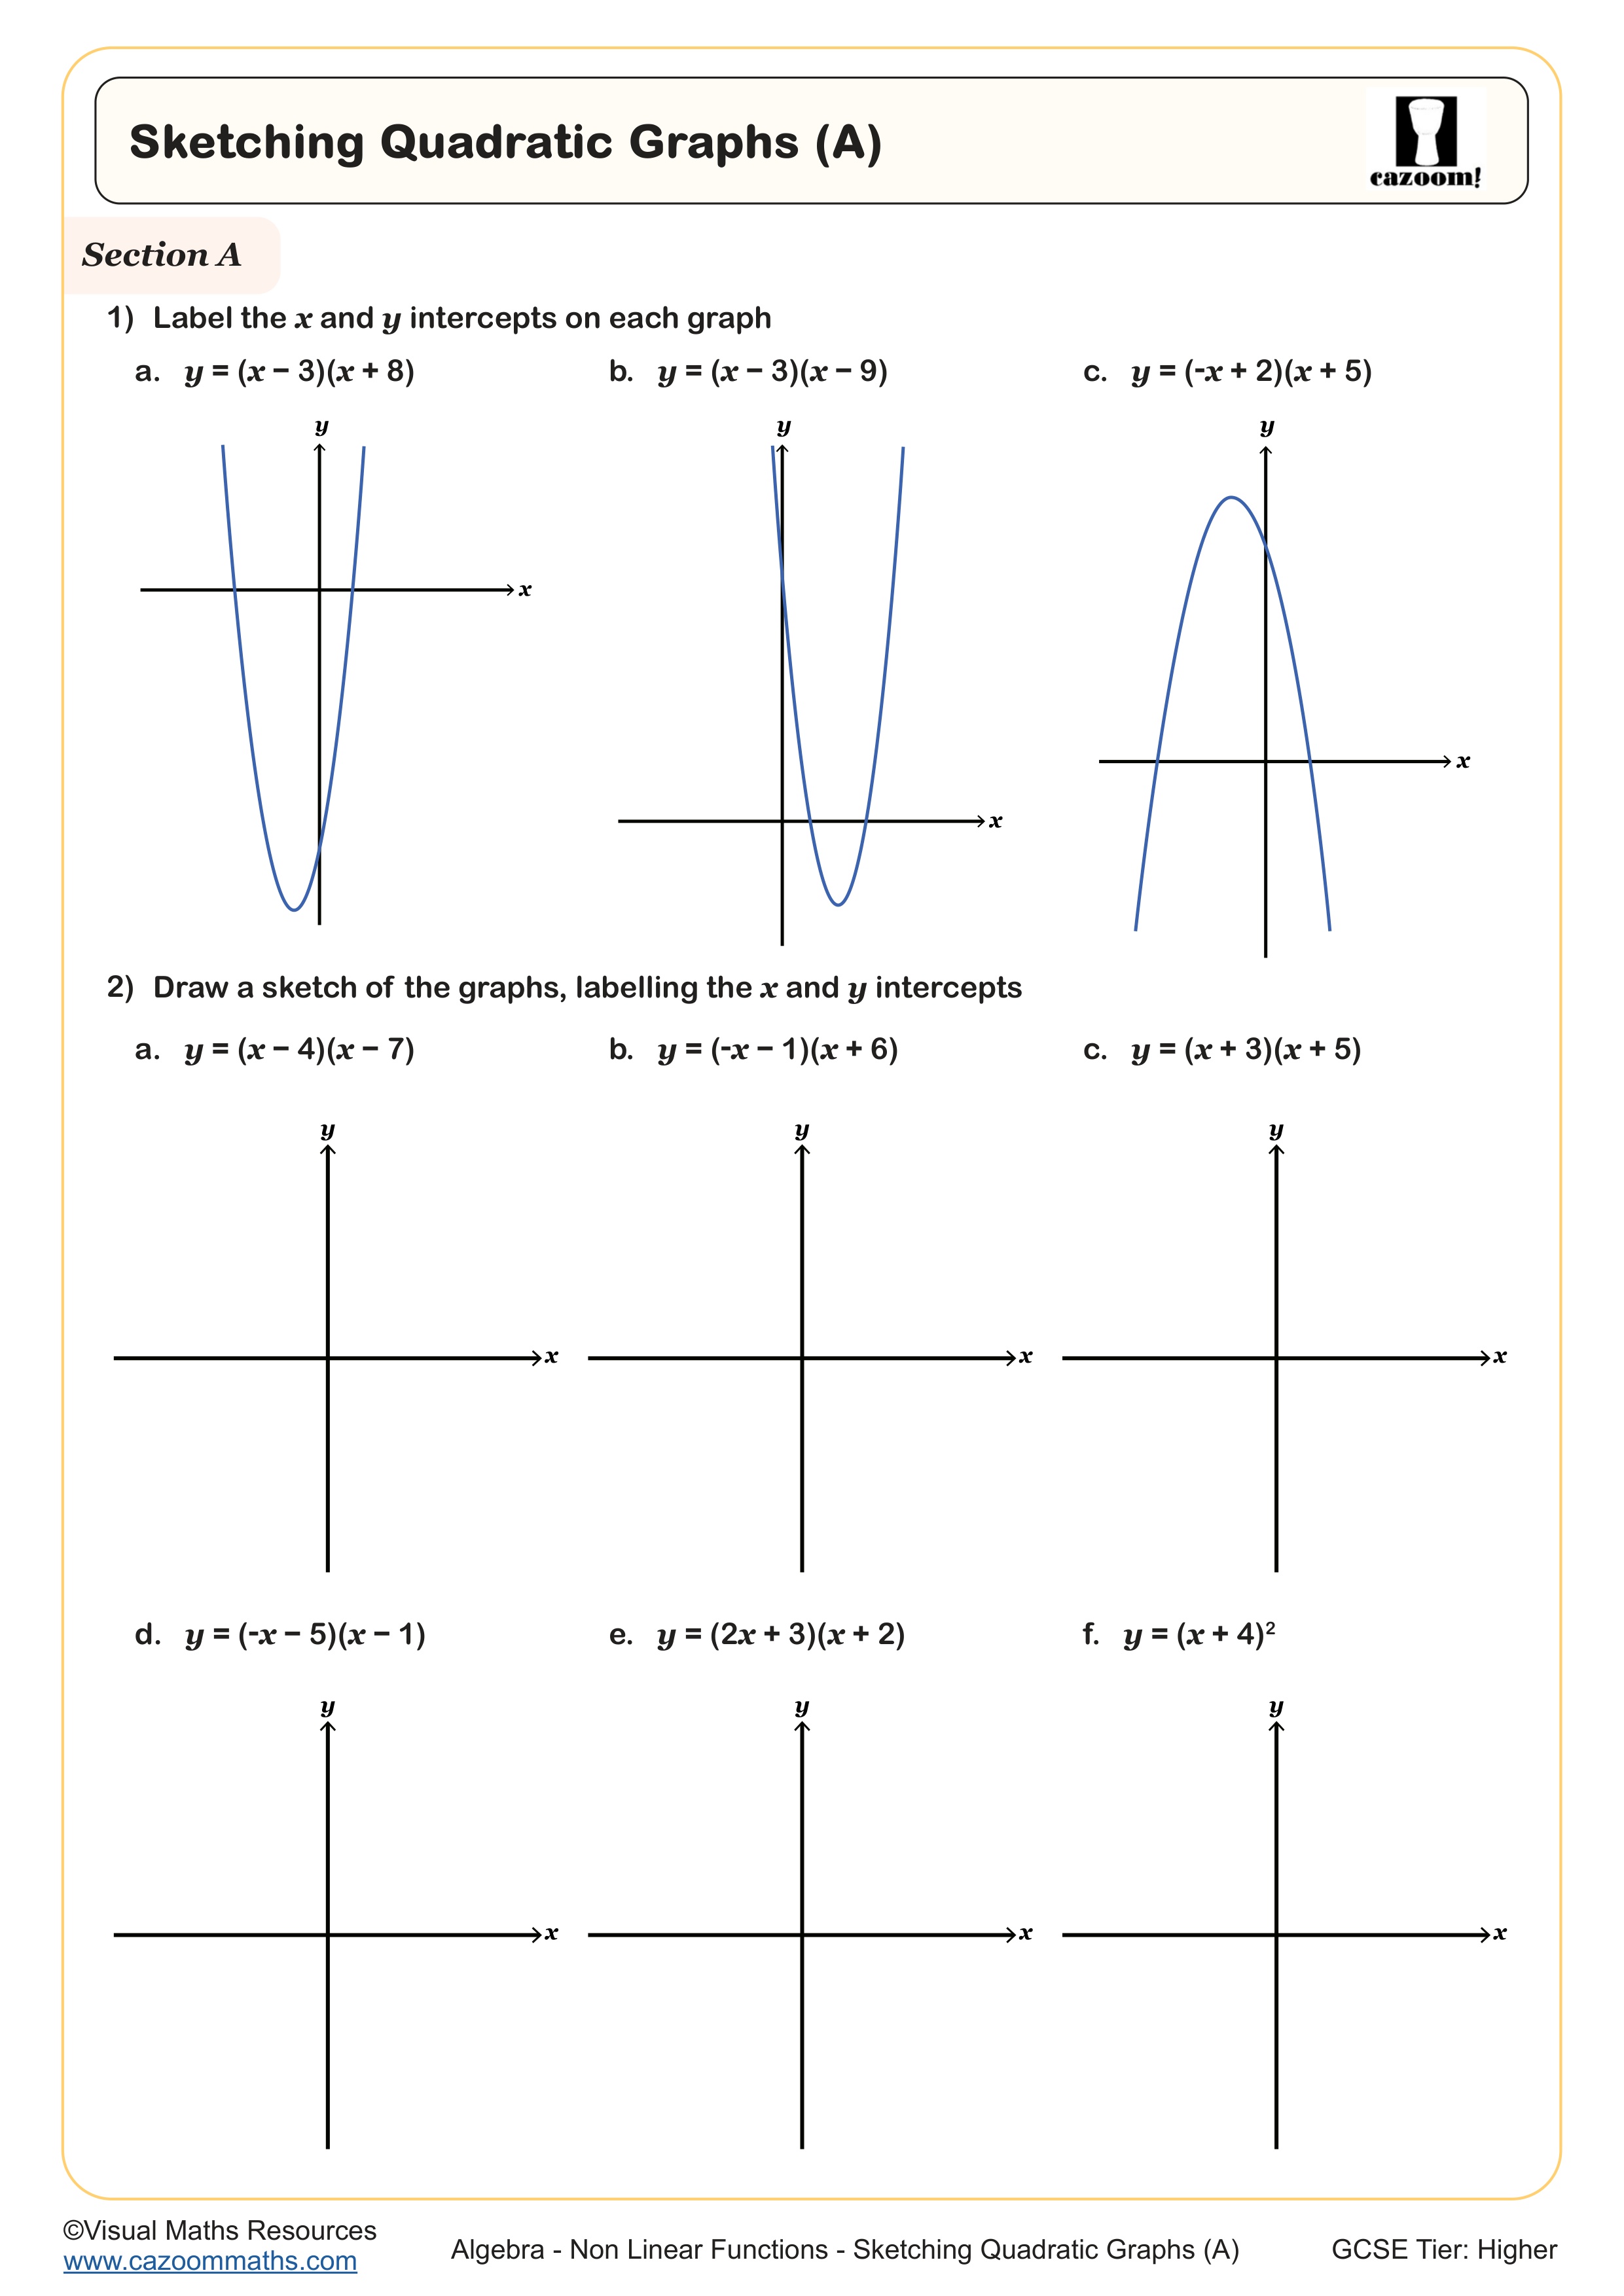
Sketching Quadratic Graphs (A)
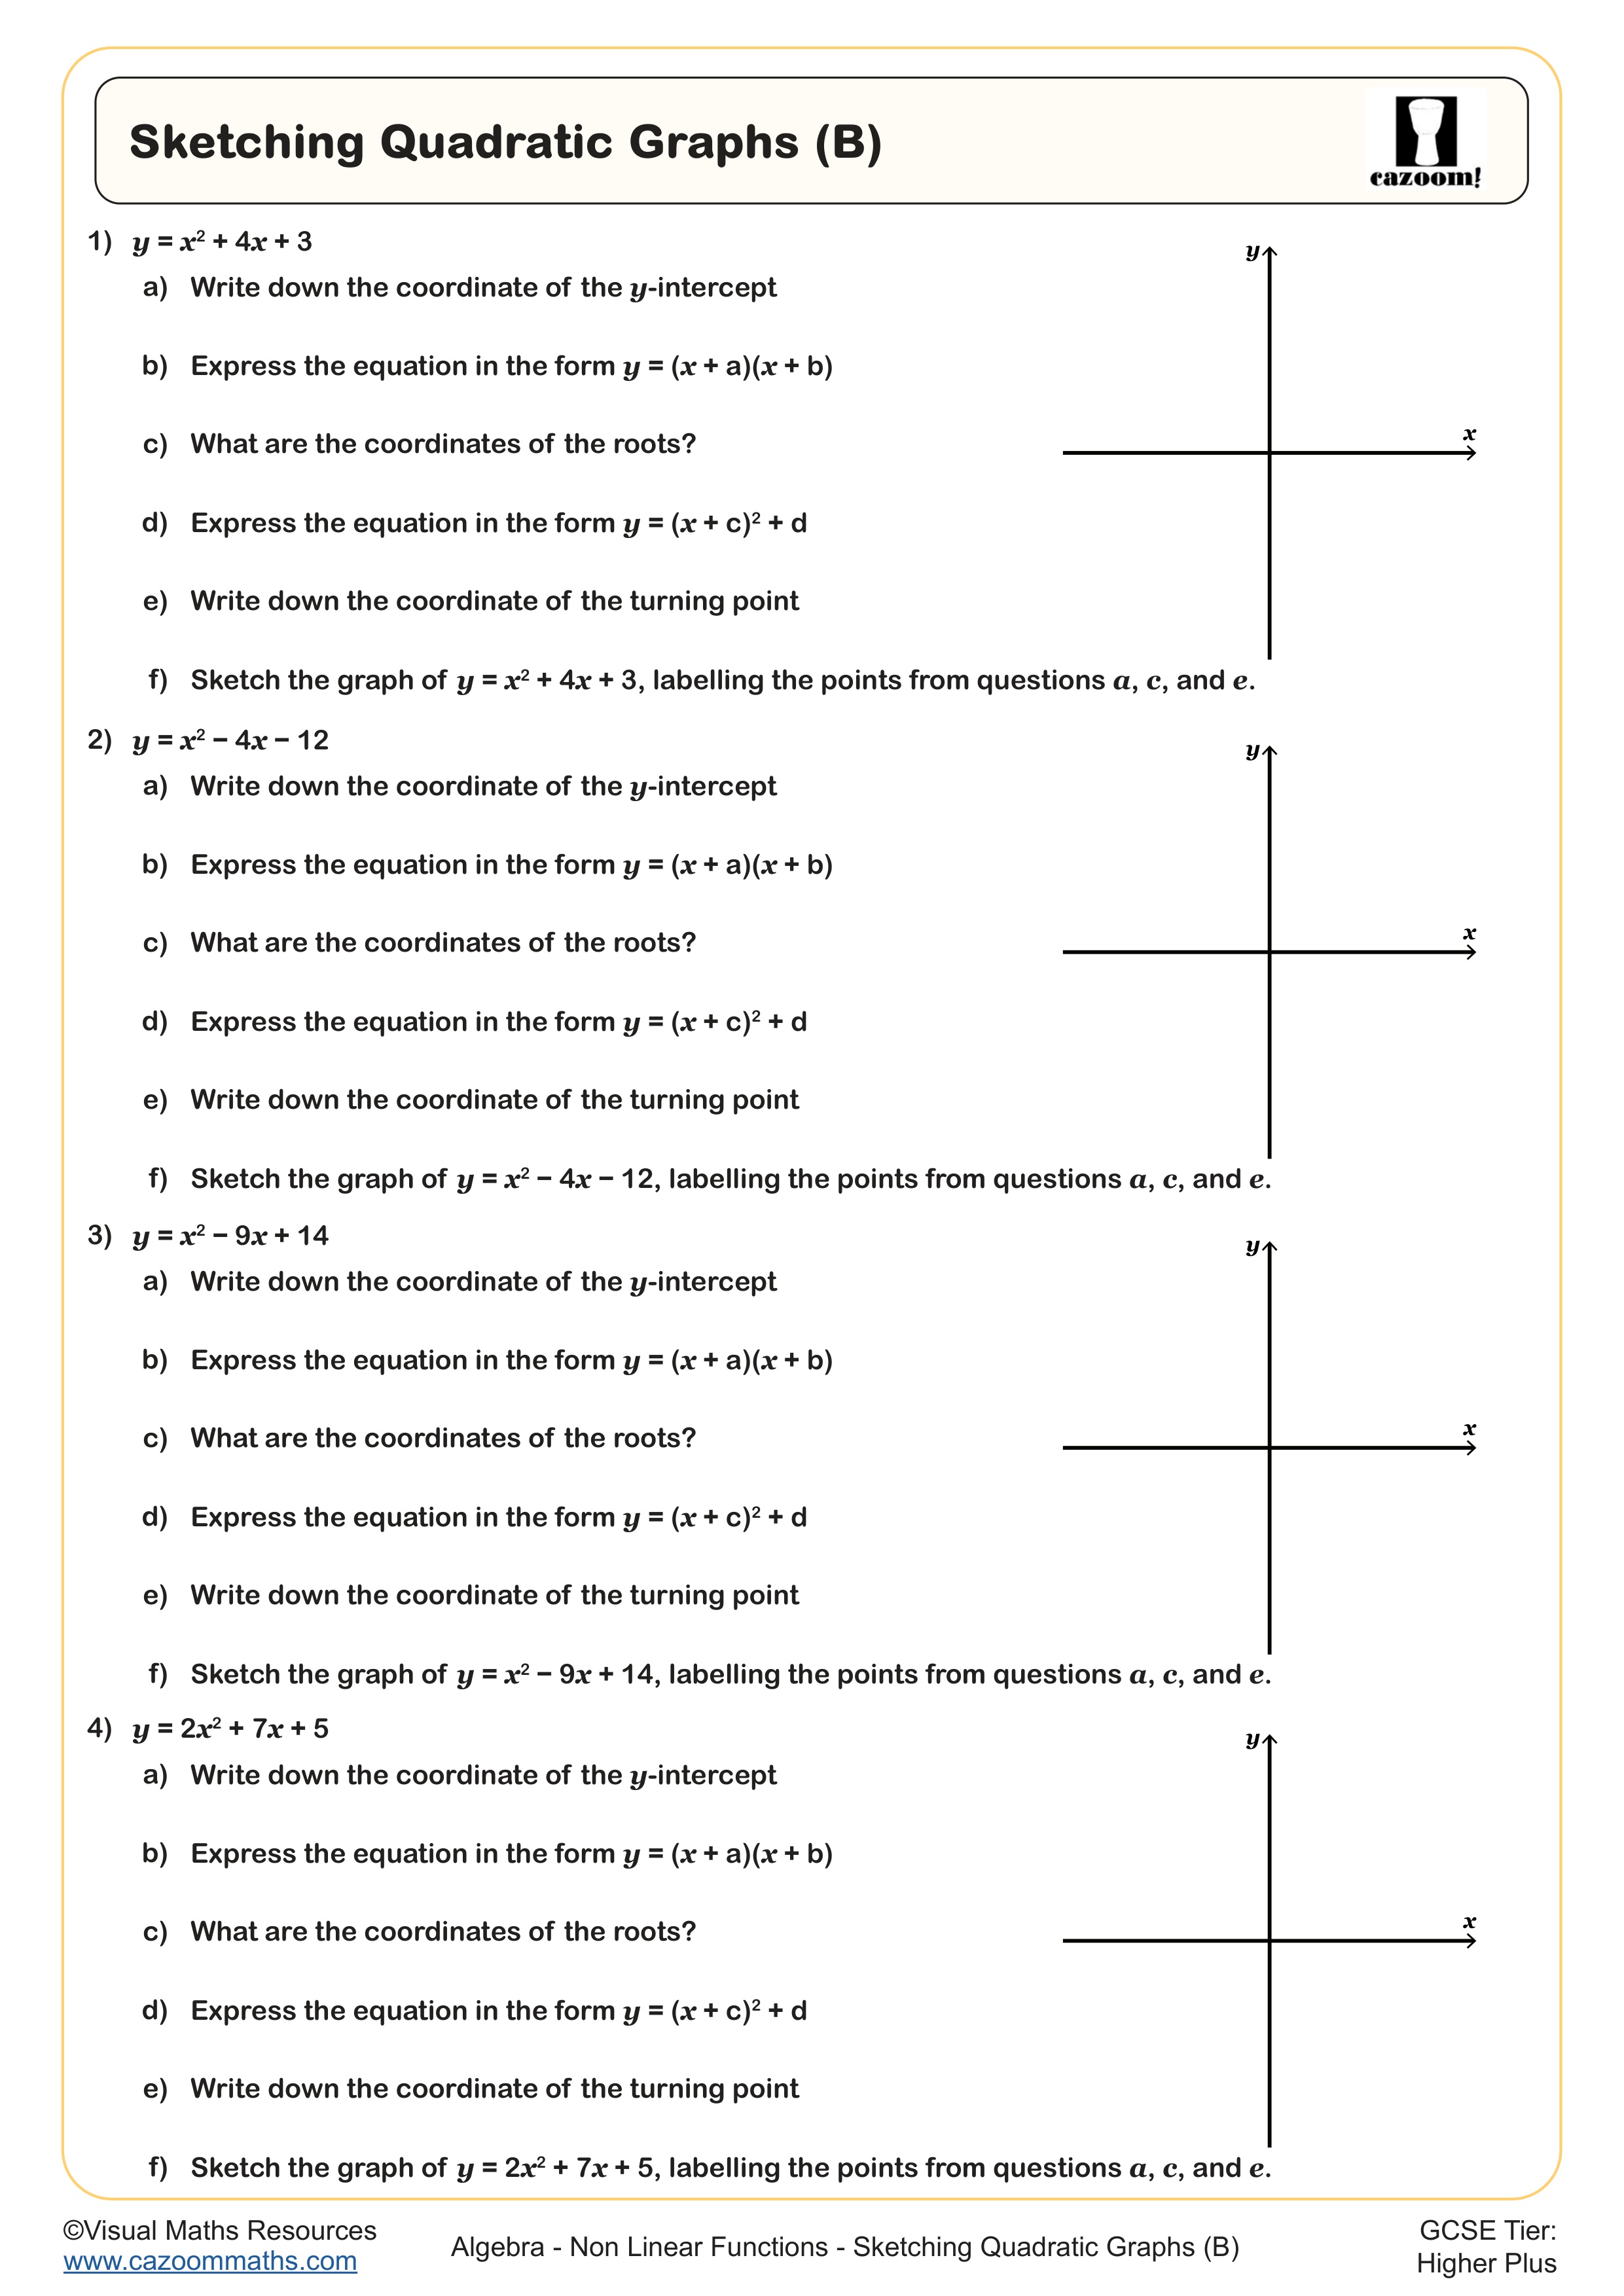
Sketching Quadratic Graphs (B)
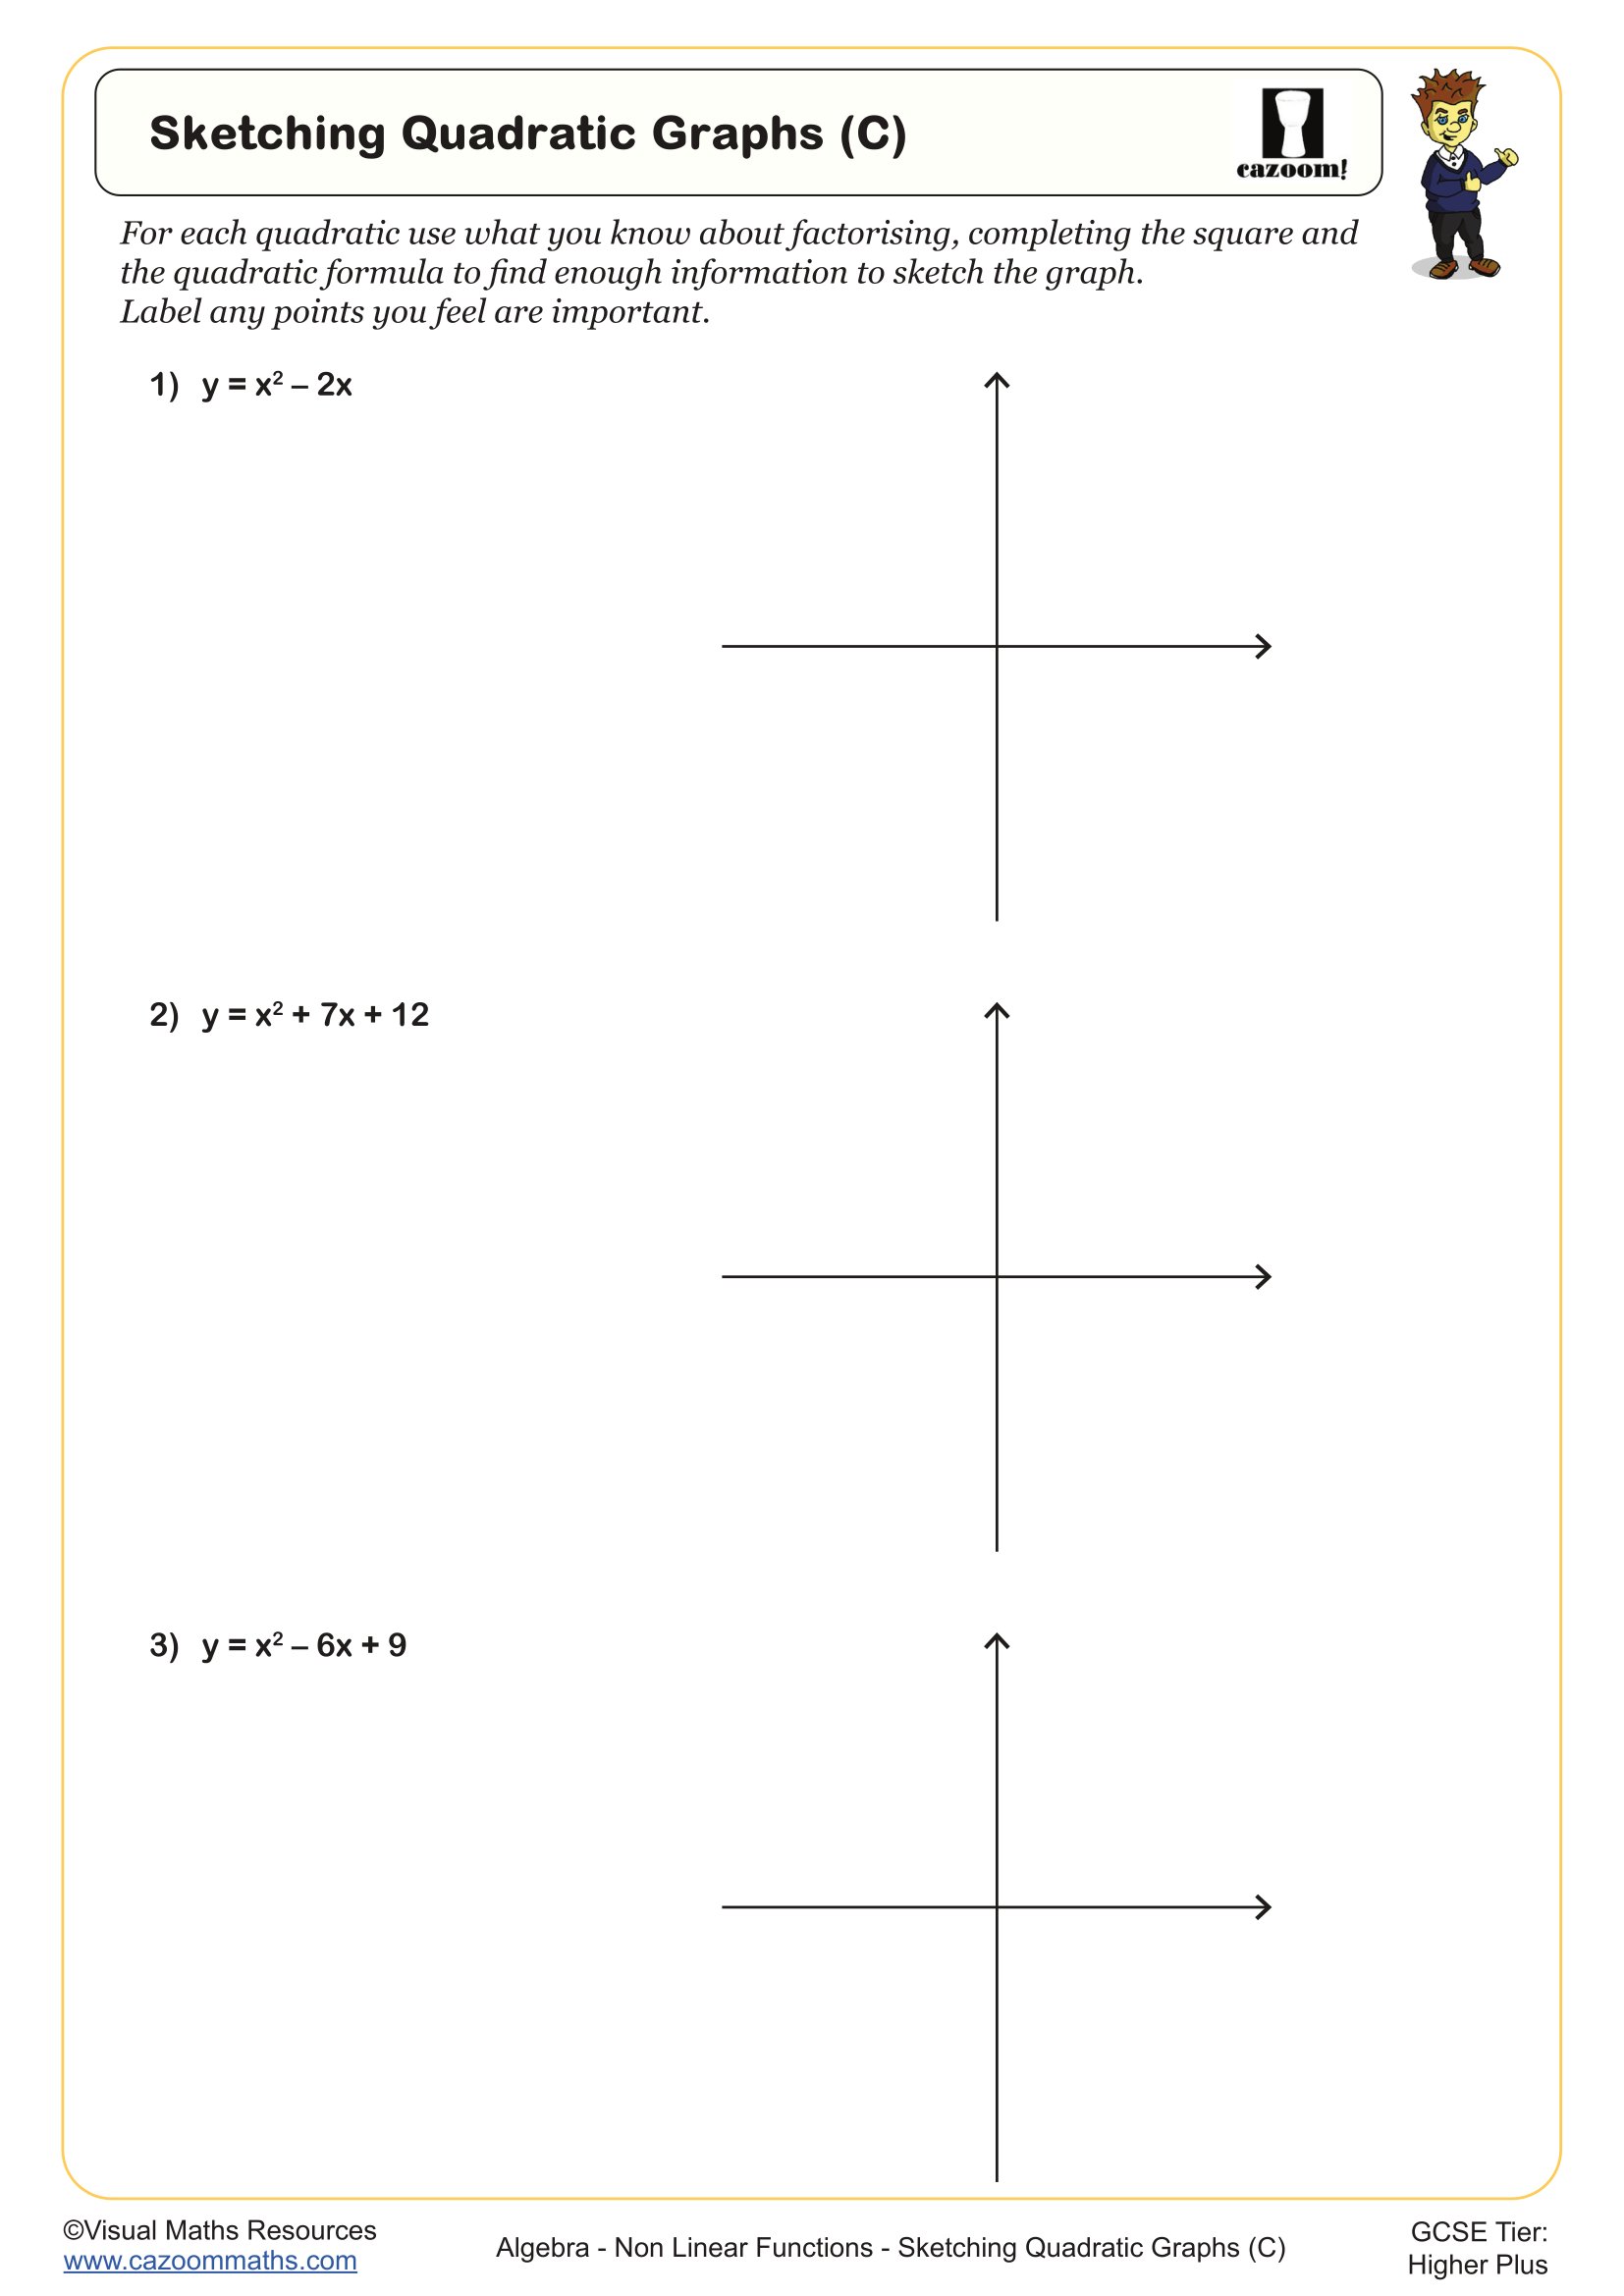
Sketching Quadratic Graphs (C)
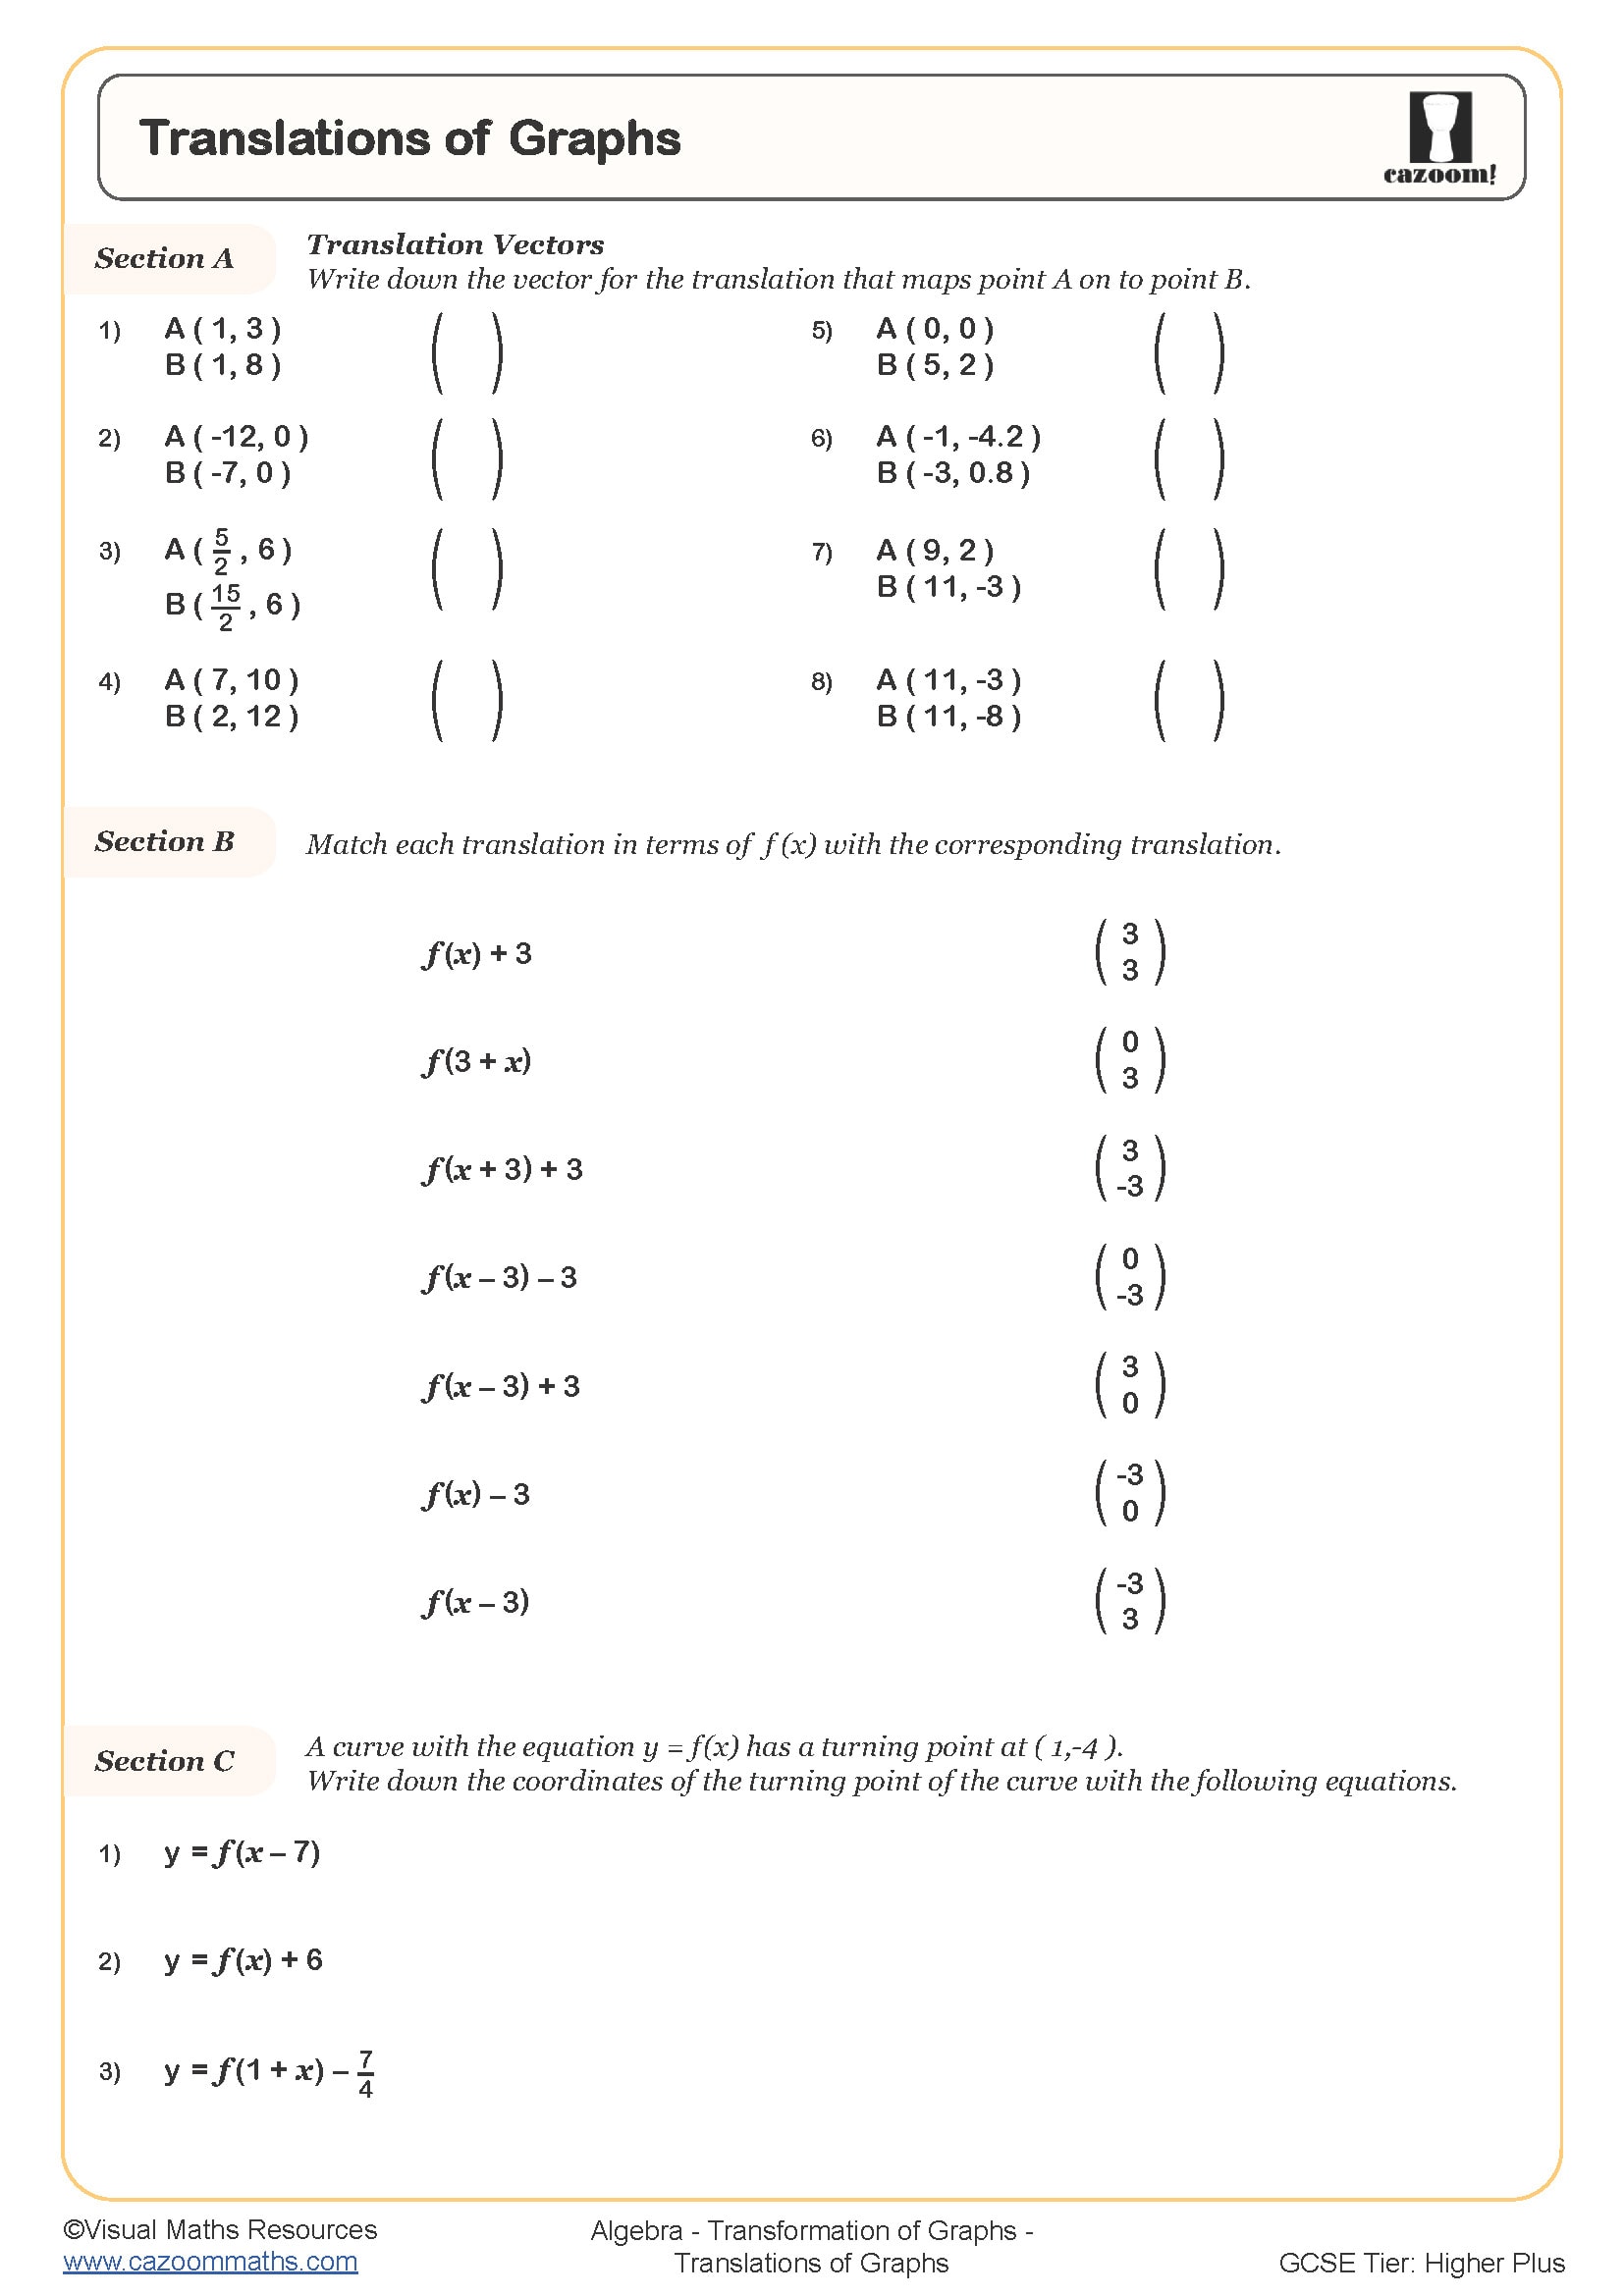
Translating Graphs
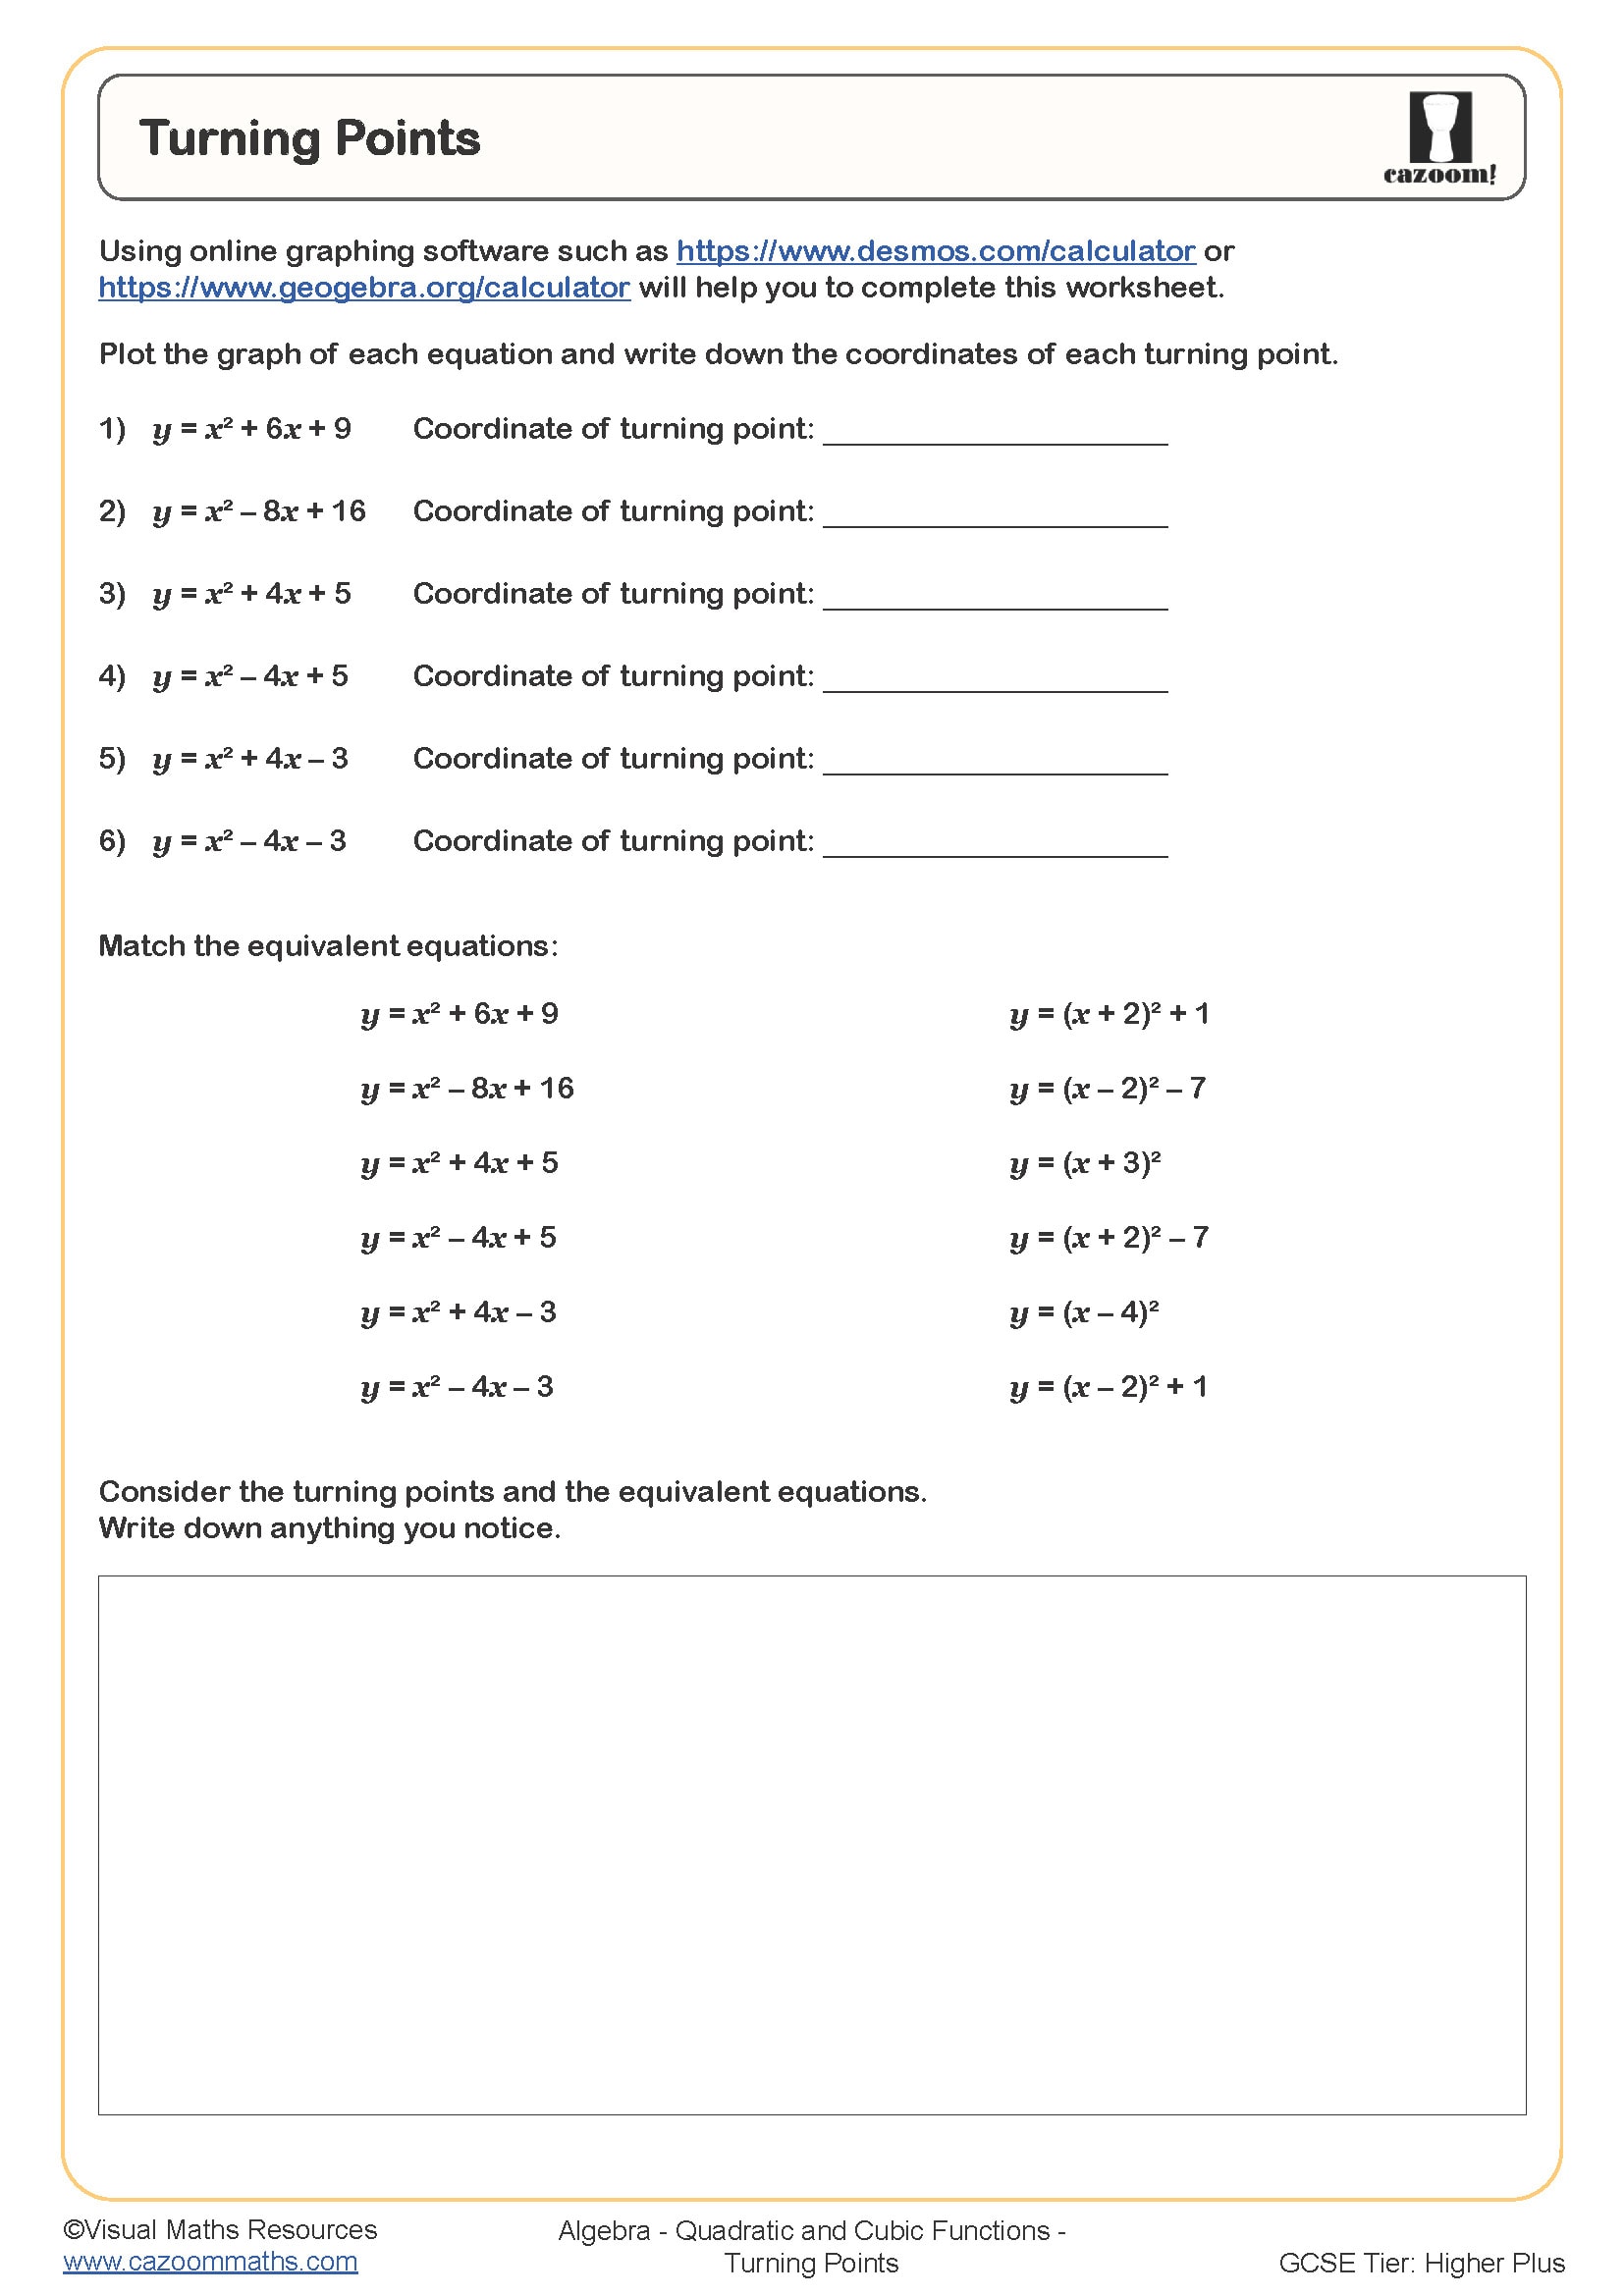
Turning Points
All worksheets are created by the team of experienced teachers at Cazoom Maths.
What Are Non-Linear Functions in Maths?
Non-linear functions are relationships where the rate of change between variables is not constant, producing curved rather than straight-line graphs. At KS4, students encounter quadratics (y = x²), cubics (y = x³), reciprocals (y = 1/x), exponentials (y = 2ˣ), and circle equations, each with distinctive graph shapes and properties. The National Curriculum expects students to recognise these families of curves, sketch their graphs, and identify key features such as turning points, asymptotes, and intercepts.
A typical misconception occurs when students try to plot non-linear graphs by calculating just two points, as they would for linear functions, resulting in incorrect straight lines. Exam mark schemes regularly penalise candidates who fail to show the characteristic shape of quadratic curves or who ignore asymptotic behaviour in reciprocal graphs. Students need repeated exposure to different non-linear forms to develop visual recognition and understand why plotting multiple coordinate pairs is necessary for accurate curve sketching.
Which Year Groups Study Non-Linear Functions?
These worksheets cover non-linear functions for Year 10 and Year 11 students following the KS4 curriculum. The topic typically begins in Year 10 with quadratic functions, gradually introducing cubic, reciprocal, and exponential graphs as students progress towards their GCSEs. This content appears across both Foundation and Higher tiers, though Higher tier students encounter more complex transformations and combined function problems.
Progression through Year 10 and Year 11 involves increasing sophistication in graph work. Early worksheets focus on plotting from tables of values and recognising basic curve shapes, whilst later materials expect students to sketch curves from equations alone, apply transformations, and solve problems involving intersection points. By Year 11, students should interpret non-linear graphs in context, such as understanding velocity-time graphs with curved sections or analysing compound interest through exponential functions, skills that appear regularly in GCSE exam papers.
How Do You Recognise Different Types of Non-Linear Graphs?
Each family of non-linear functions produces a distinctive graph shape that students learn to identify. Quadratics create U-shaped or n-shaped parabolas, cubics have an S-shaped curve with one turning point (or none for y = x³), reciprocals form two separate curves with asymptotes at the axes, and exponentials show rapid growth or decay with a horizontal asymptote. Recognising these patterns allows students to match equations to graphs and predict behaviour without detailed plotting.
These graph types appear throughout STEM fields, making recognition skills genuinely useful beyond examinations. Engineers use quadratic functions to model projectile motion and structural forces, whilst exponential functions describe radioactive decay in physics, bacterial growth in biology, and investment returns in economics. Medical researchers analyse drug concentration curves that often follow exponential decay, whilst climate scientists model carbon dioxide levels using non-linear growth patterns. Understanding how equation form dictates graph behaviour helps students interpret real data and make predictions across scientific disciplines.
How Can These Worksheets Support GCSE Preparation?
The worksheets build skills systematically, starting with completing tables of values for different function types before progressing to curve sketching, identifying key features, and solving graphical problems. Many worksheets include worked examples that demonstrate how to approach unfamiliar non-linear graphs, whilst answer sheets allow students to check their graph shapes and coordinate accuracy independently. This scaffolded approach helps students develop confidence with each function family before tackling mixed questions.
Teachers use these resources flexibly across different classroom settings. They work well for targeted intervention with students who struggle to distinguish between function types, as homework to reinforce classwork on specific curves, or as revision material before mock exams. Paired work activities where one student generates coordinates whilst their partner plots them can help identify calculation errors early. The answer sheets prove particularly valuable during independent revision periods when students need immediate feedback without waiting for teacher marking, allowing them to identify and correct misconceptions about asymptotic behaviour or turning points promptly.