Pie Charts Worksheets
All worksheets are created by the team of experienced teachers at Cazoom Maths.
Finding Statistics Hard? See How Our Printable KS3-KS4 Maths Activities Break It Down
Download our printable PDF pie charts, bar charts, and line graphs worksheets with answers right now! These statistical questions will give your pupils the resources they need to interpret data correctly with confidence. Our worksheets are well-structured and carefully designed by our maths experts to support step-by-step learning. Your children will be able to practise a variety of topics like—Completing Tables from Pie Charts, Criticising Graphs and Charts, Drawing Bar Charts from Frequency Tables, and much more. Therefore, these resources are perfect for teachers, tutors, and parents supporting KS3 and GCSE learners.
Maths Skills You'll Cover Using Cazoom Maths Pie Chart Resources
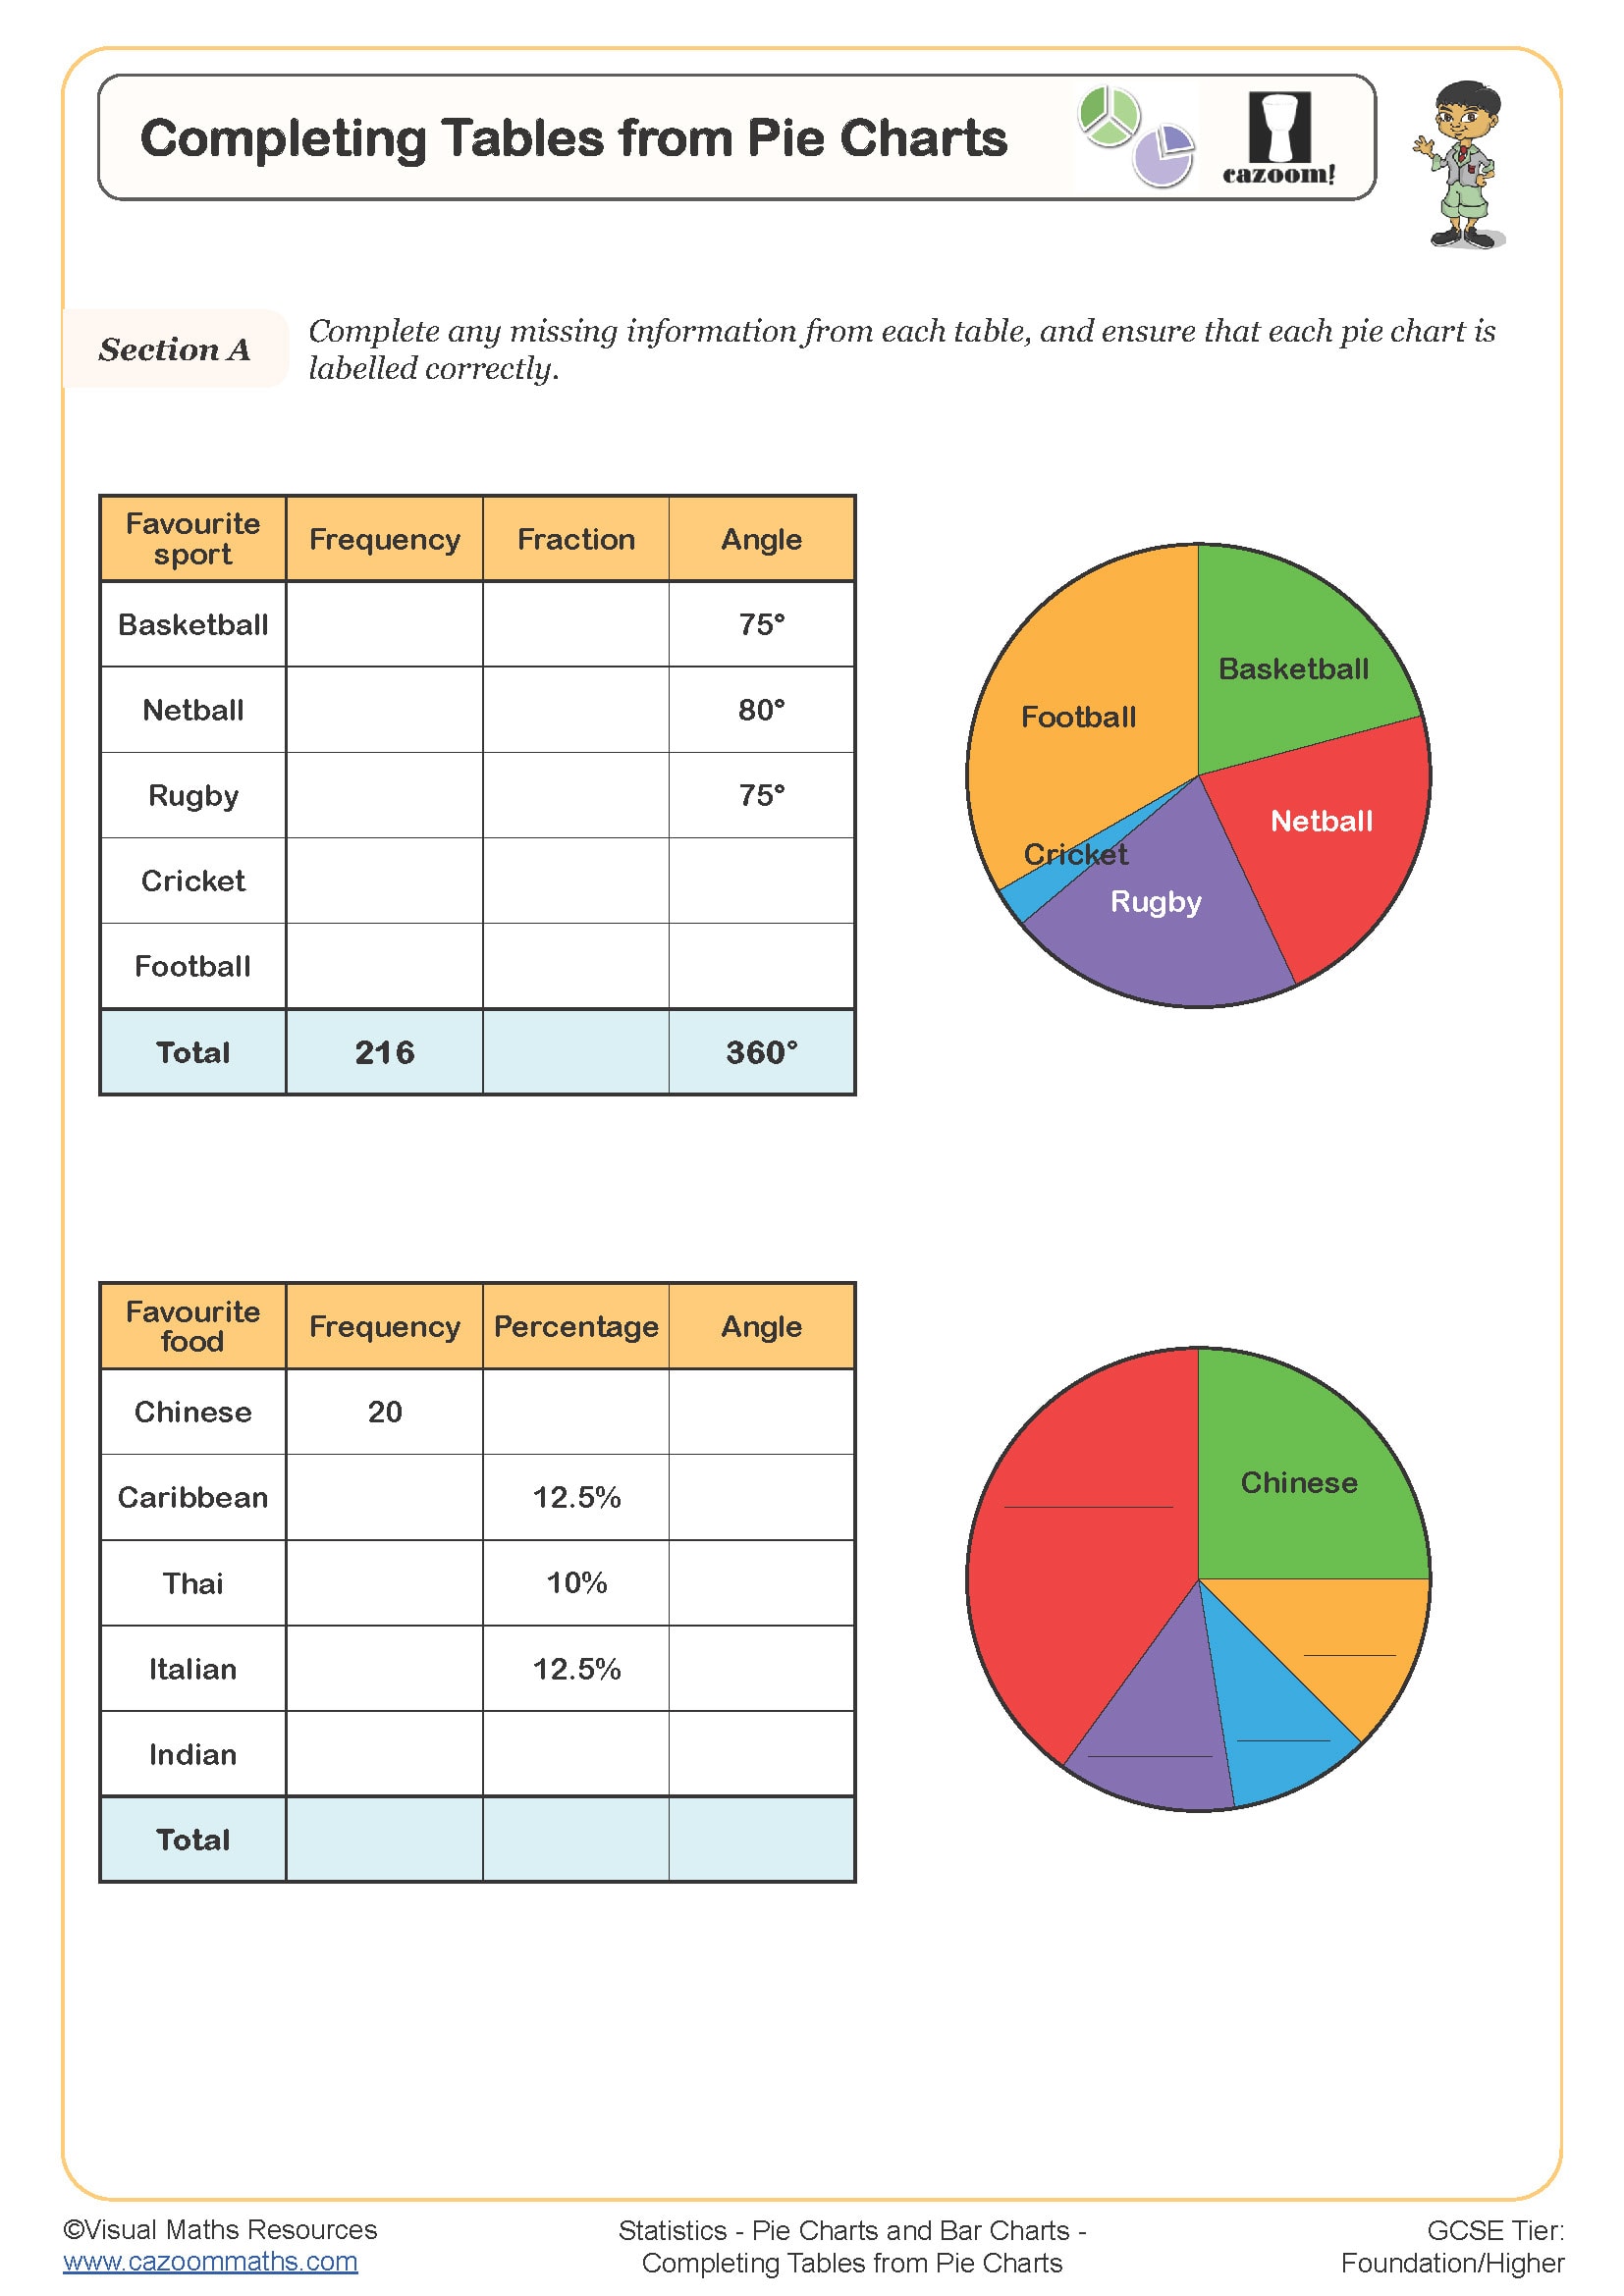
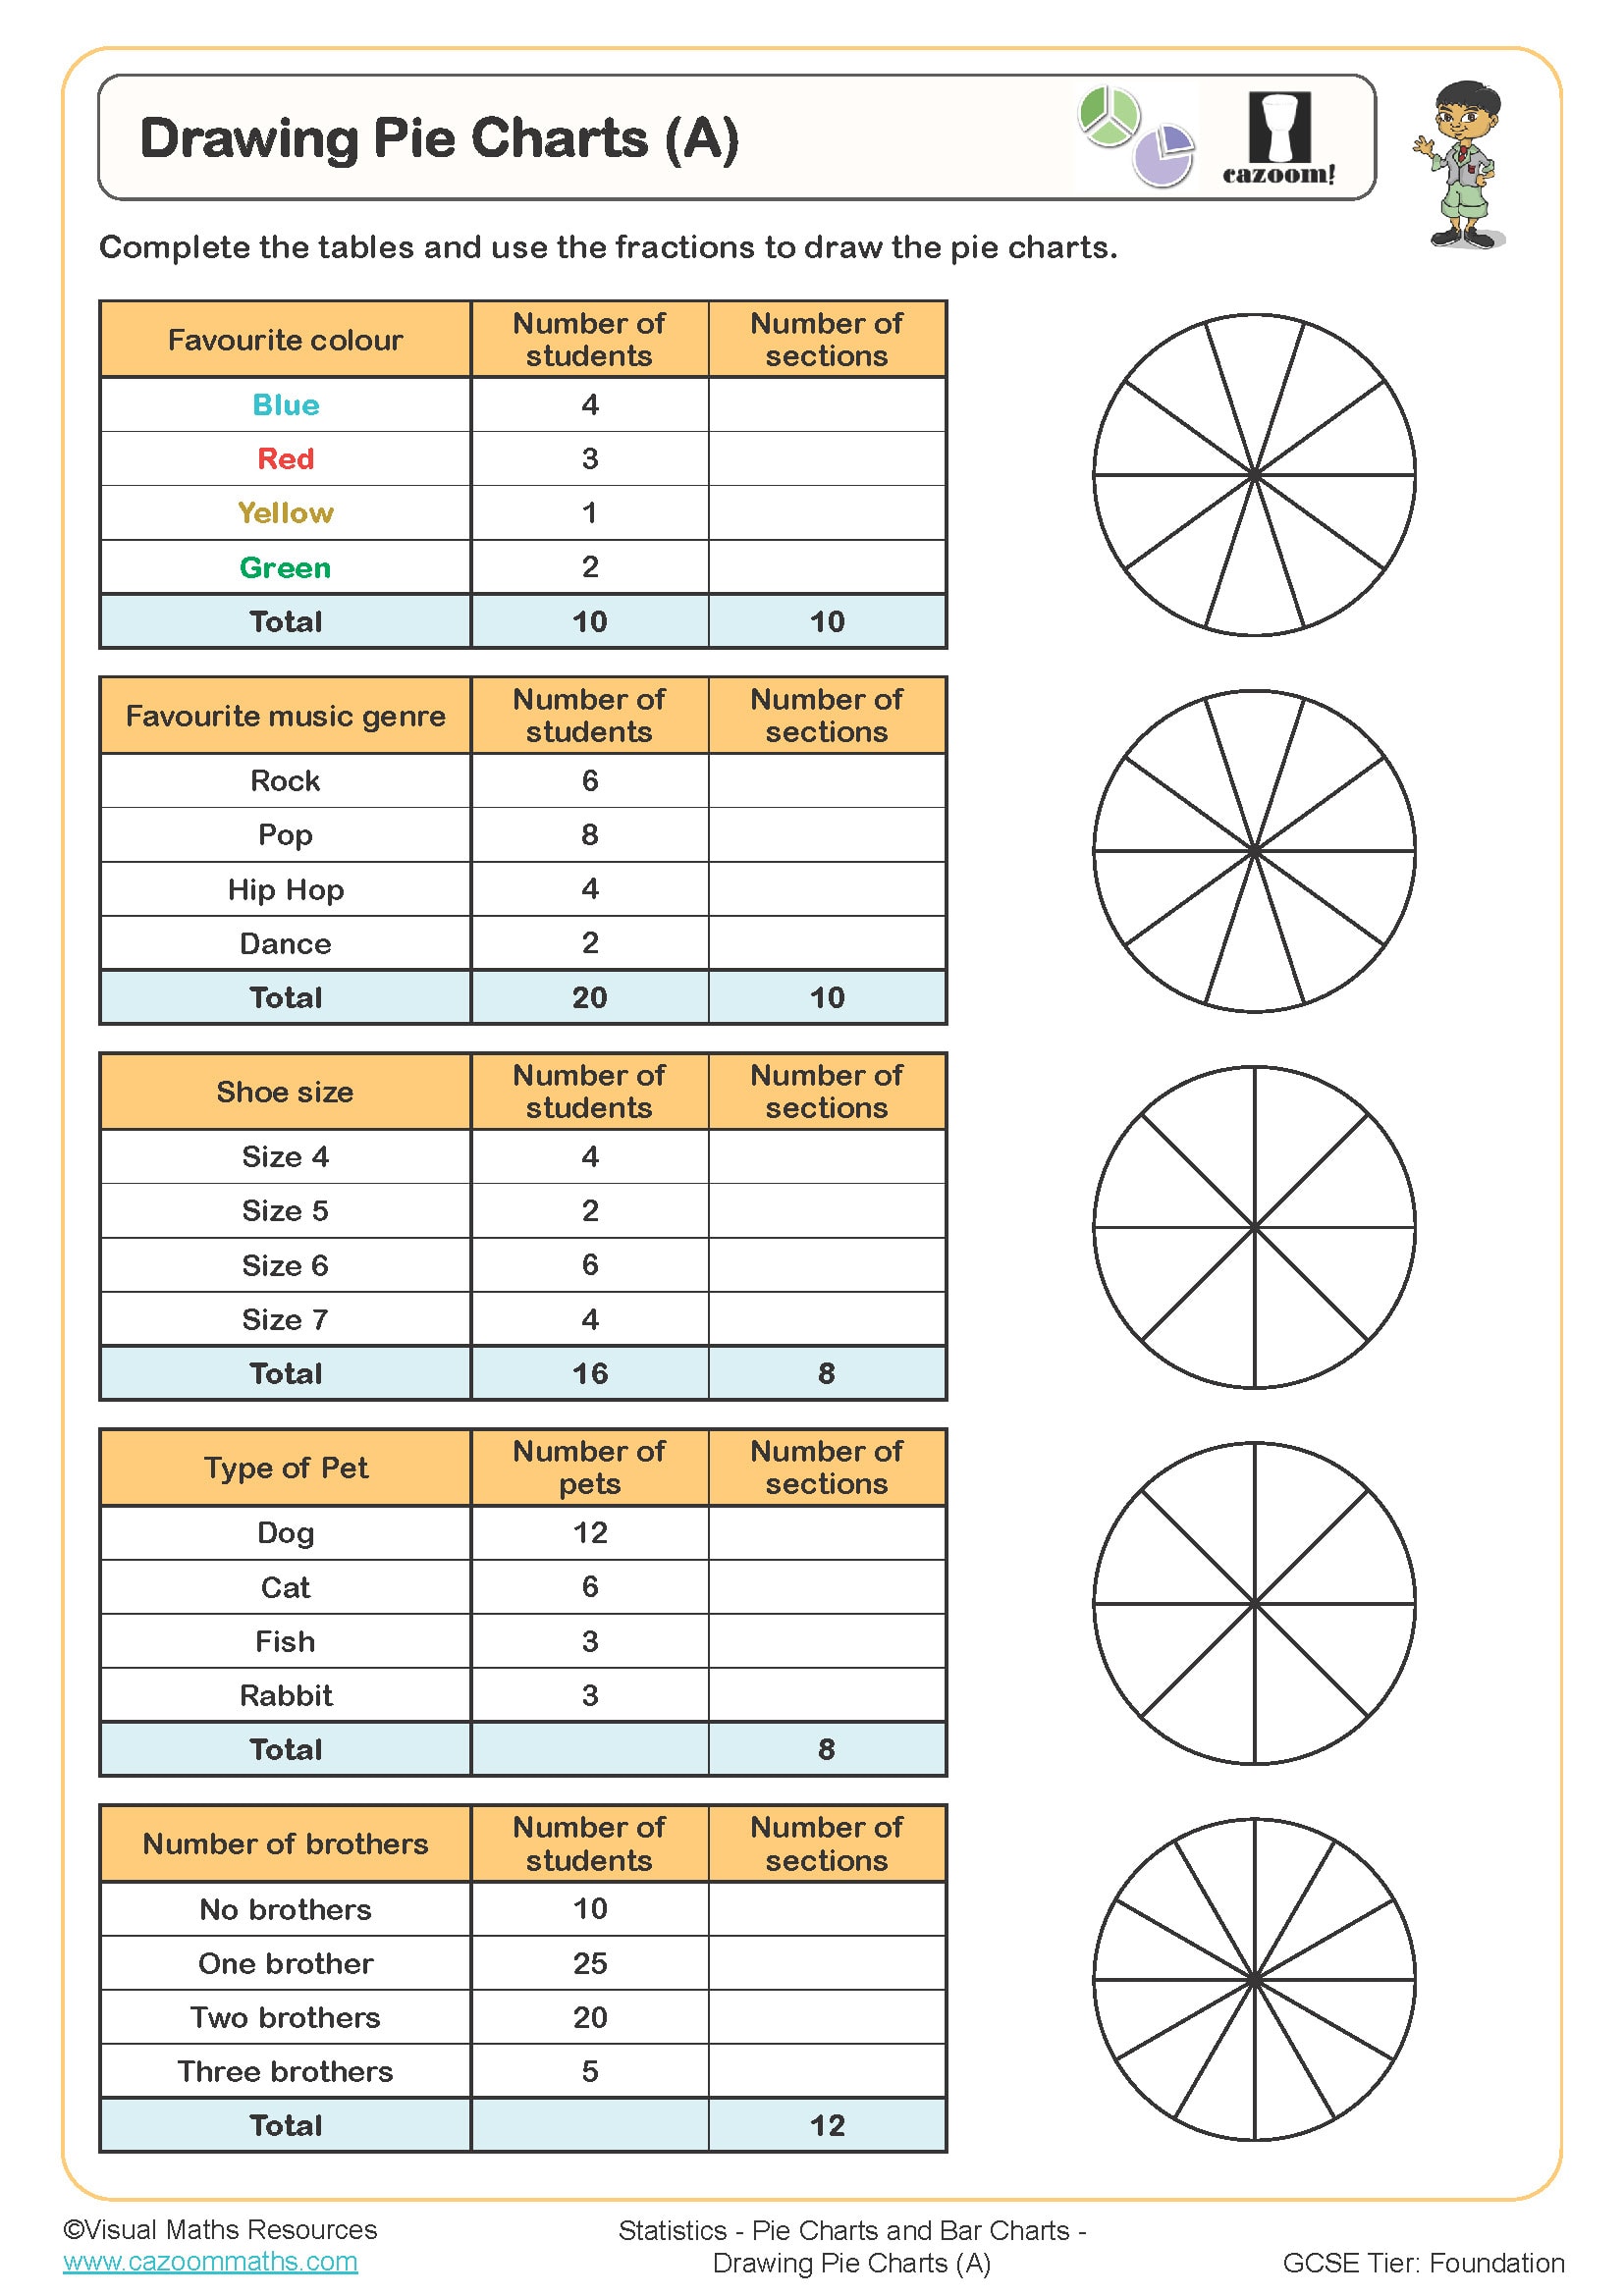
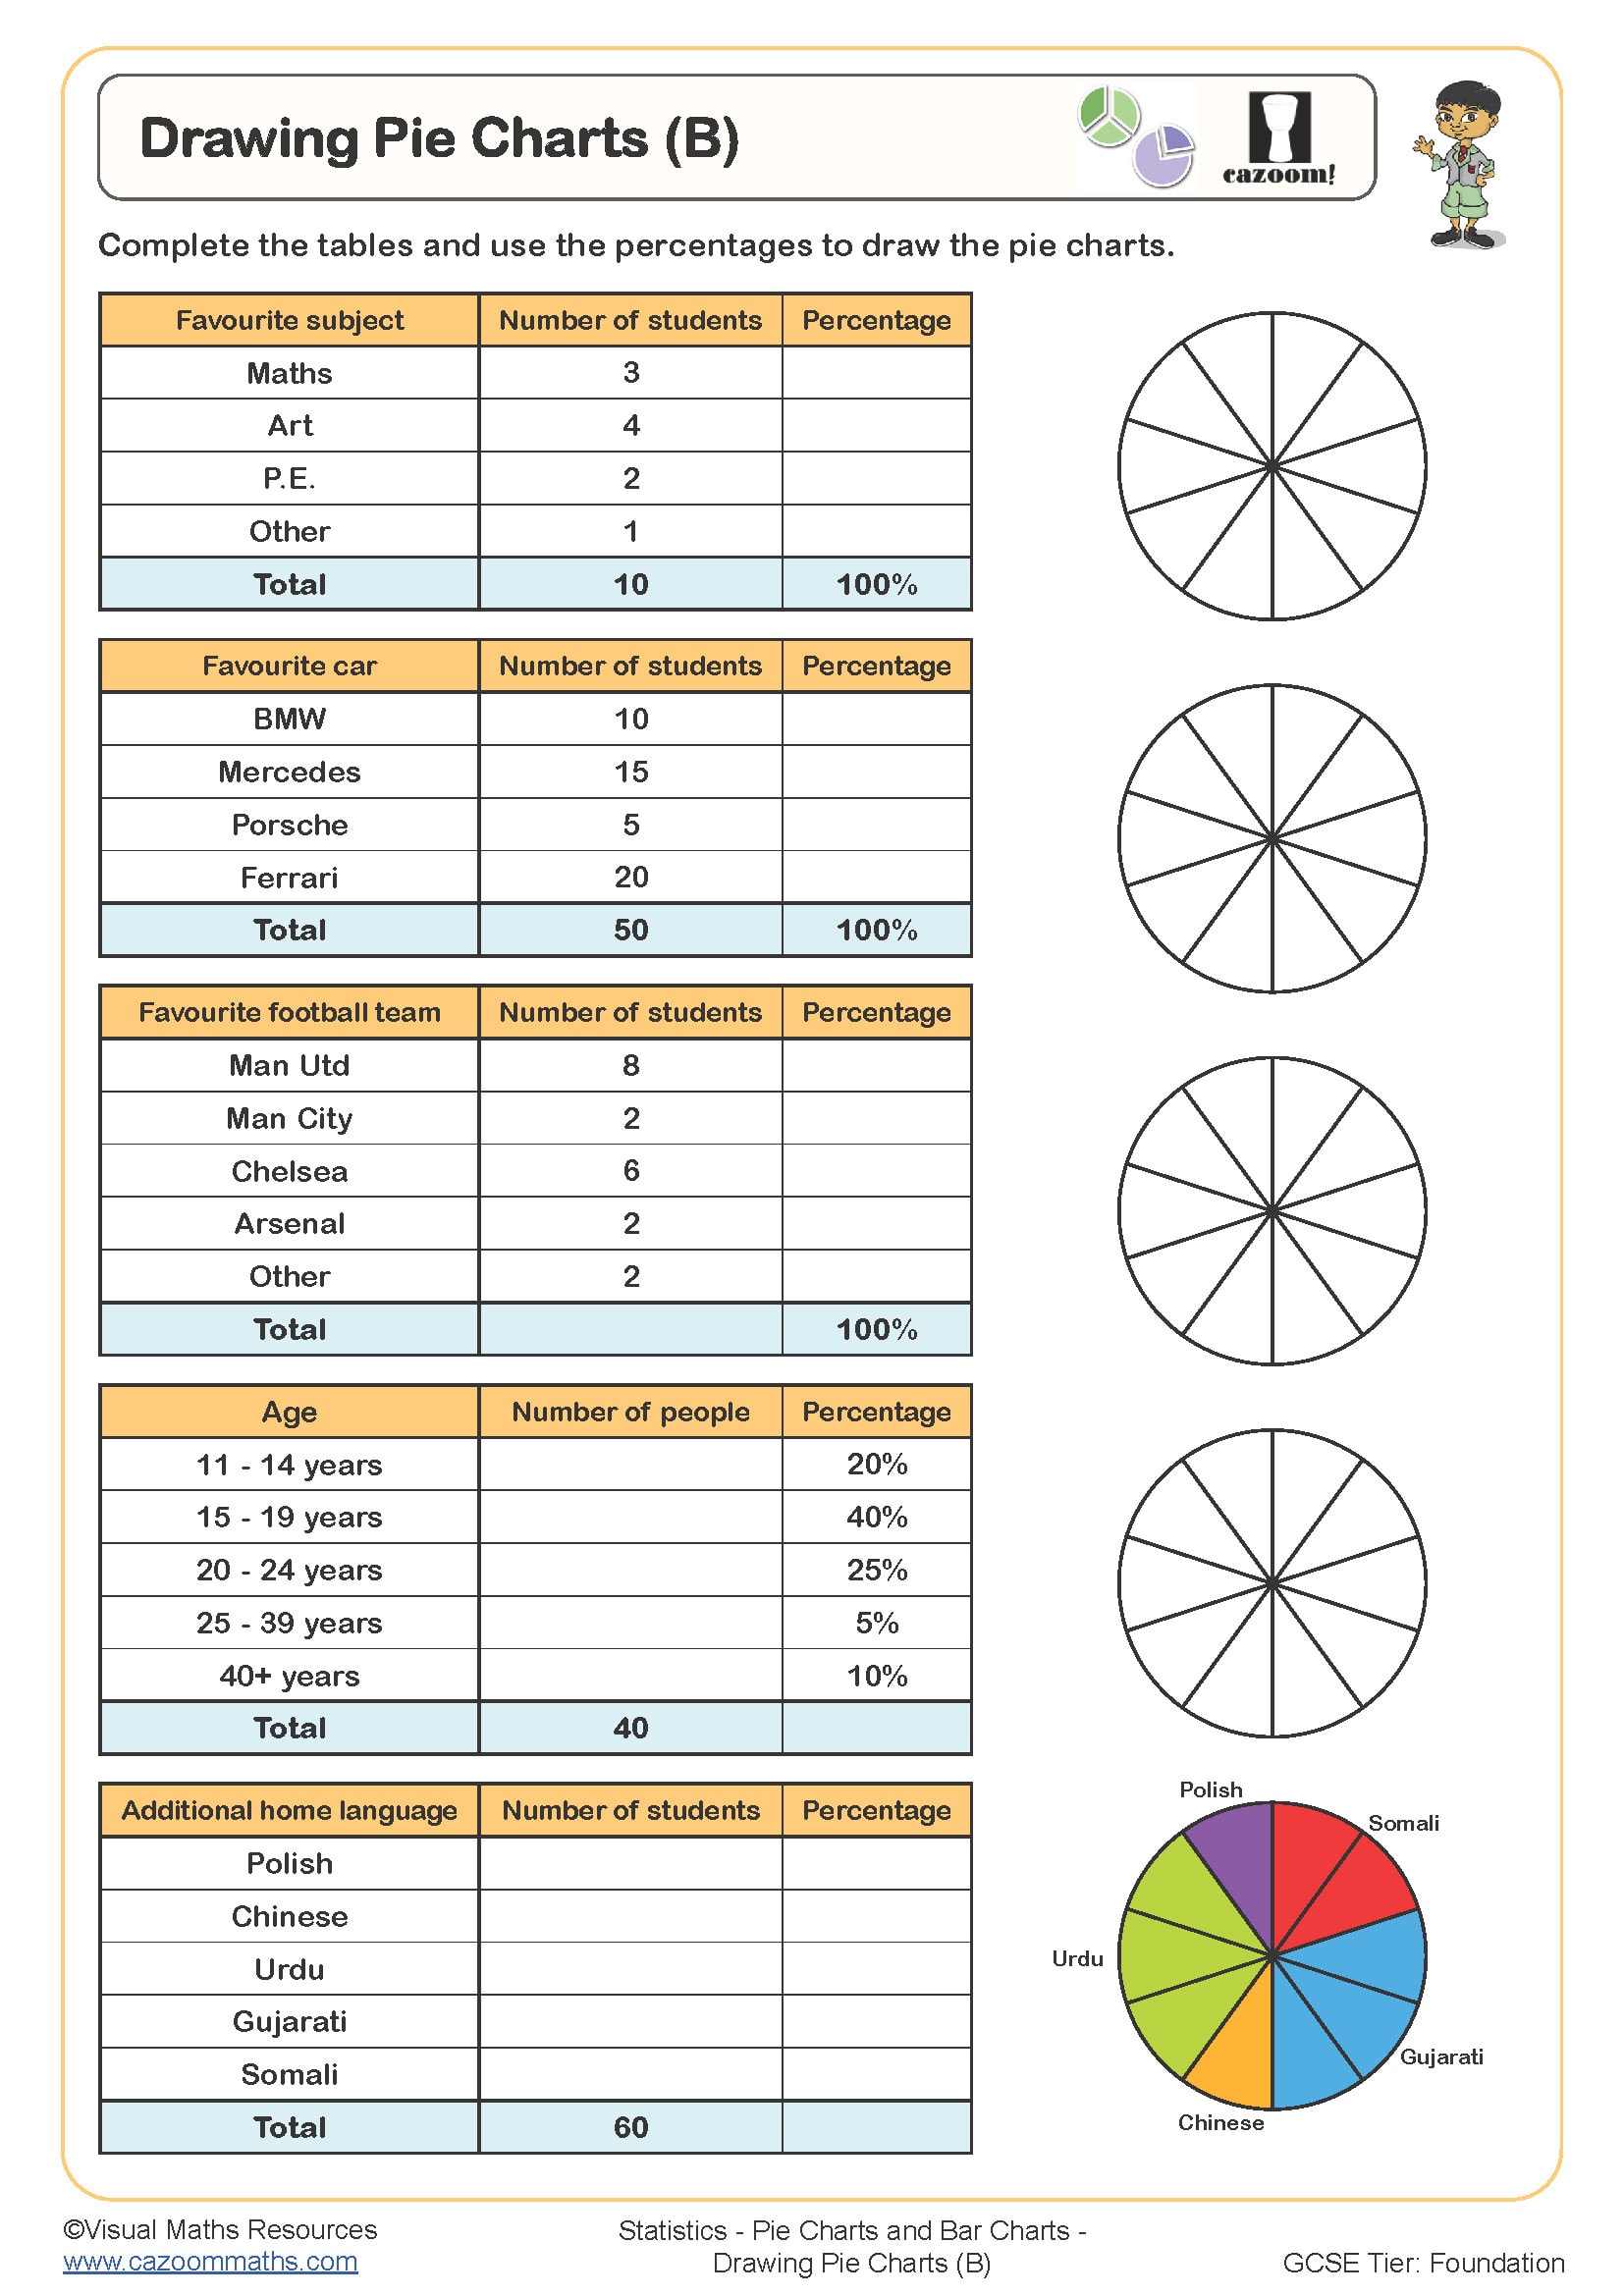
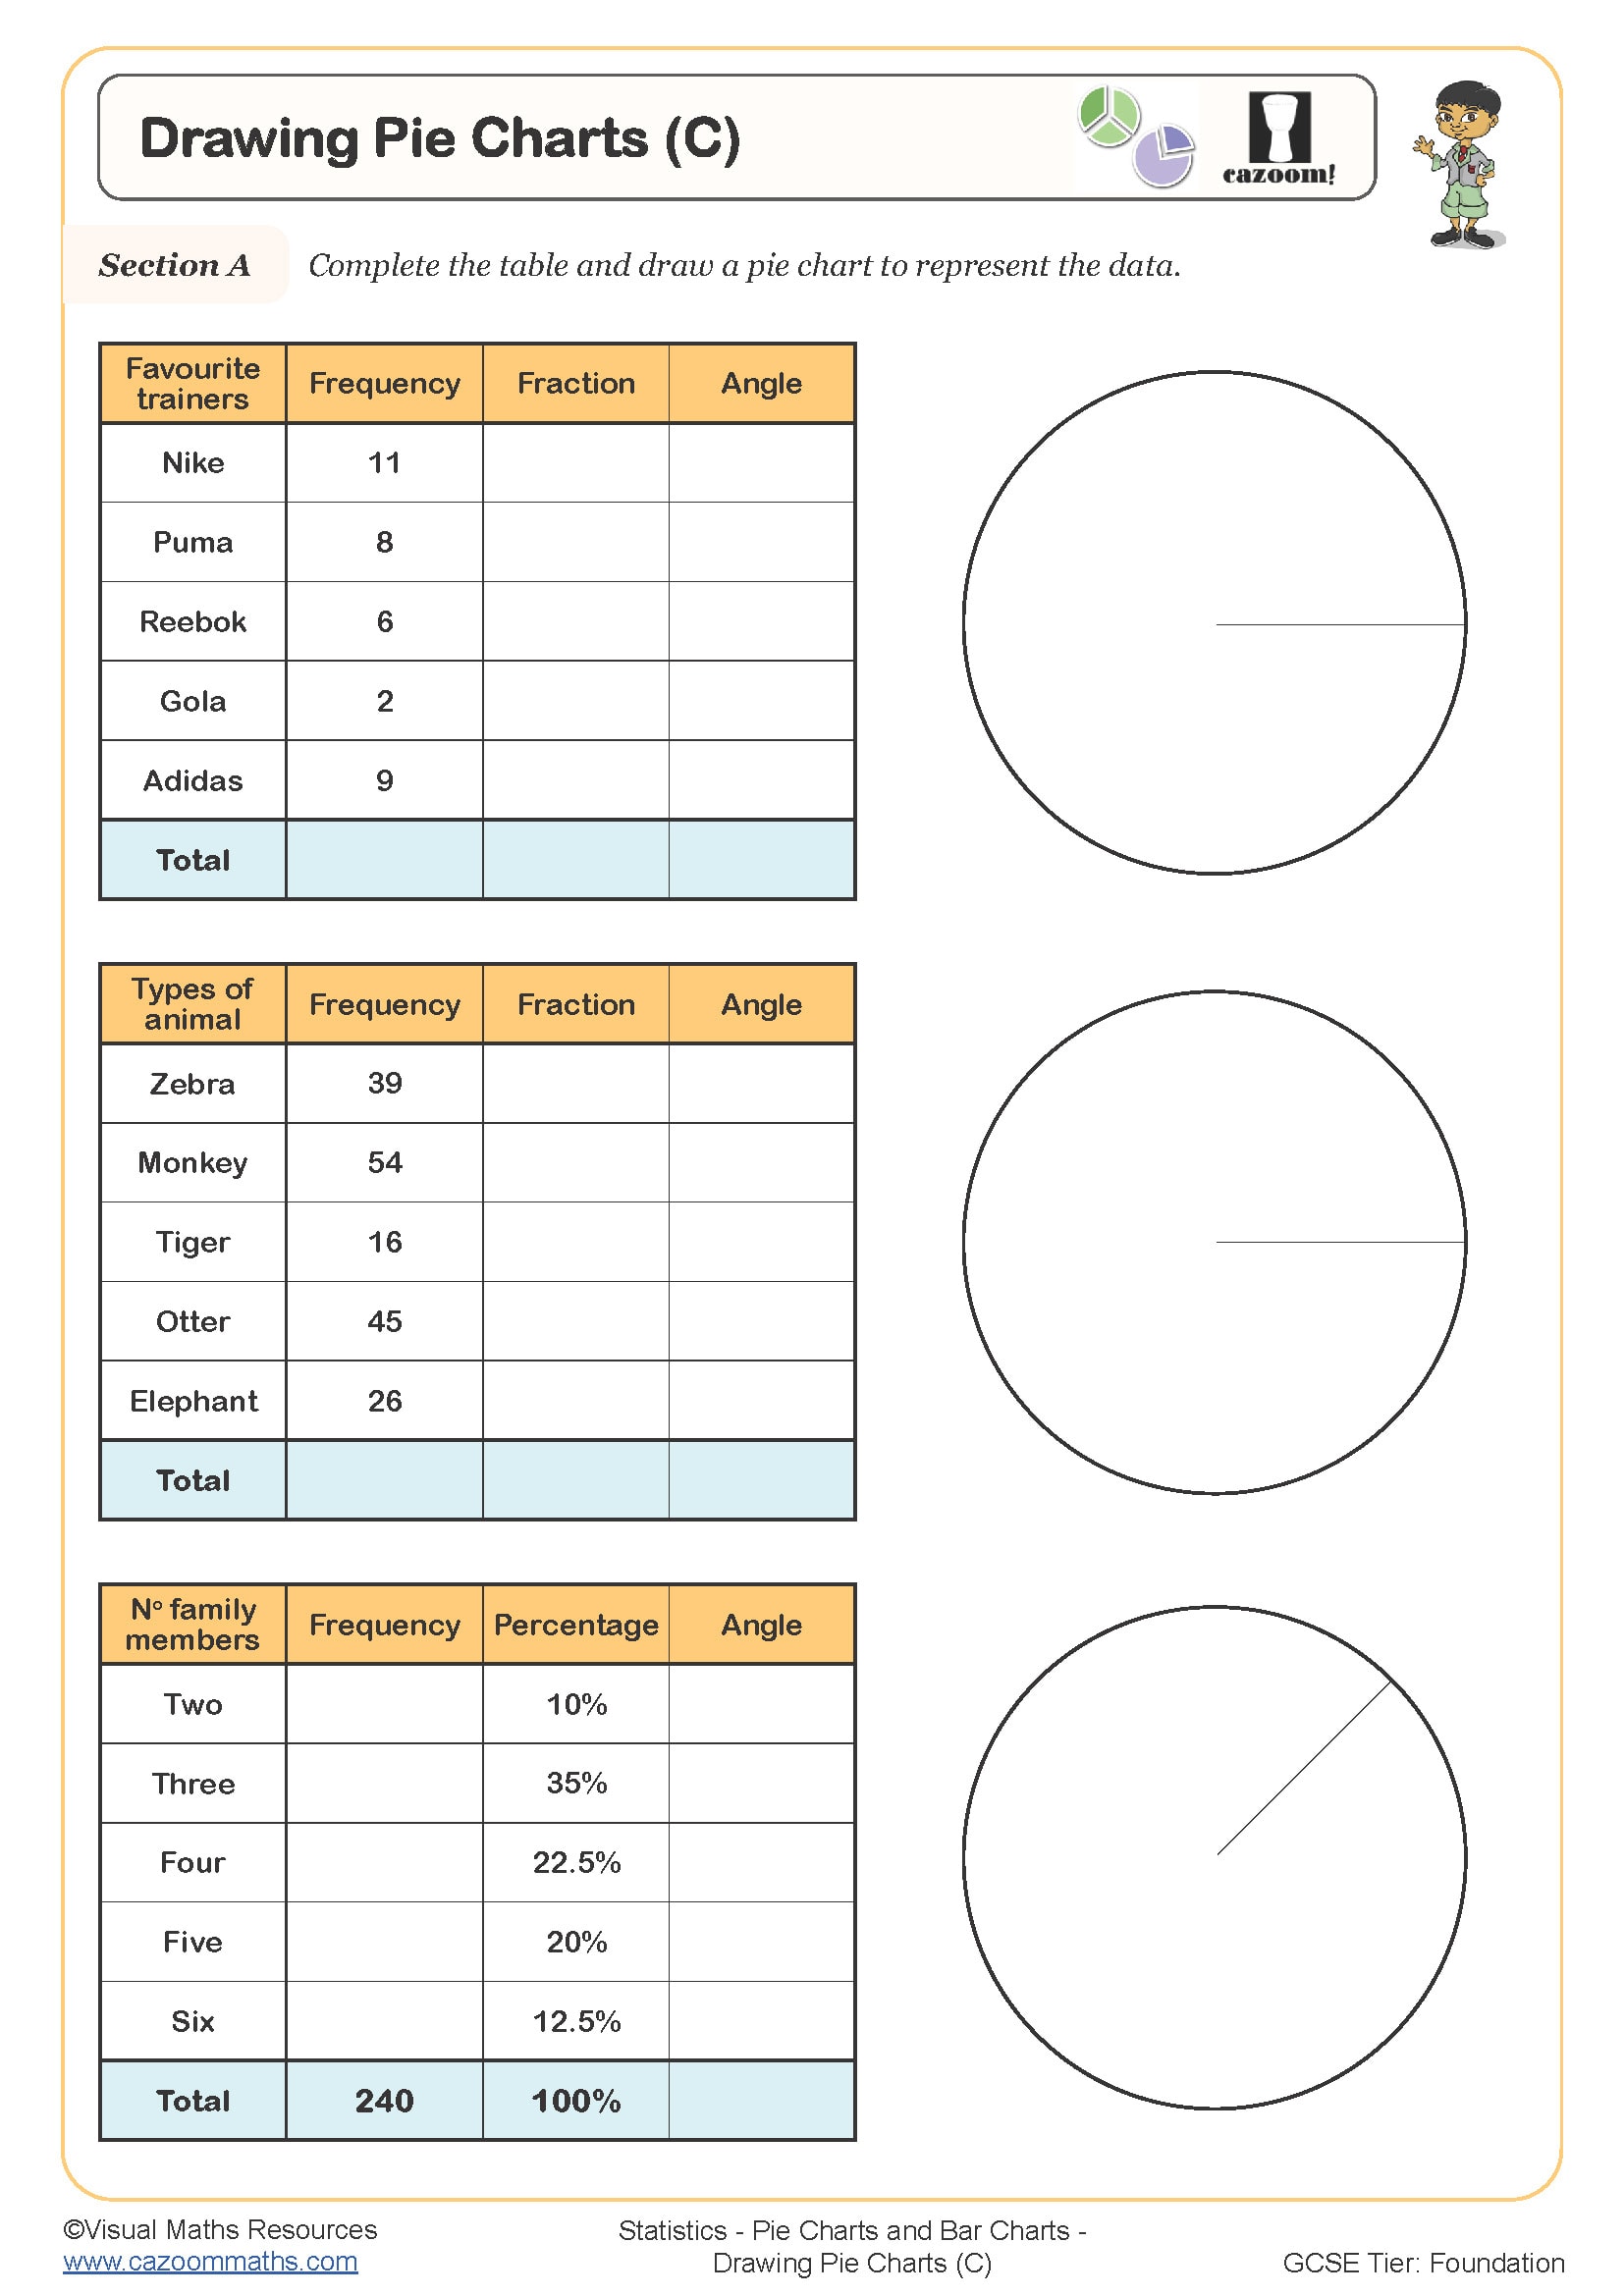
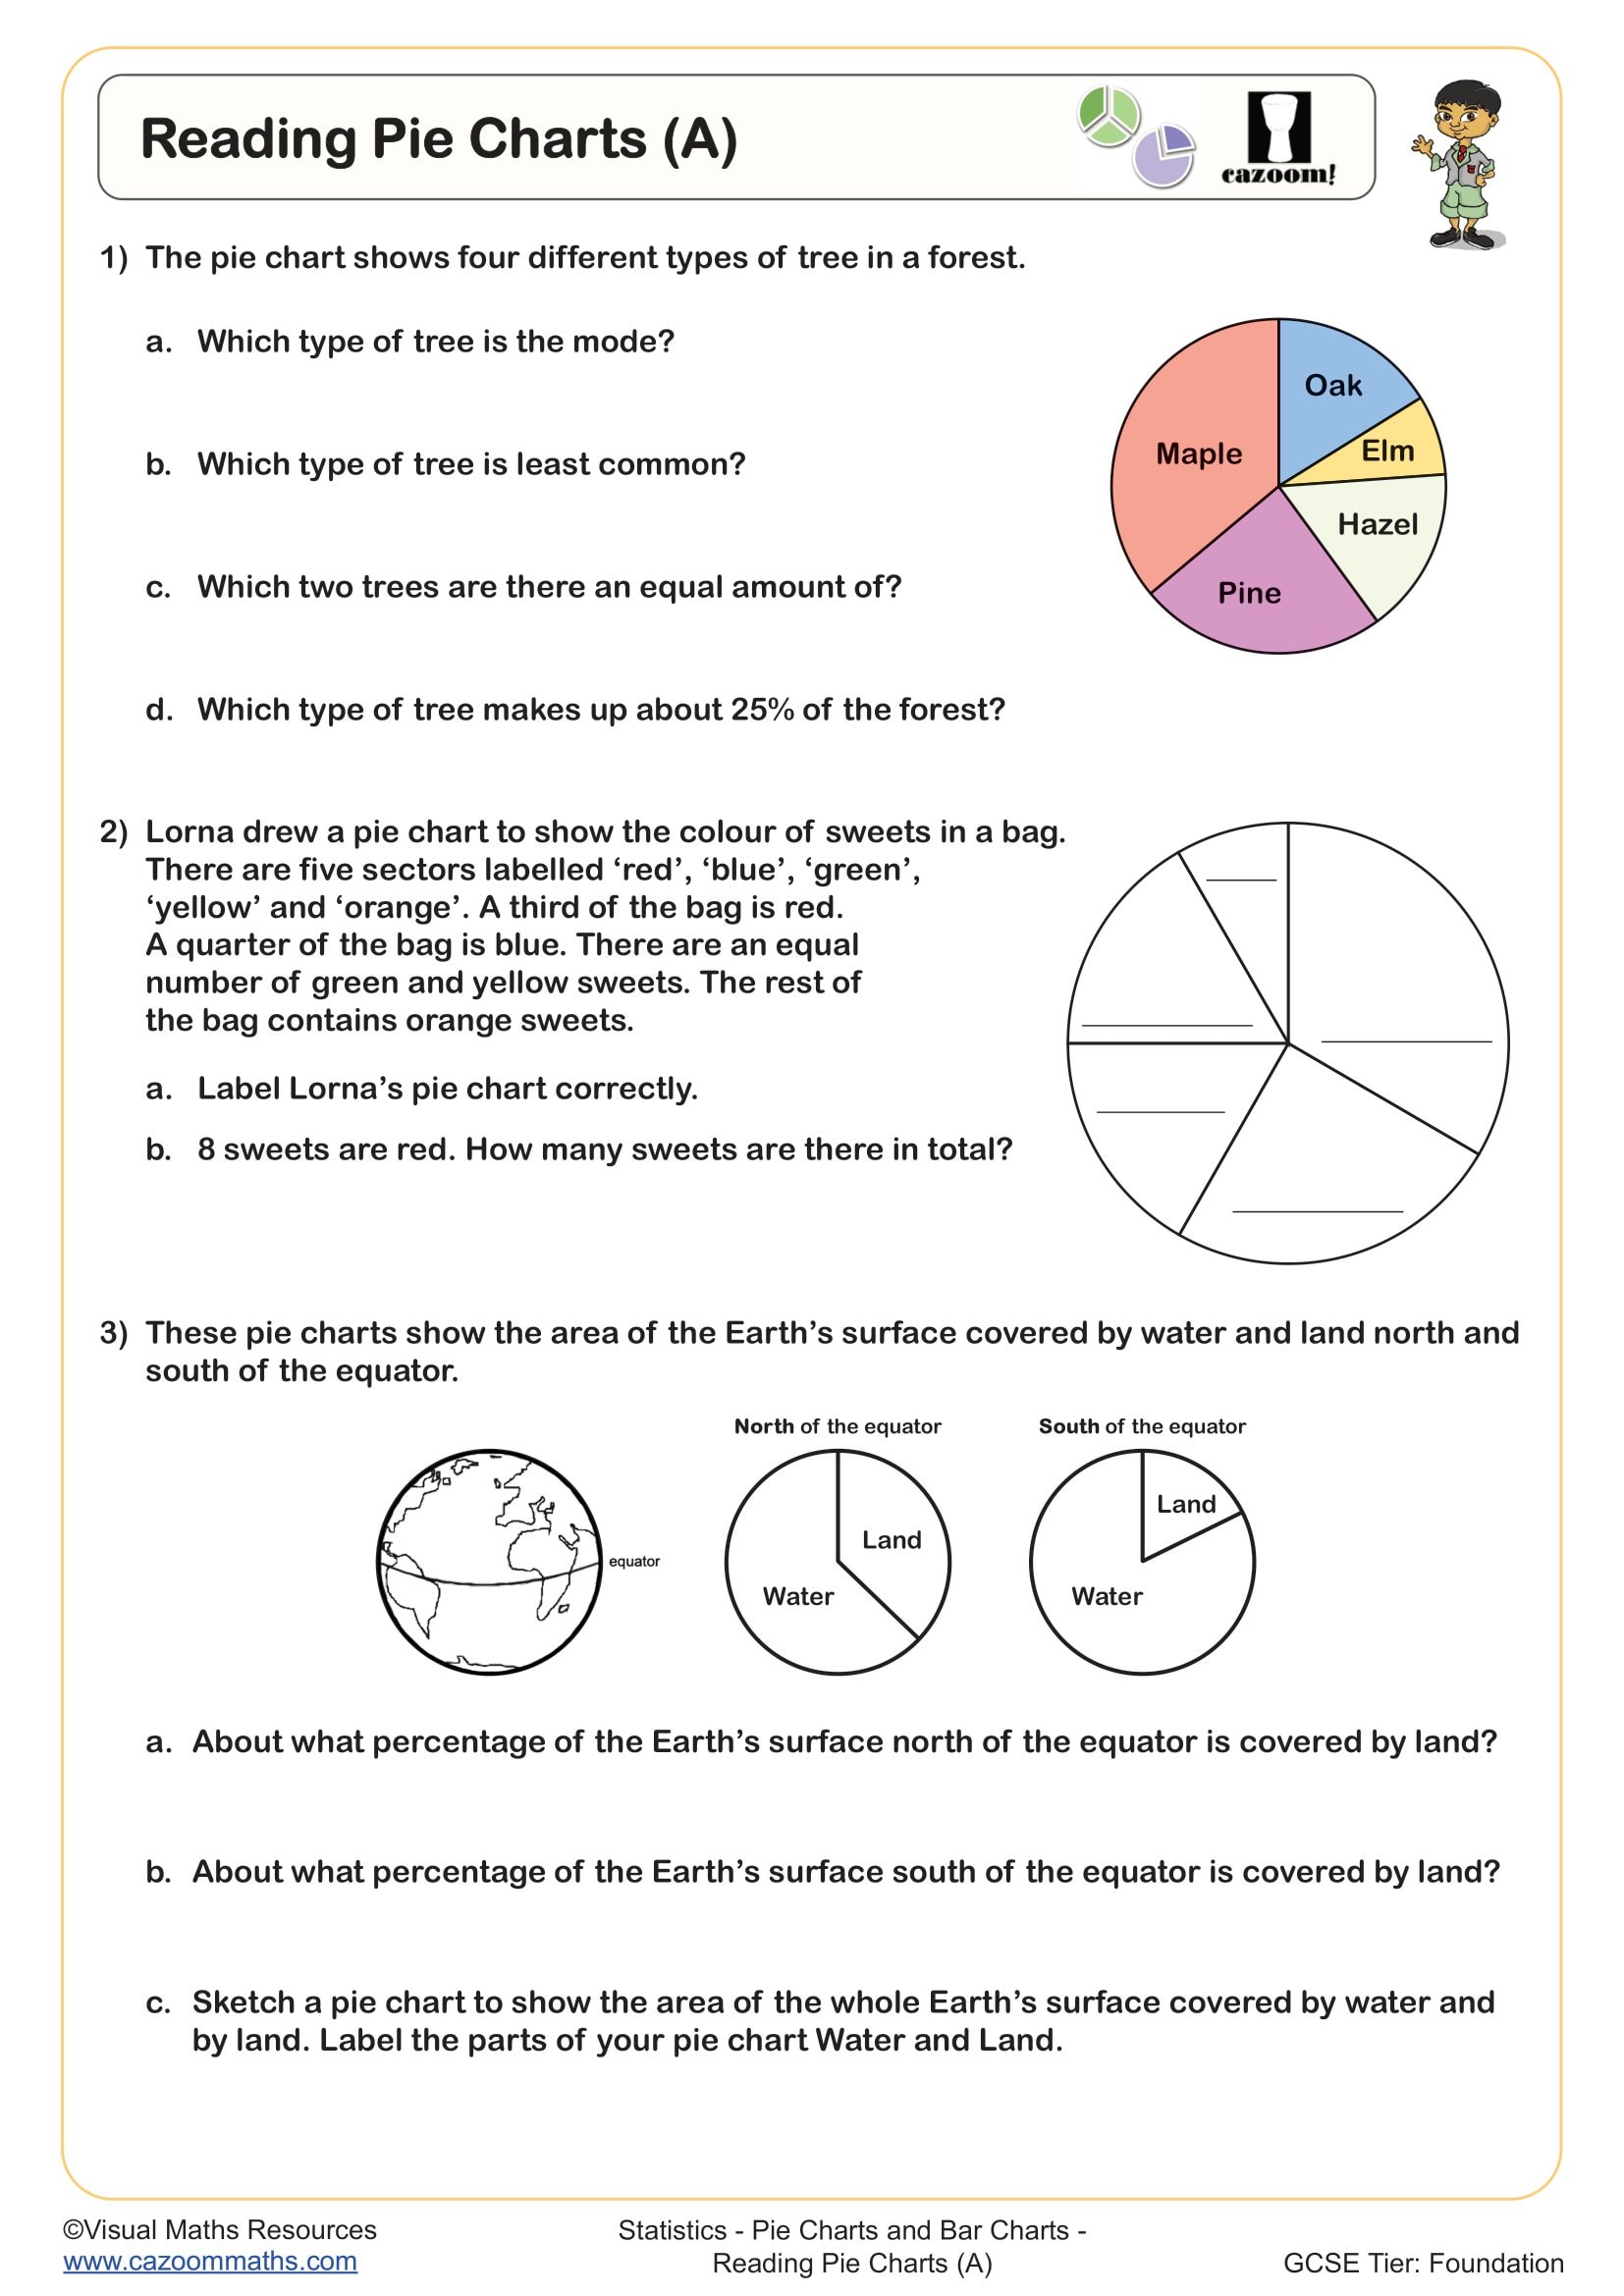
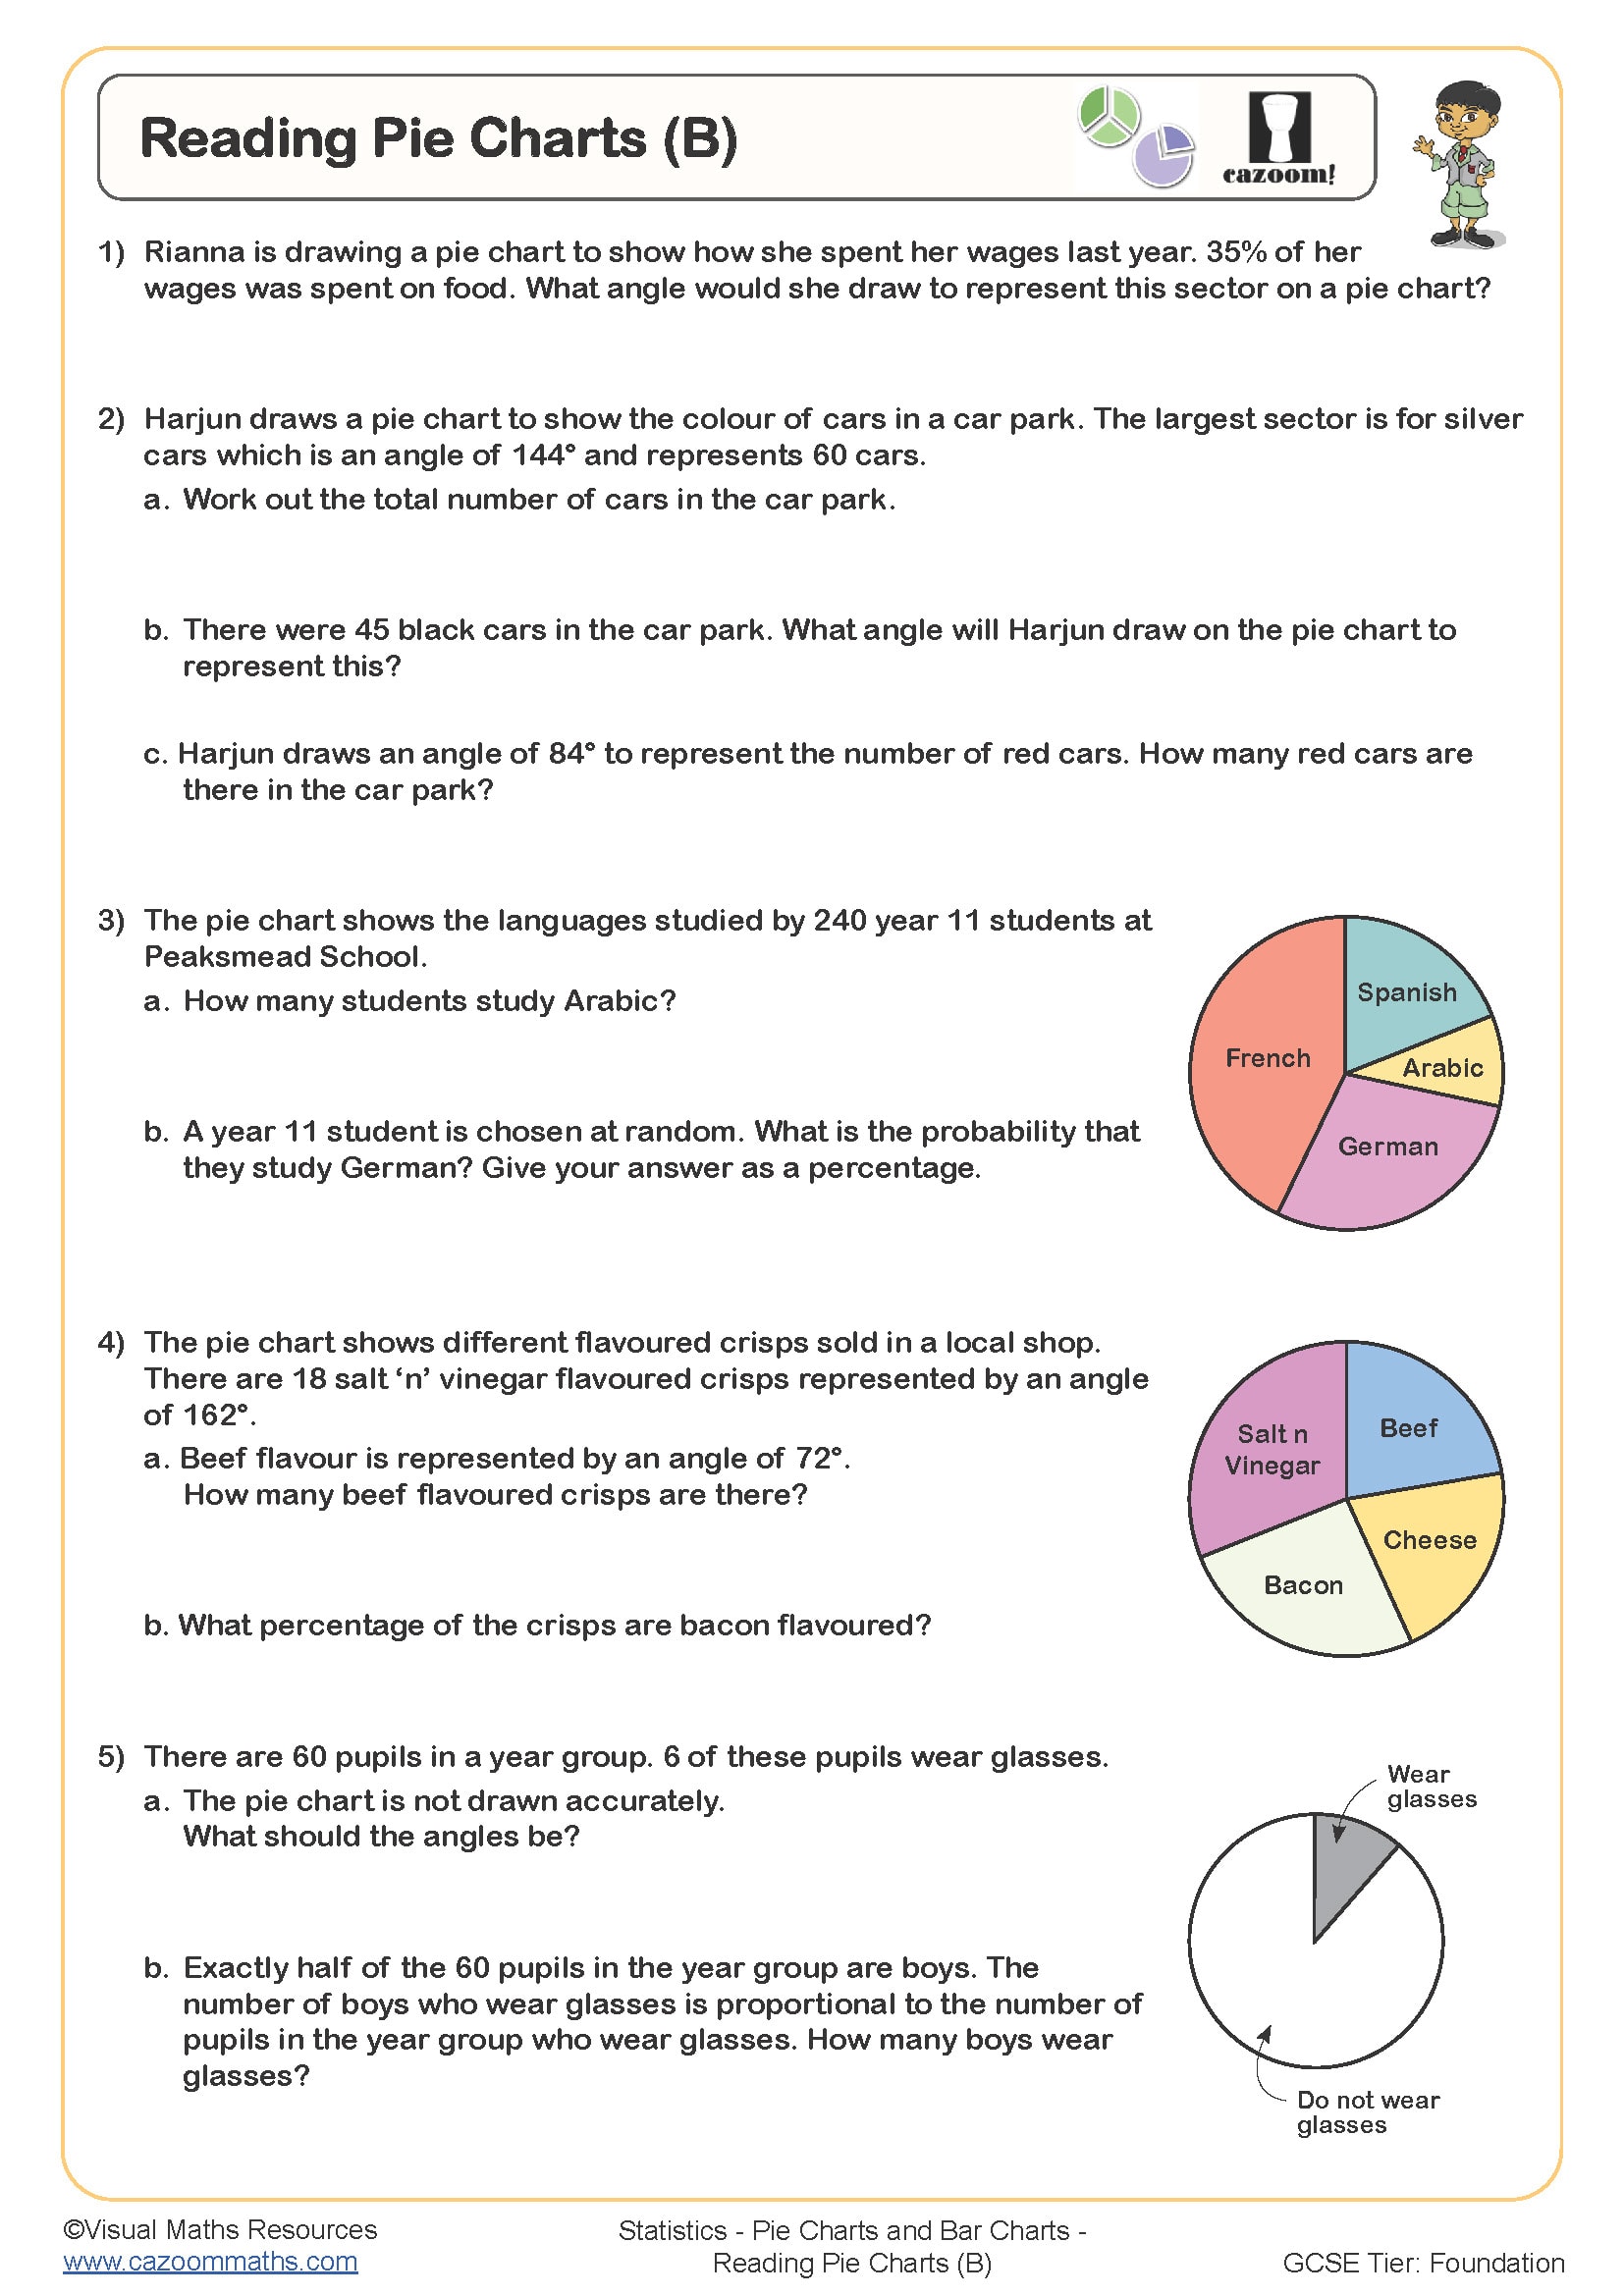
What is a pie chart?
A pie chart uses a circular design to display data as slices, each representing the percentage of the complete data set for a different category. The size of each slice segment indicates the relative size of its corresponding data category.
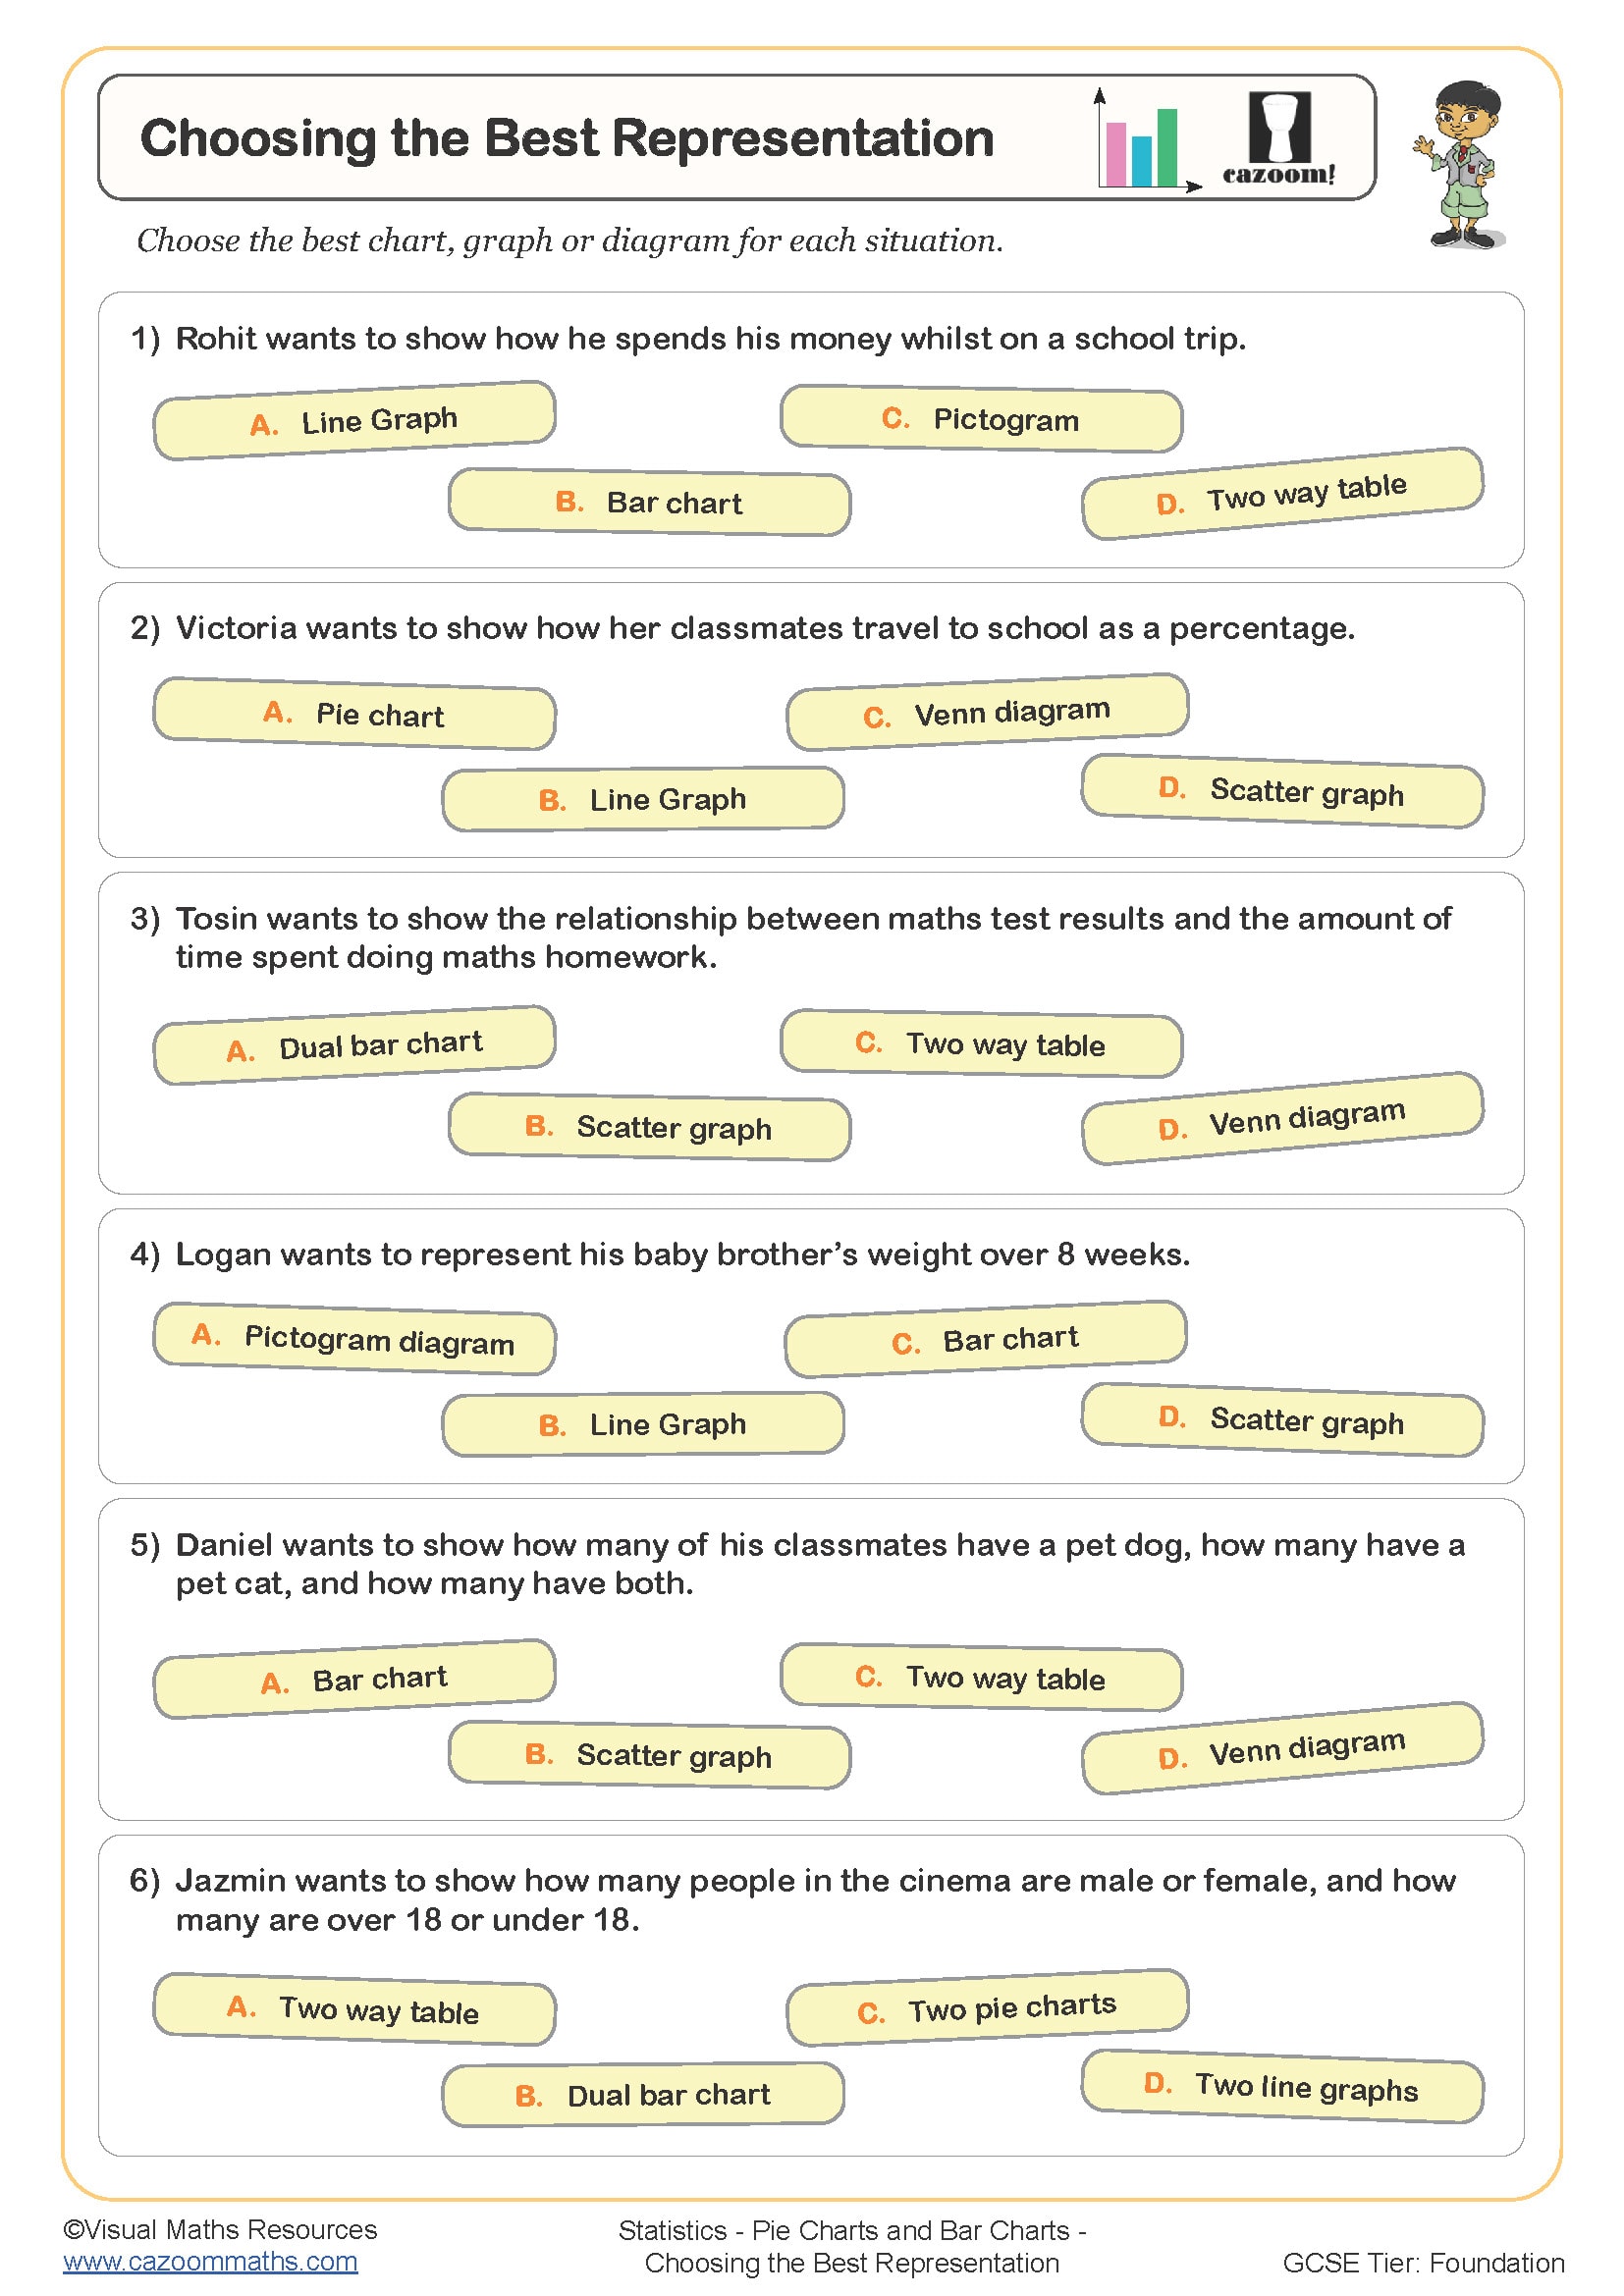
The collection helps students develop statistical skills through a gradual process, starting with interpreting provided data in charts and ending with creating complex visualizations from basic information. The analysis of Pie Charts shows how angle measurements directly match the frequency values. Converting data to degrees using systematic calculation methods enables users to create Pie Charts. Users can retrieve their original data values through the Pie Chart's proportional interpretation. The Pie Chart Problems section presents students with tasks that require them to work with incomplete information and to perform comparisons. The Advanced Pie Charts section shows students how to work with fractional sections and percentage markings. The Mixed Data Representation section teaches students to link pie charts with other statistical visualization methods for selecting suitable representation types.
Attention Parents: Improve Homework Success With Cazoom Maths Pie Chart Activities
Our expert-designed worksheet structure leads your secondary school students through separate stages of development. The visual examples show diagrams with angle calculations and sector annotations, allowing students to watch the solution process instead of looking at the final chart. Cazoom Maths statistics worksheets include pre-drawn circles and frequency tables to eliminate setup challenges so students can concentrate on calculating angles and drawing accurately. The teaching materials allow natural differentiation because students will require different amounts of time with scaffolded sheets before they can handle comparison tasks that include multiple charts and missing data problems. The instant solution feature enables students to evaluate their work through peer review and self-assessment because it shows the exact point where their method failed during the division stage, angle measurement, or protractor application.
The Real-World Maths That Starts With Statistics Worksheets
Pie charts appear in many everyday and real-world situations.
•Weather reports display uses pie charts to present proportional information.
•Sports summaries evaluate performance categories through Pie Charts
•The visual presentation of survey results uses percentage data effectively.
•Students will be able to read data in academic assessments