Year 7 Scatter Graphs Worksheets
All worksheets are created by the team of experienced teachers at Cazoom Maths.
How Do Year 7 Scatter Graphs Worksheets Help Students Progress?
Moving from simple bar charts and line graphs, Year 7 students encounter scatter graphs as their first tool for exploring relationships between two variables. This critical transition develops visual literacy alongside mathematical reasoning, helping learners recognise when data points suggest connections or independence. Regular practice with varied contexts ensures students grasp both the mechanics of plotting and the deeper meaning of correlation patterns. The structured approach prevents the confusion that often arises when correlation concepts are rushed, allowing students to build understanding gradually through familiar, then abstract examples. Teachers report significant improvements in students' ability to interpret complex information when these foundational skills are solidly established early in KS3.
Specific learning benefits include:
• Strengthens coordinate plotting accuracy
• Develops pattern recognition in data
• Builds vocabulary around correlation types
• Enhances scientific investigation skills
• Improves graph interpretation abilities
• Connects maths to the geography fieldwork
• Supports cross-curricular data analysis
Key Reasons Year 7 Cazoom Maths Worksheets Improve Exam Performance
These worksheets scaffold learning from basic point plotting through to interpreting correlation strength, with answer keys demonstrating each step clearly. Students begin with familiar contexts before tackling more abstract relationships, ensuring conceptual understanding develops alongside procedural skills. The progression mirrors typical Year 7 schemes of work whilst providing flexibility for different ability levels.
The core skills covered include:
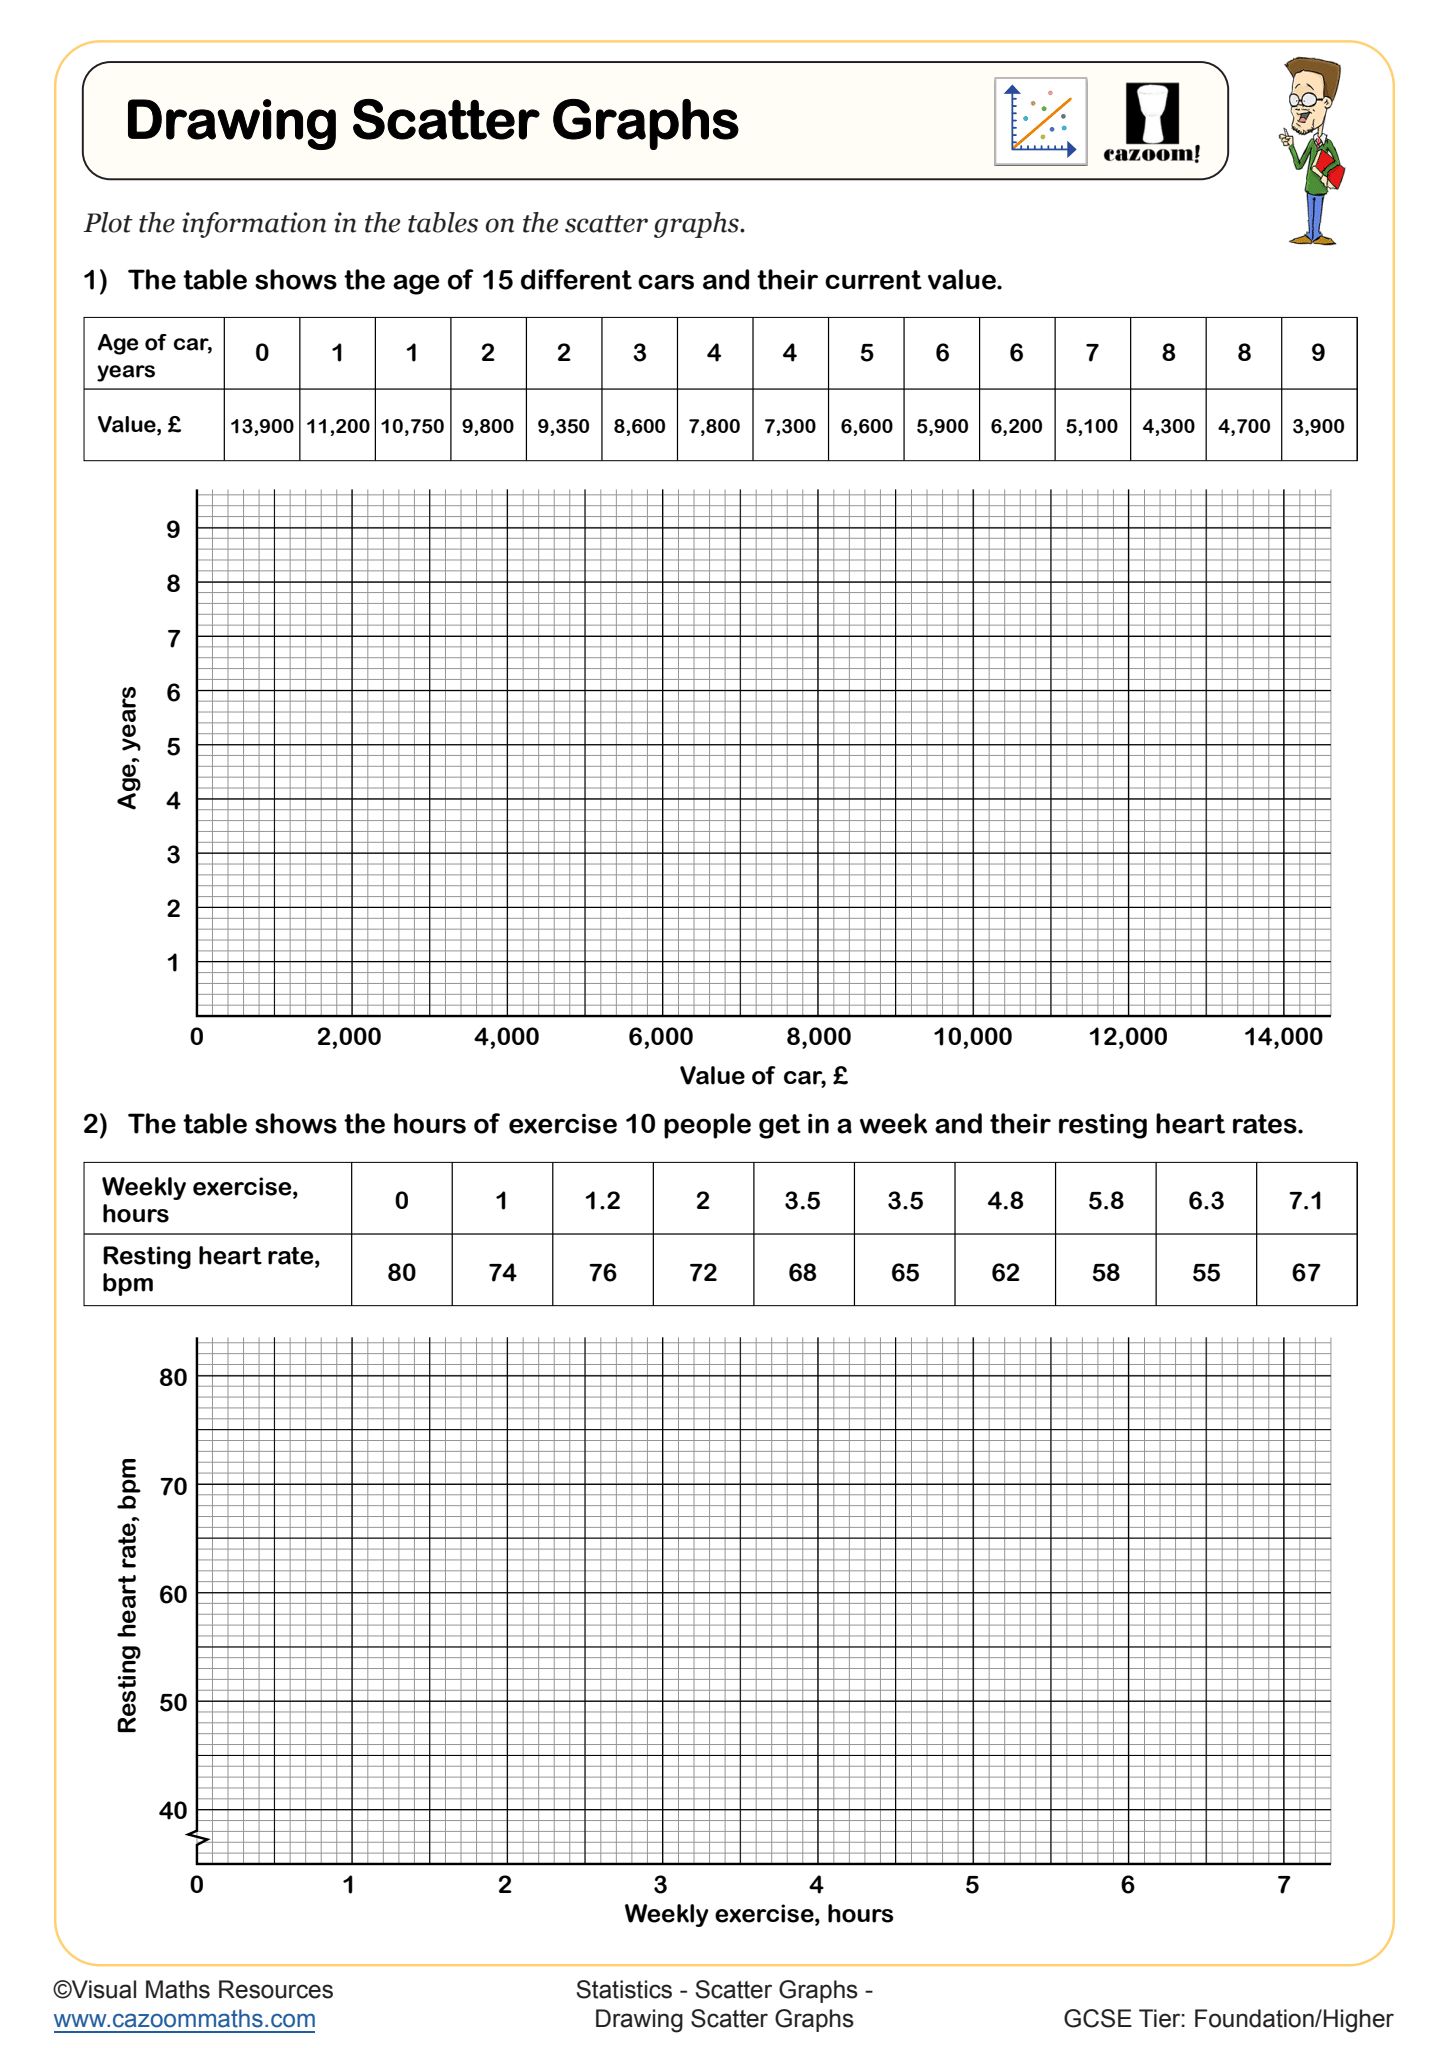
• Plotting coordinates – accurately placing points on numbered axes
• Scale selection – choosing appropriate intervals for clarity
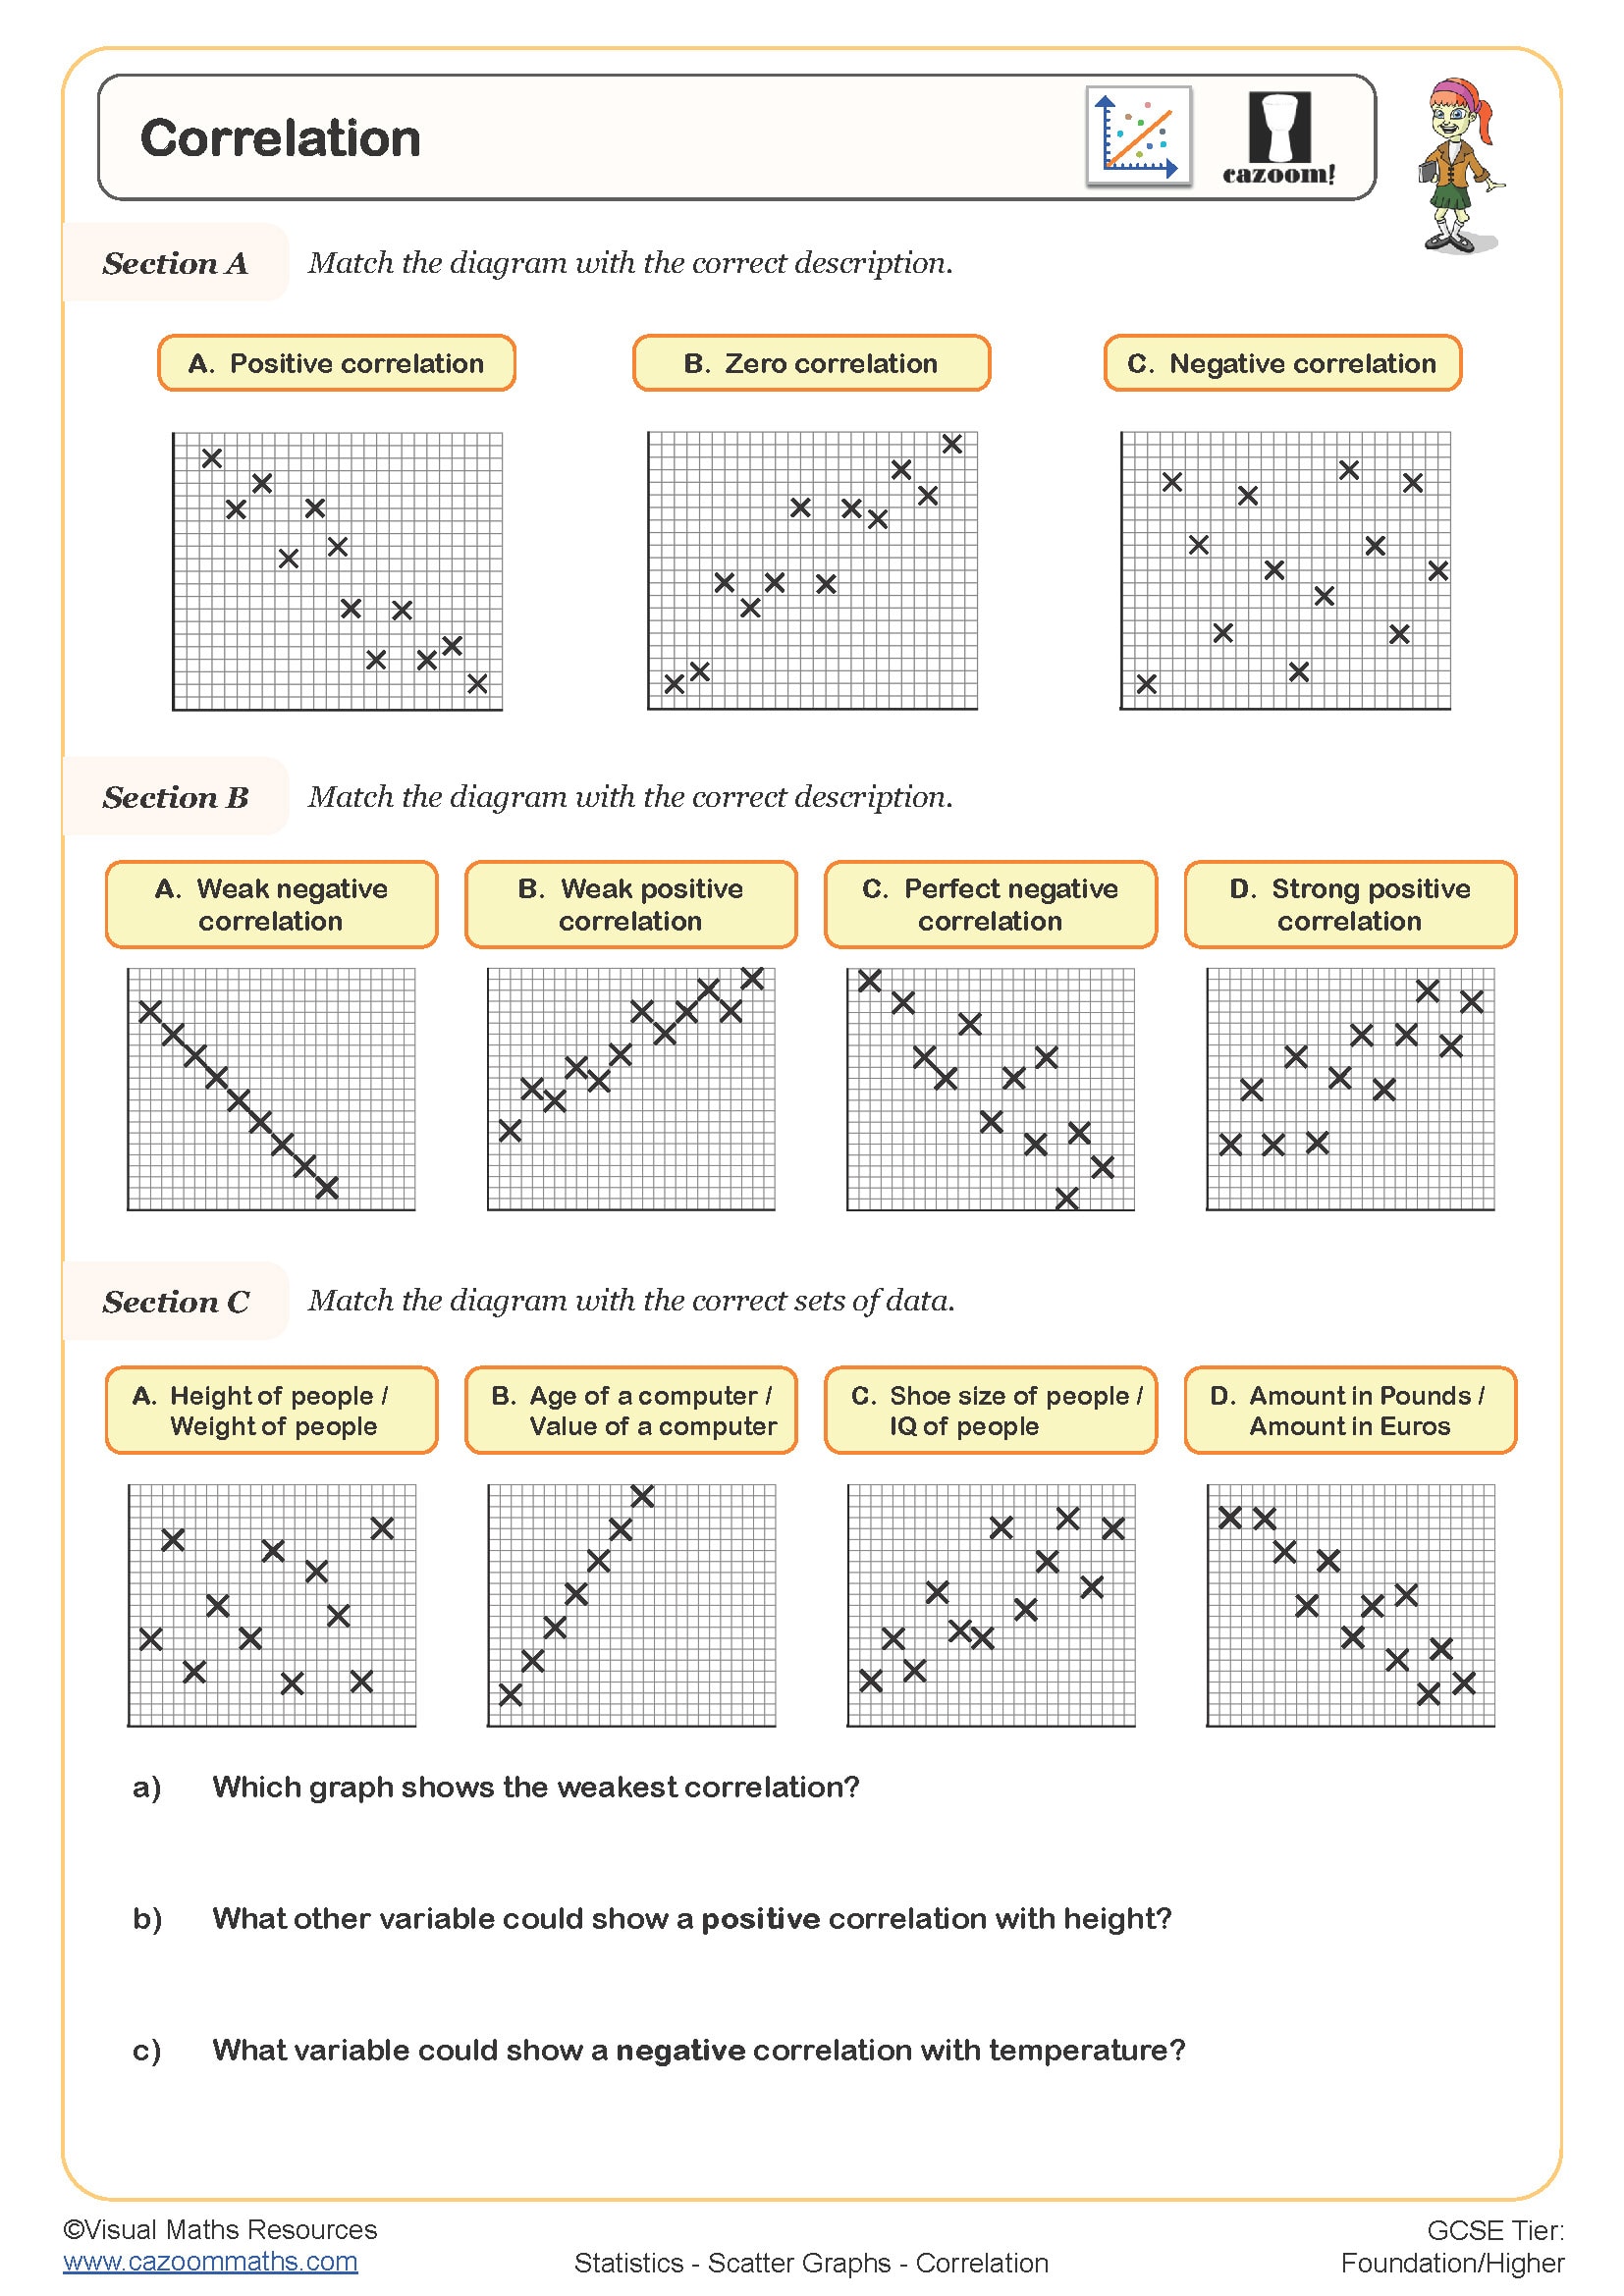
• Correlation types – recognising positive, negative and no correlation
• Line of best fit – drawing trend lines through data clusters
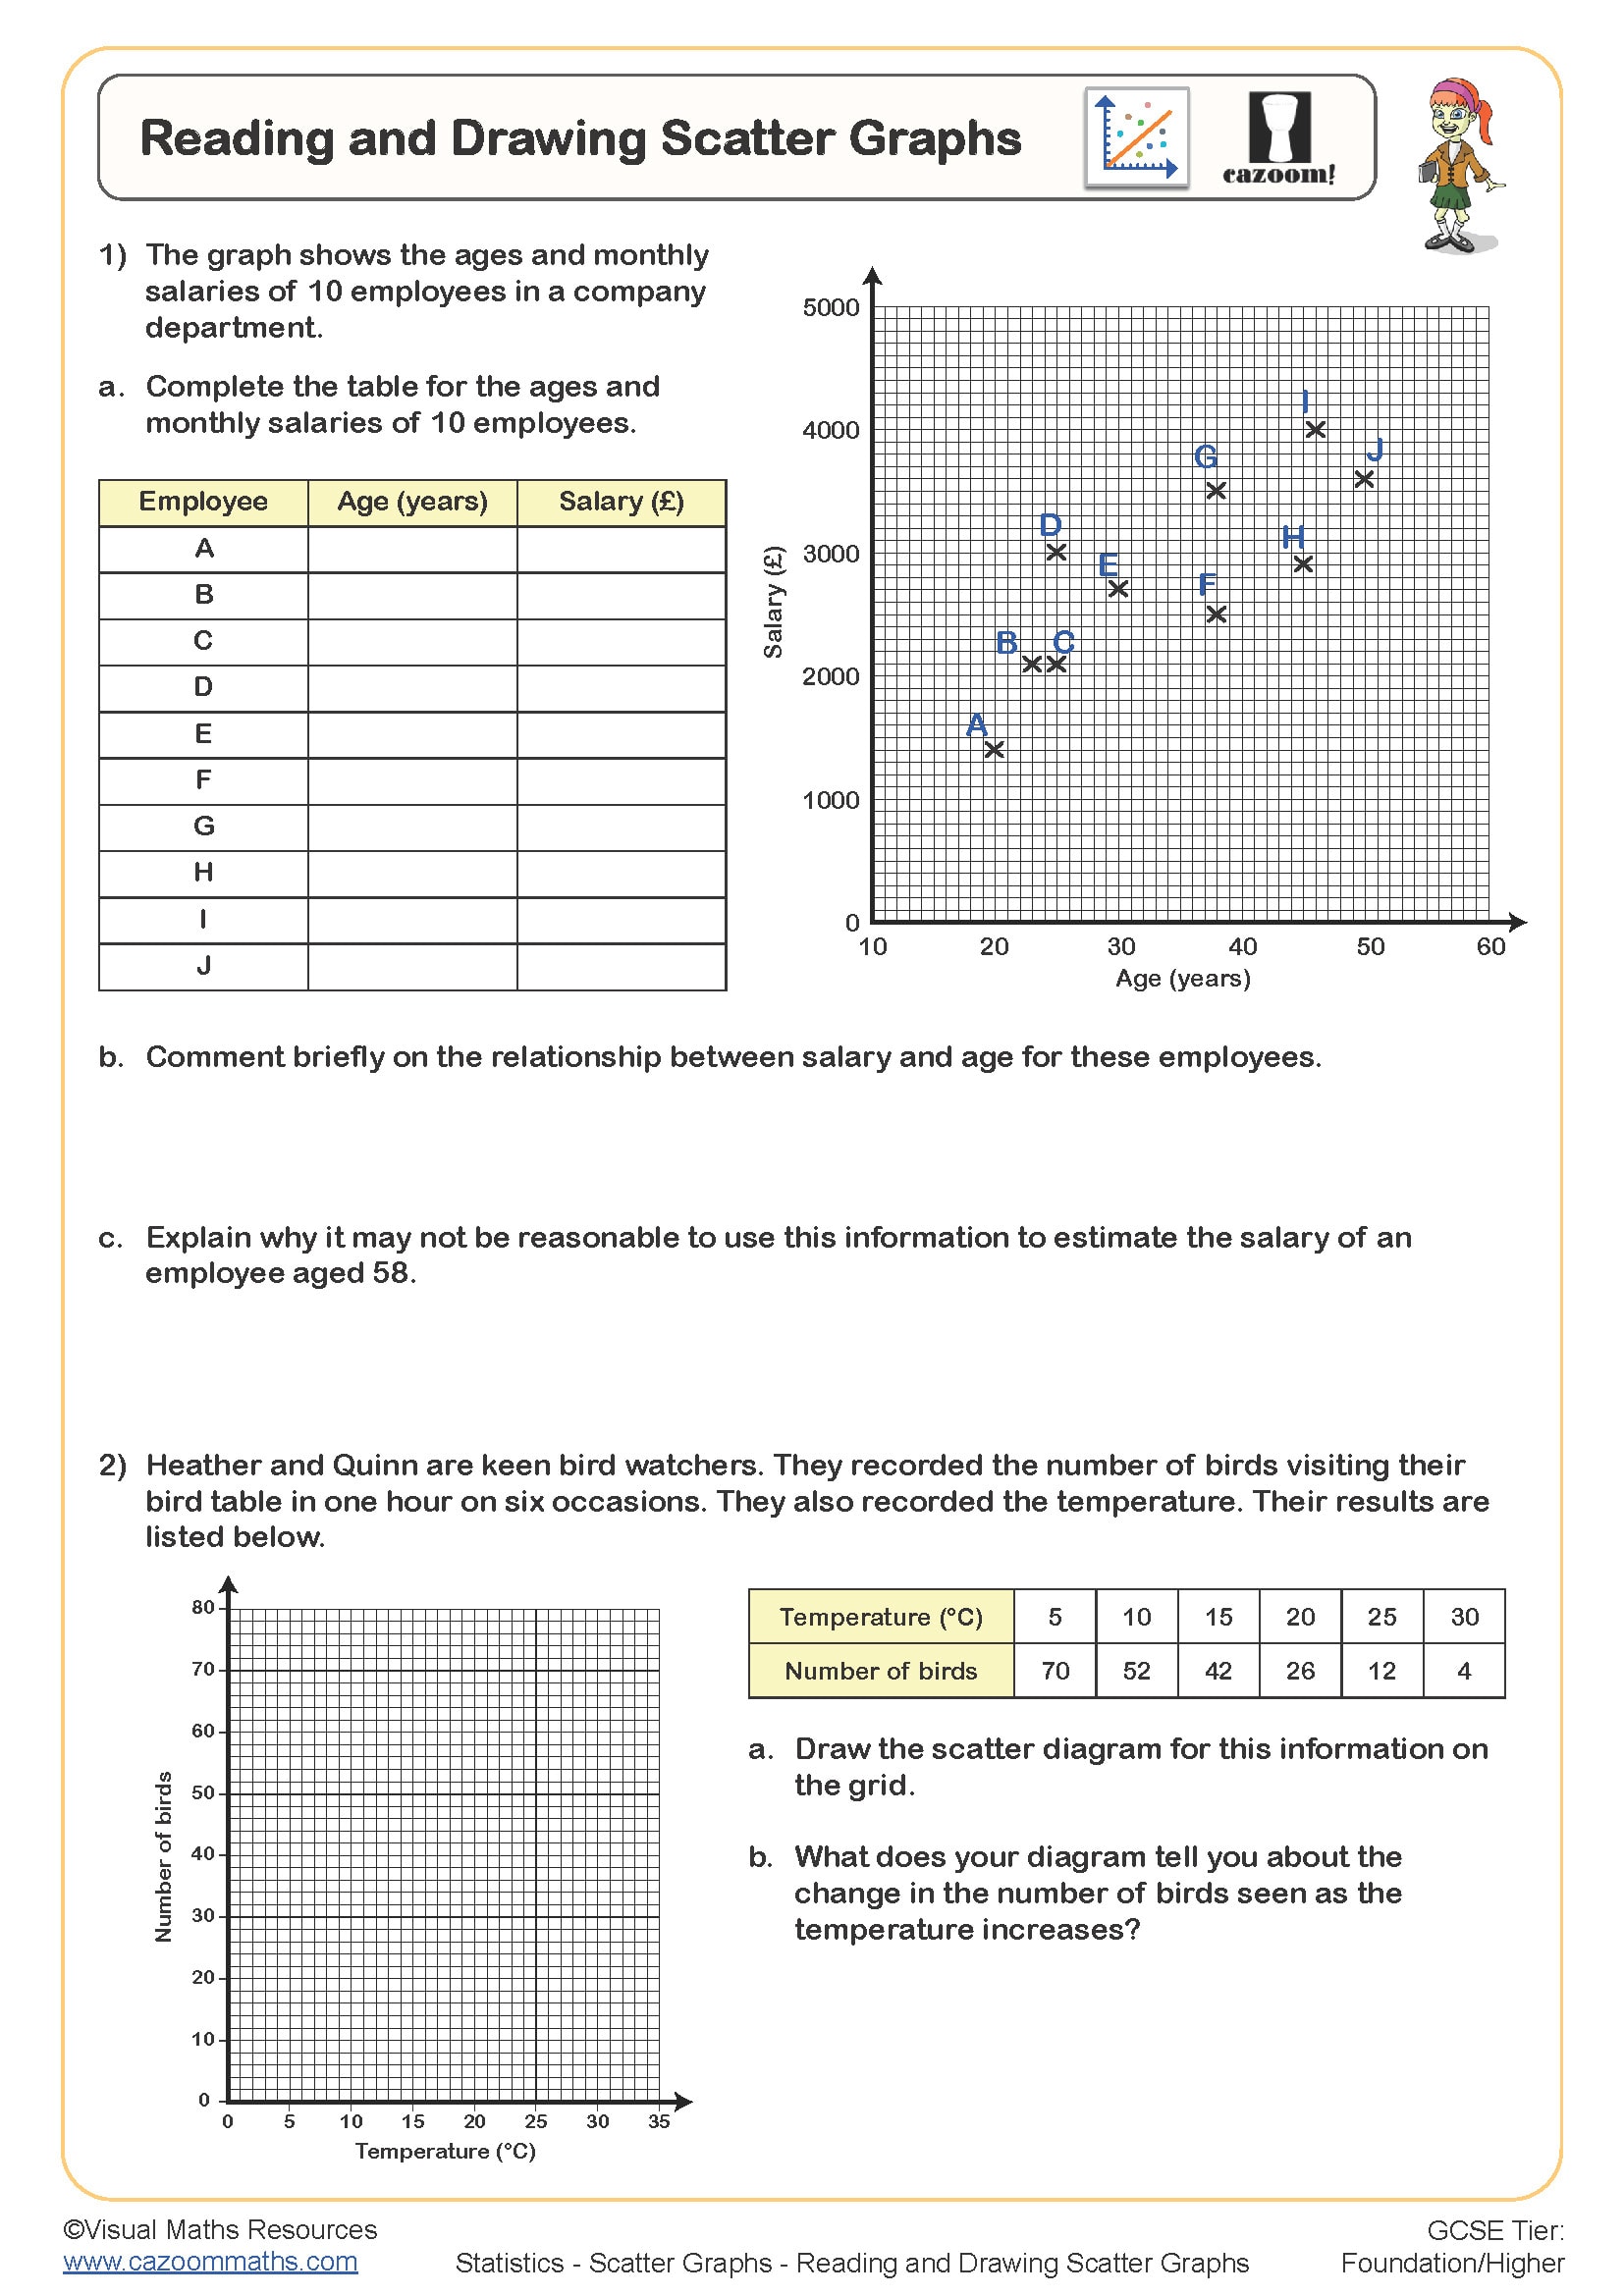
• Interpreting patterns – describing relationships in context
• Outlier identification – spotting unusual data points
• Variable relationships – understanding dependent and independent variables
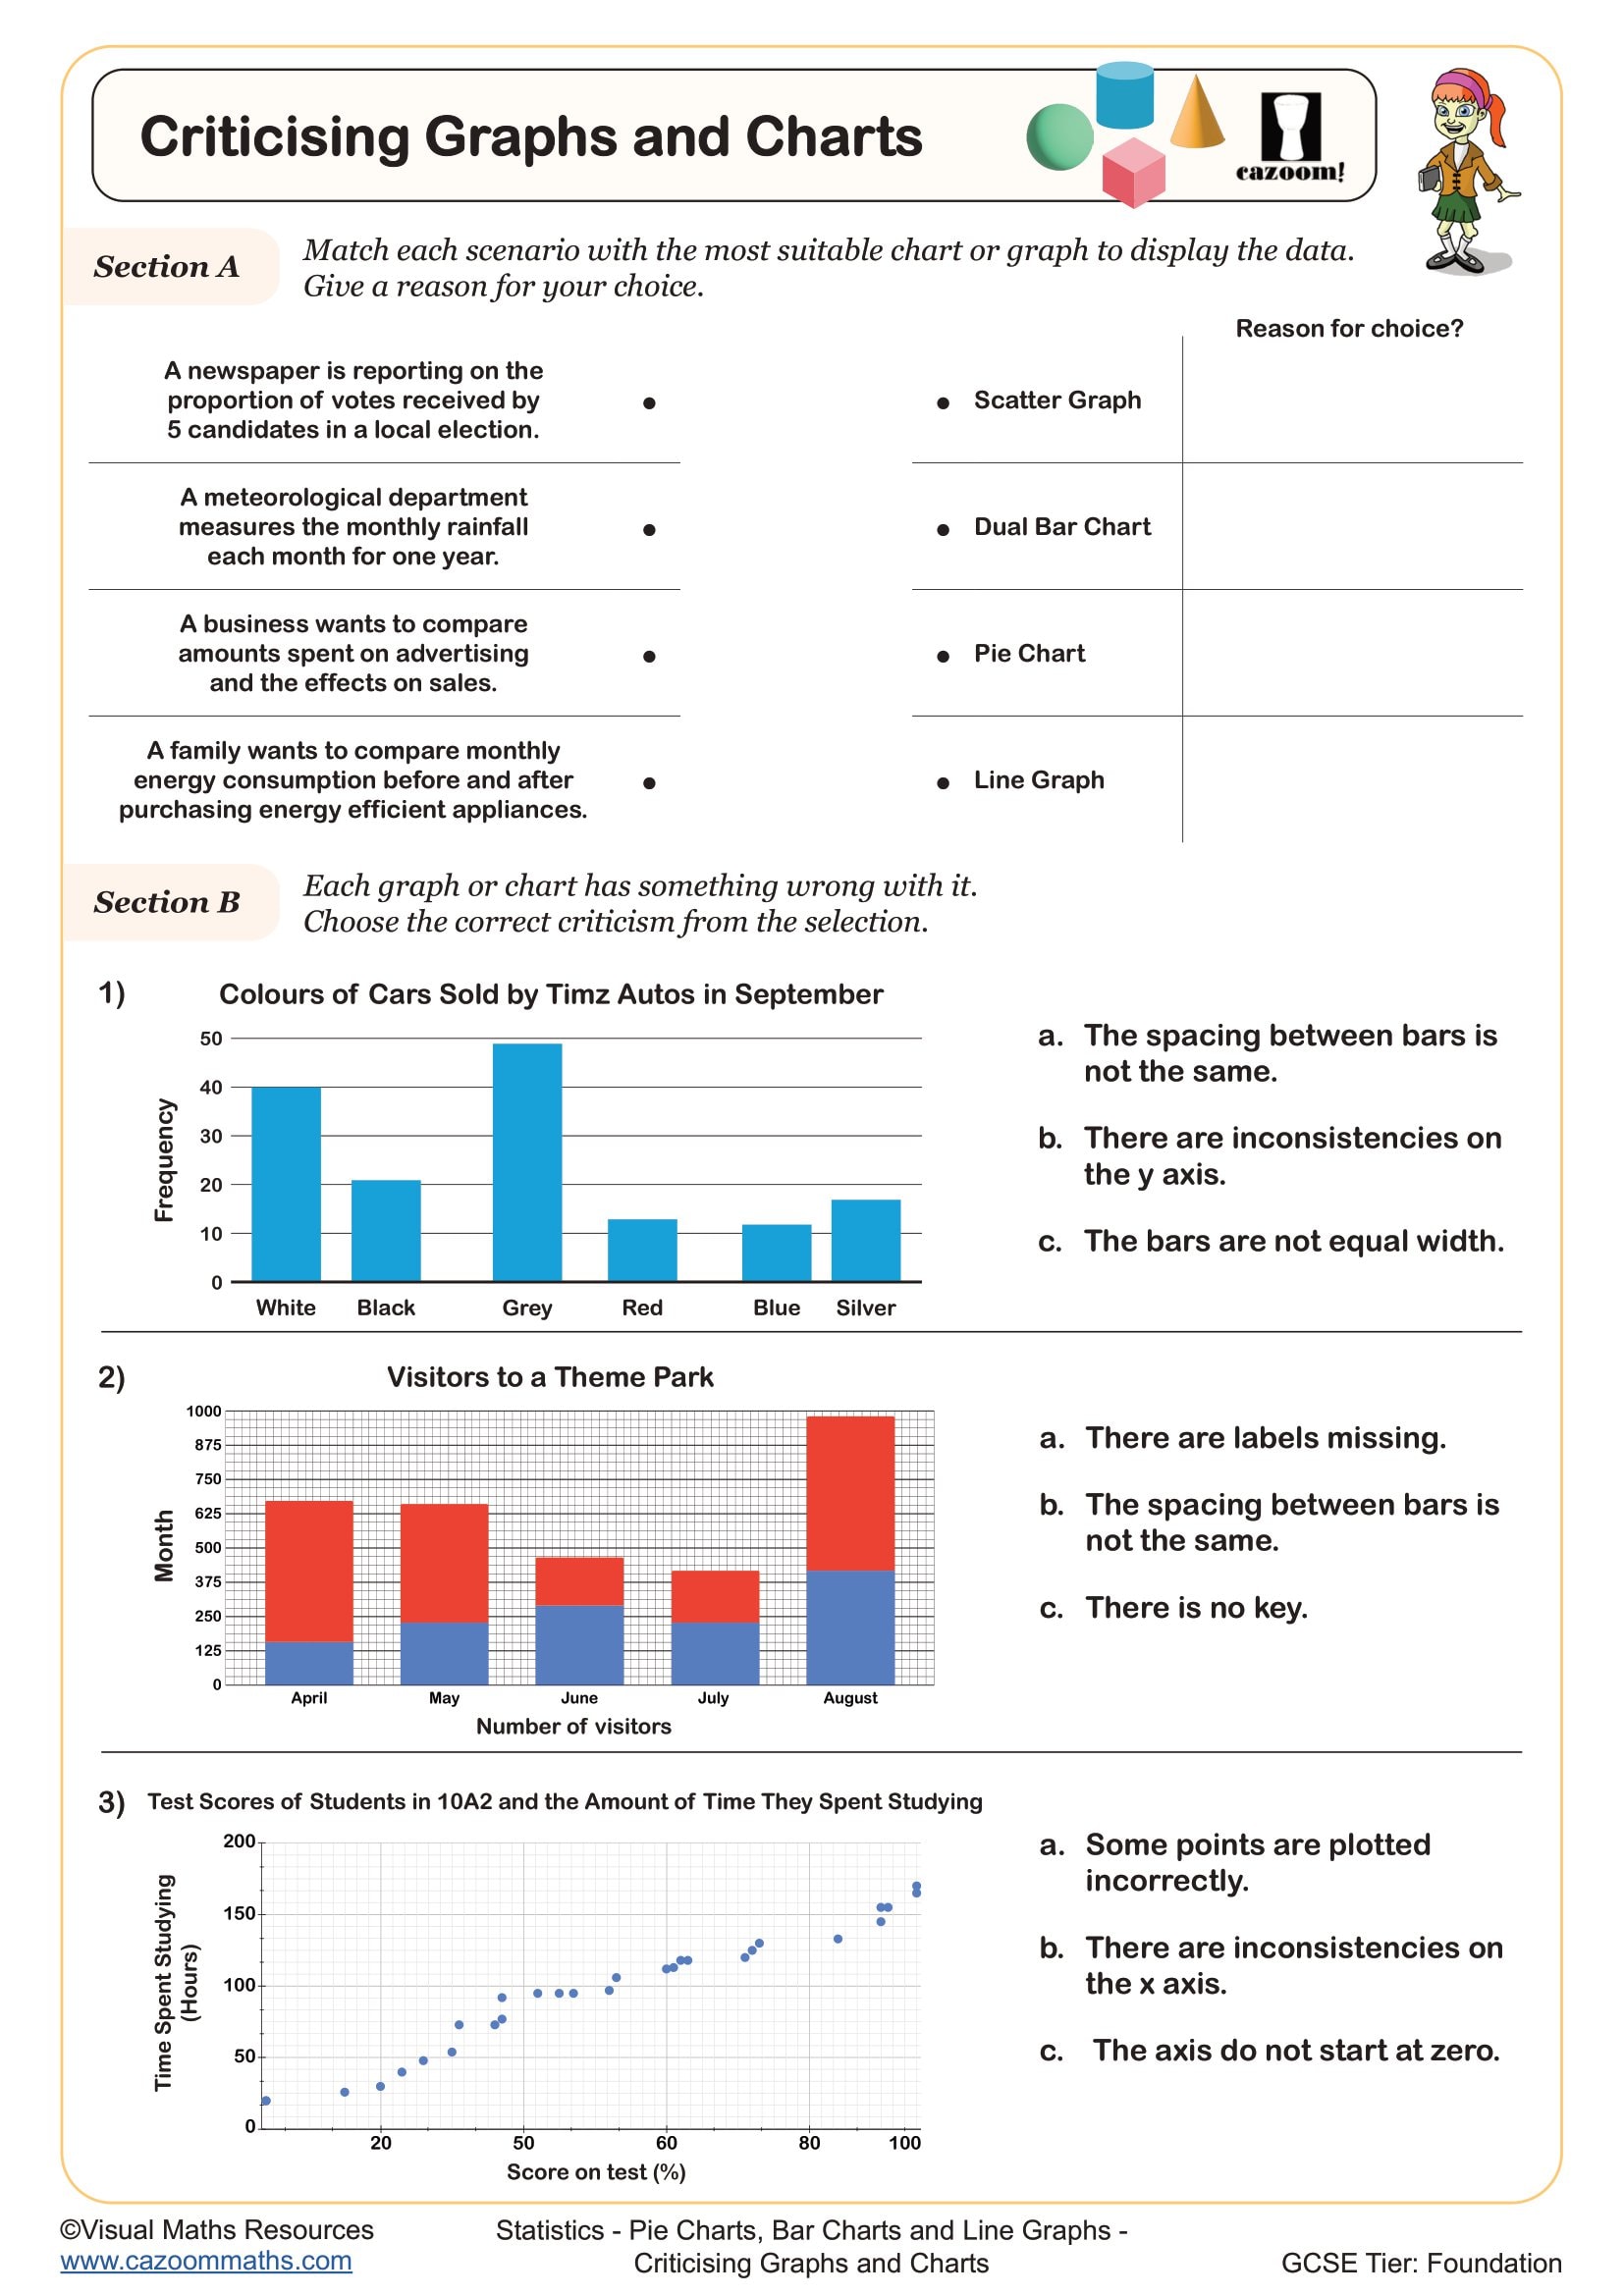
• Graph labelling – adding titles, axis labels and units
• Making predictions – using patterns to estimate values
Having Trouble With Scatter Graphs? Try Year 7 Statistics Worksheets
Classroom-tested across diverse secondary settings, these materials balance accessibility with appropriate challenge for Year 7 learners. The differentiated approach means struggling students can focus on accurate plotting whilst more confident learners explore correlation strength and outlier effects. Teaching assistants and cover teachers appreciate the self-explanatory format, which enables consistent delivery without extensive preparation time. Question formats mirror those students will encounter in assessments, developing technique alongside understanding. The variety of contexts—from science experiments to sports statistics—maintains engagement throughout lessons. Cazoom Maths worksheets include detailed mark schemes showing construction methods step-by-step, not just finished diagrams, making marking efficient and feedback specific.
Practical Scatter Graphs Examples Year 7 Students Face Daily
Understanding scatter graphs equips students to analyse relationships they encounter daily, from sports performance to social media trends. These skills directly support investigations across the curriculum.
• Science experiments – plotting temperature against reaction rate
• Sports analysis – comparing training hours to performance scores
• Weather patterns – relating temperature to ice cream sales
• Social media – examining followers versus engagement rates
• Gaming statistics – analysing play time against achievement levels
• Health tracking – monitoring exercise duration and fitness improvements
• Environmental studies – connecting pollution levels to traffic volume
• Technology trends – comparing device age to battery life