Year 9 Bar Models Worksheets
All worksheets are created by the team of experienced teachers at Cazoom Maths.
How do bar models help with percentage problems?
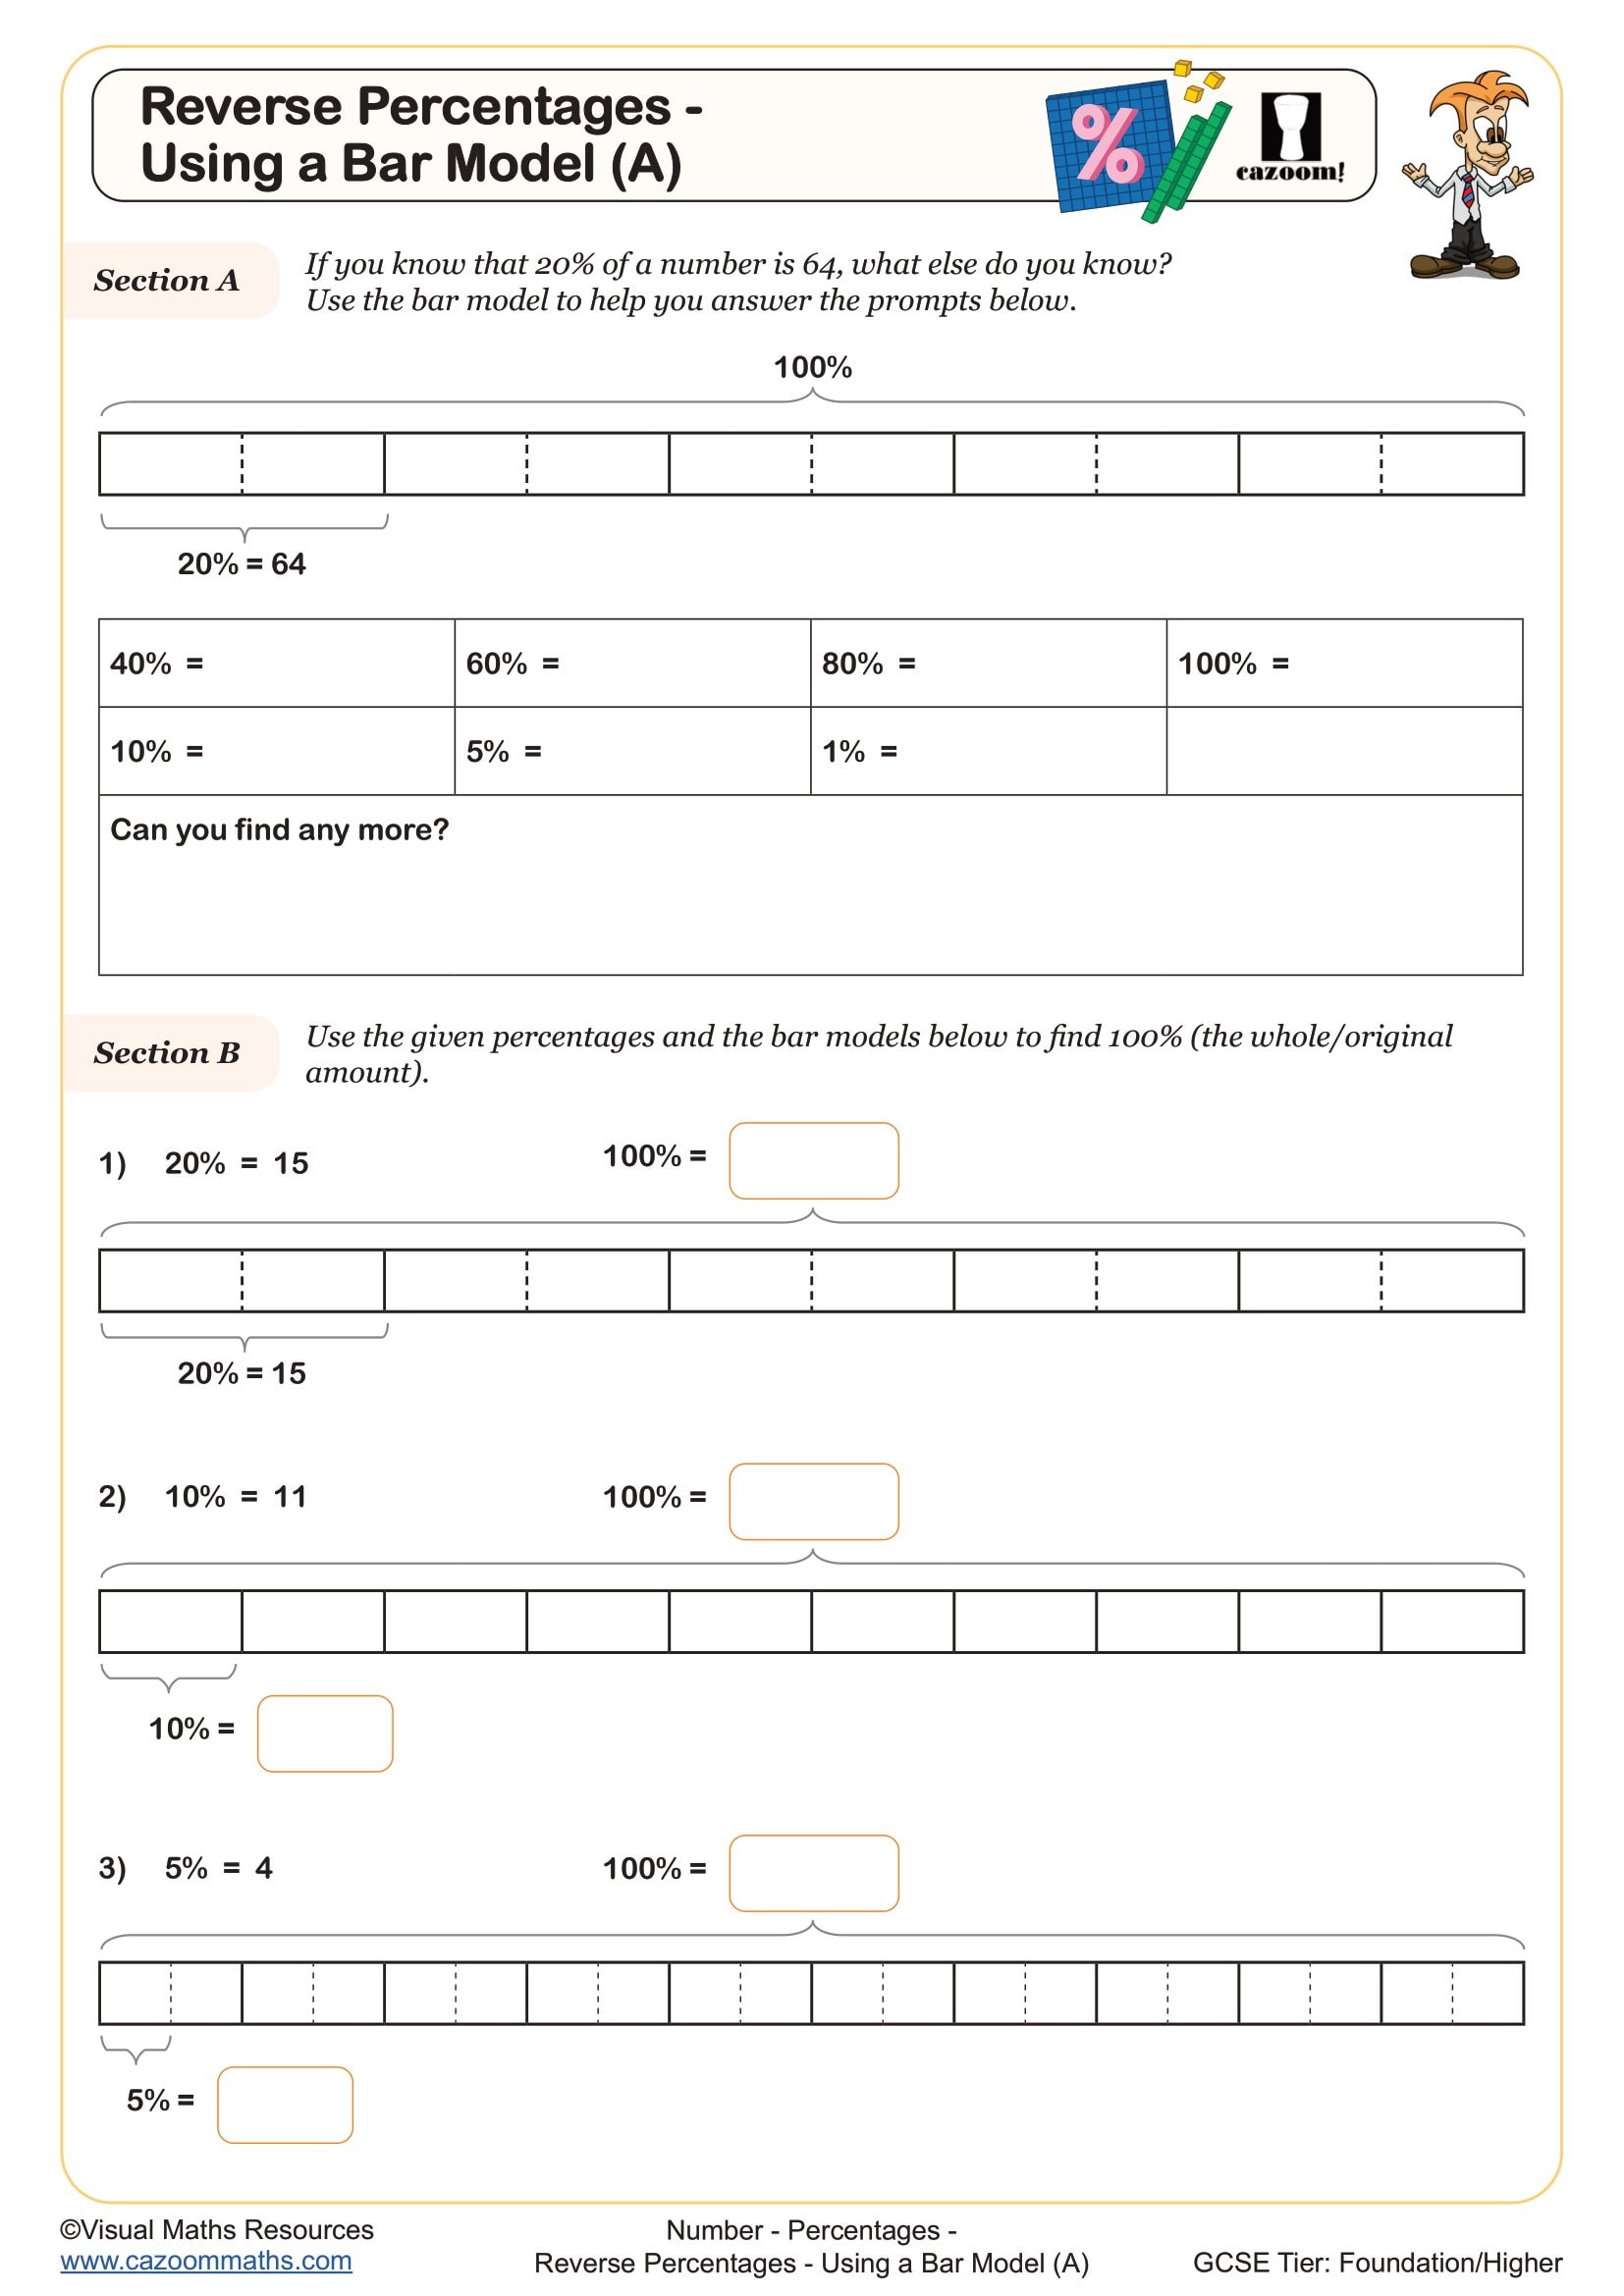
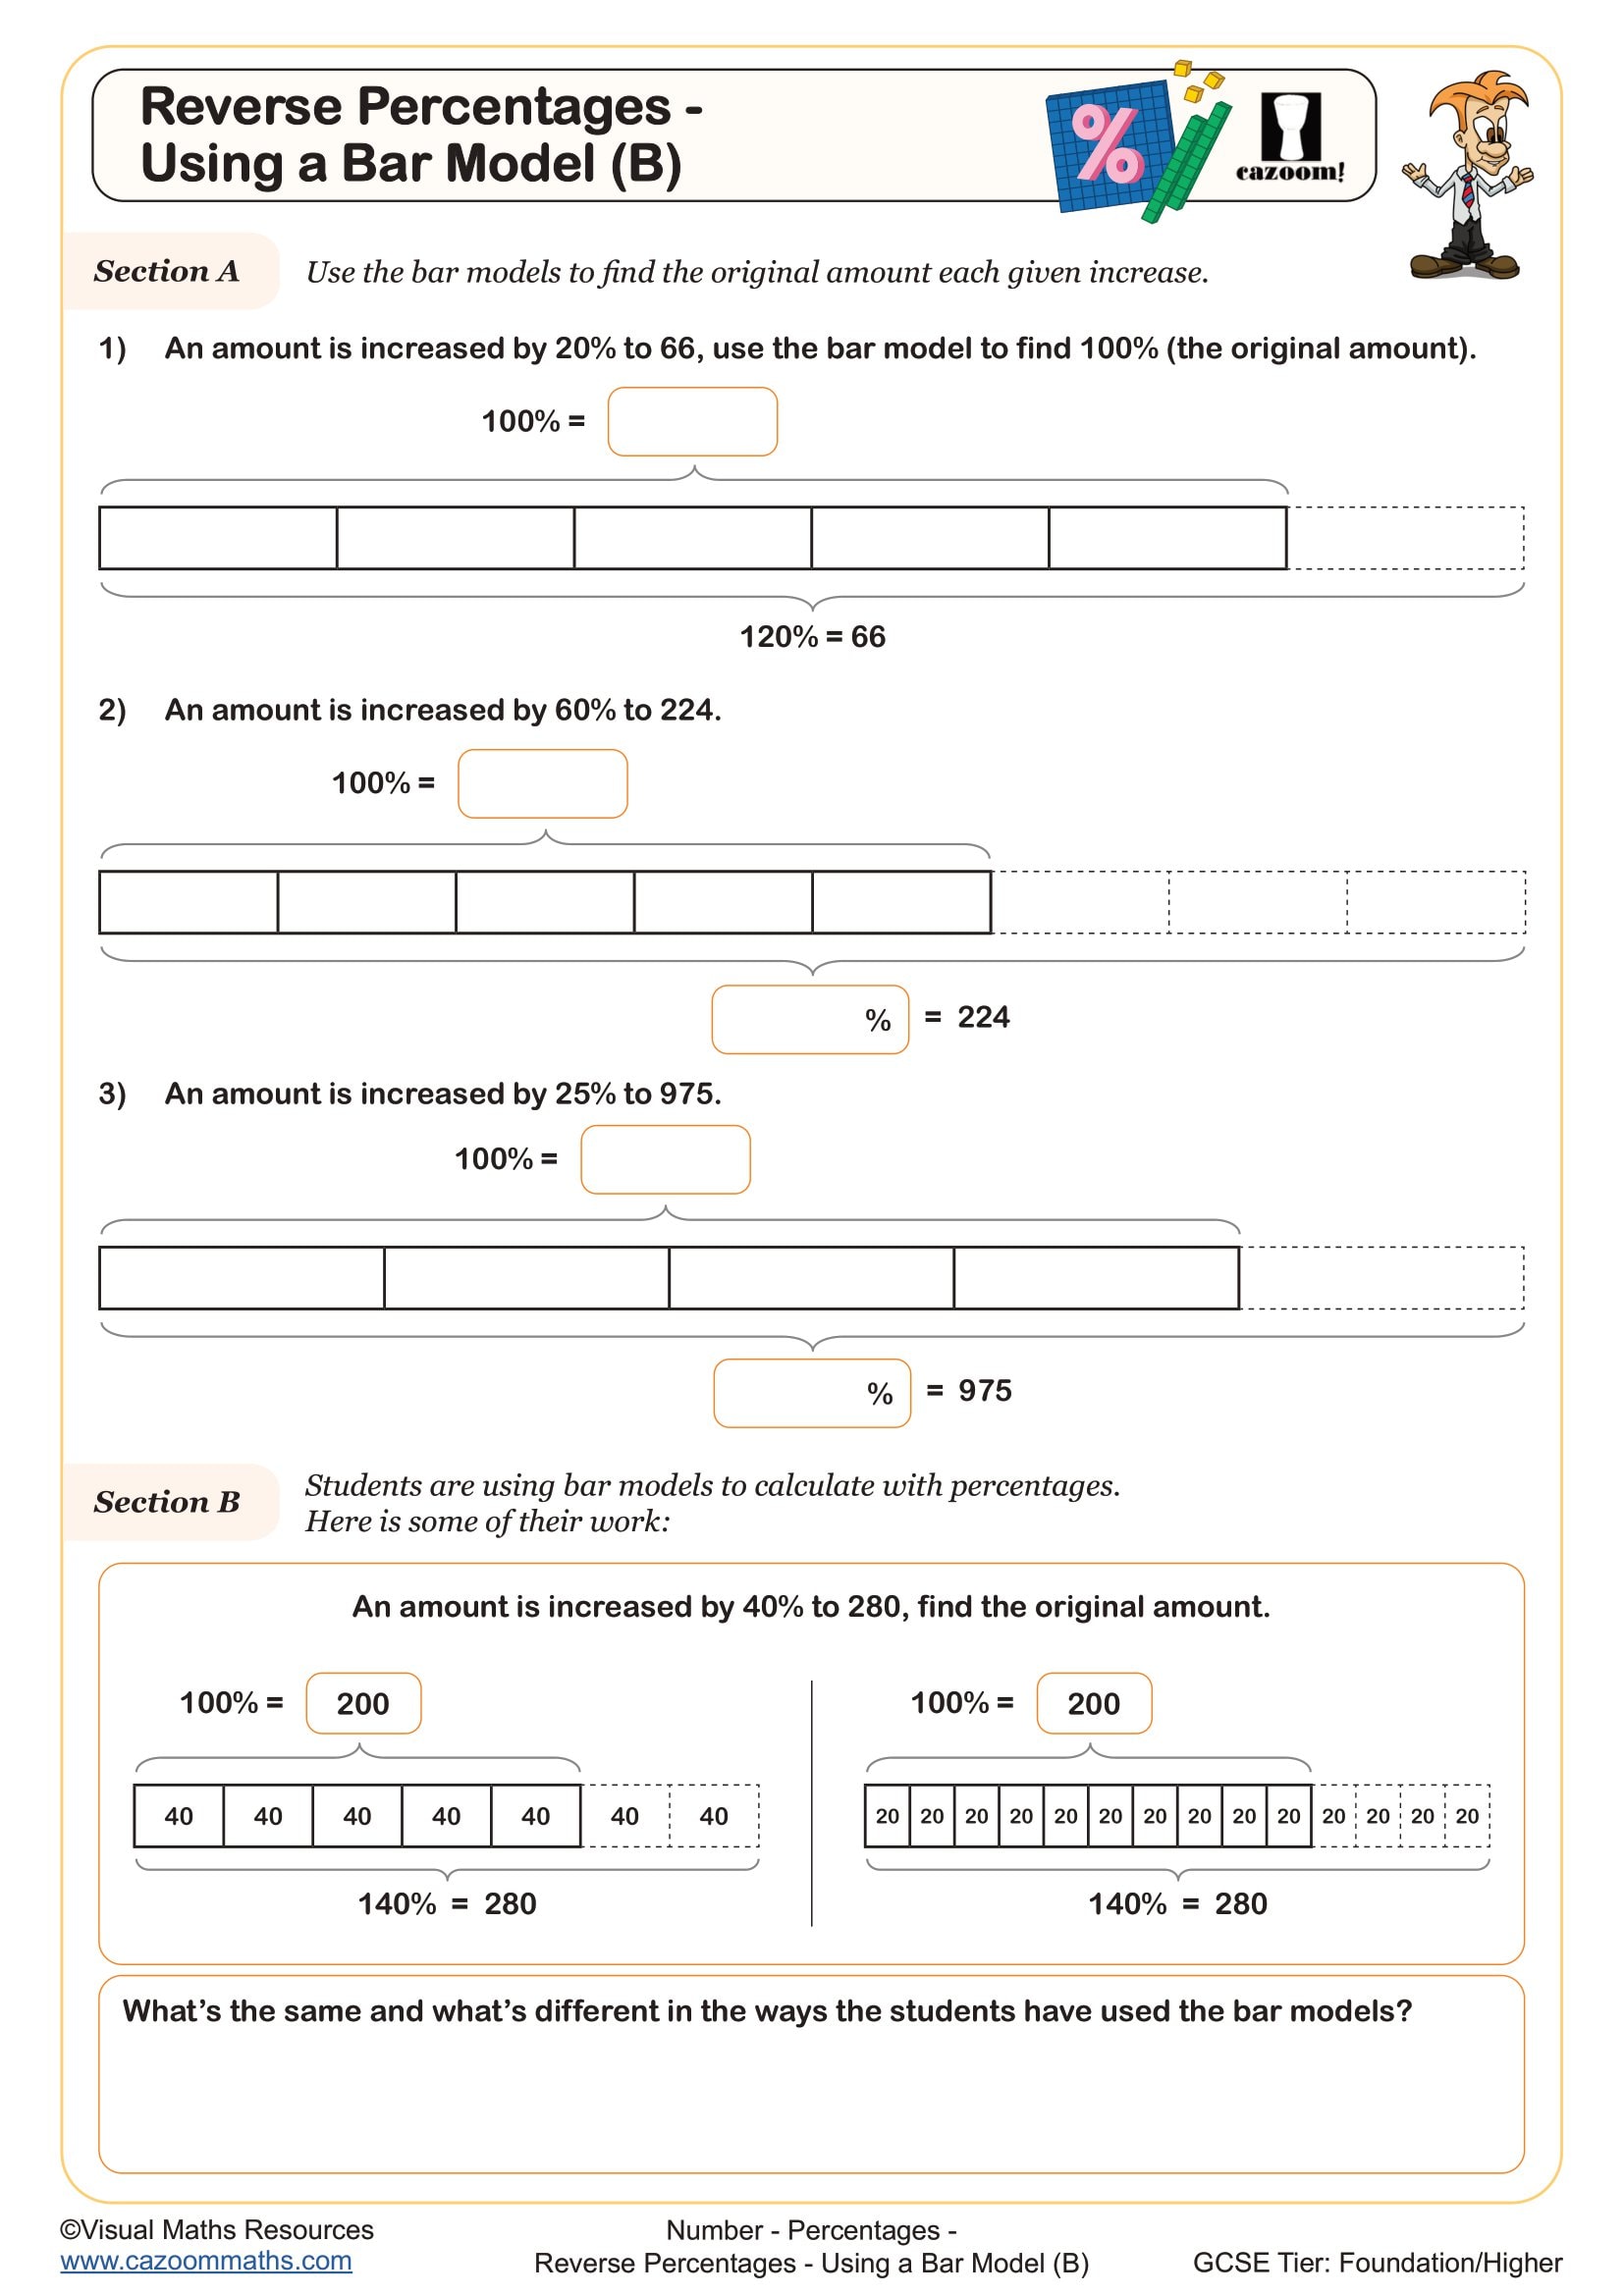
Bar models transform abstract percentage calculations into visual representations where students can see the relationship between the whole, the part, and the percentage. This approach proves particularly effective for reverse percentage problems and percentage increase or decrease questions that typically appear at GCSE Foundation and Higher tier.
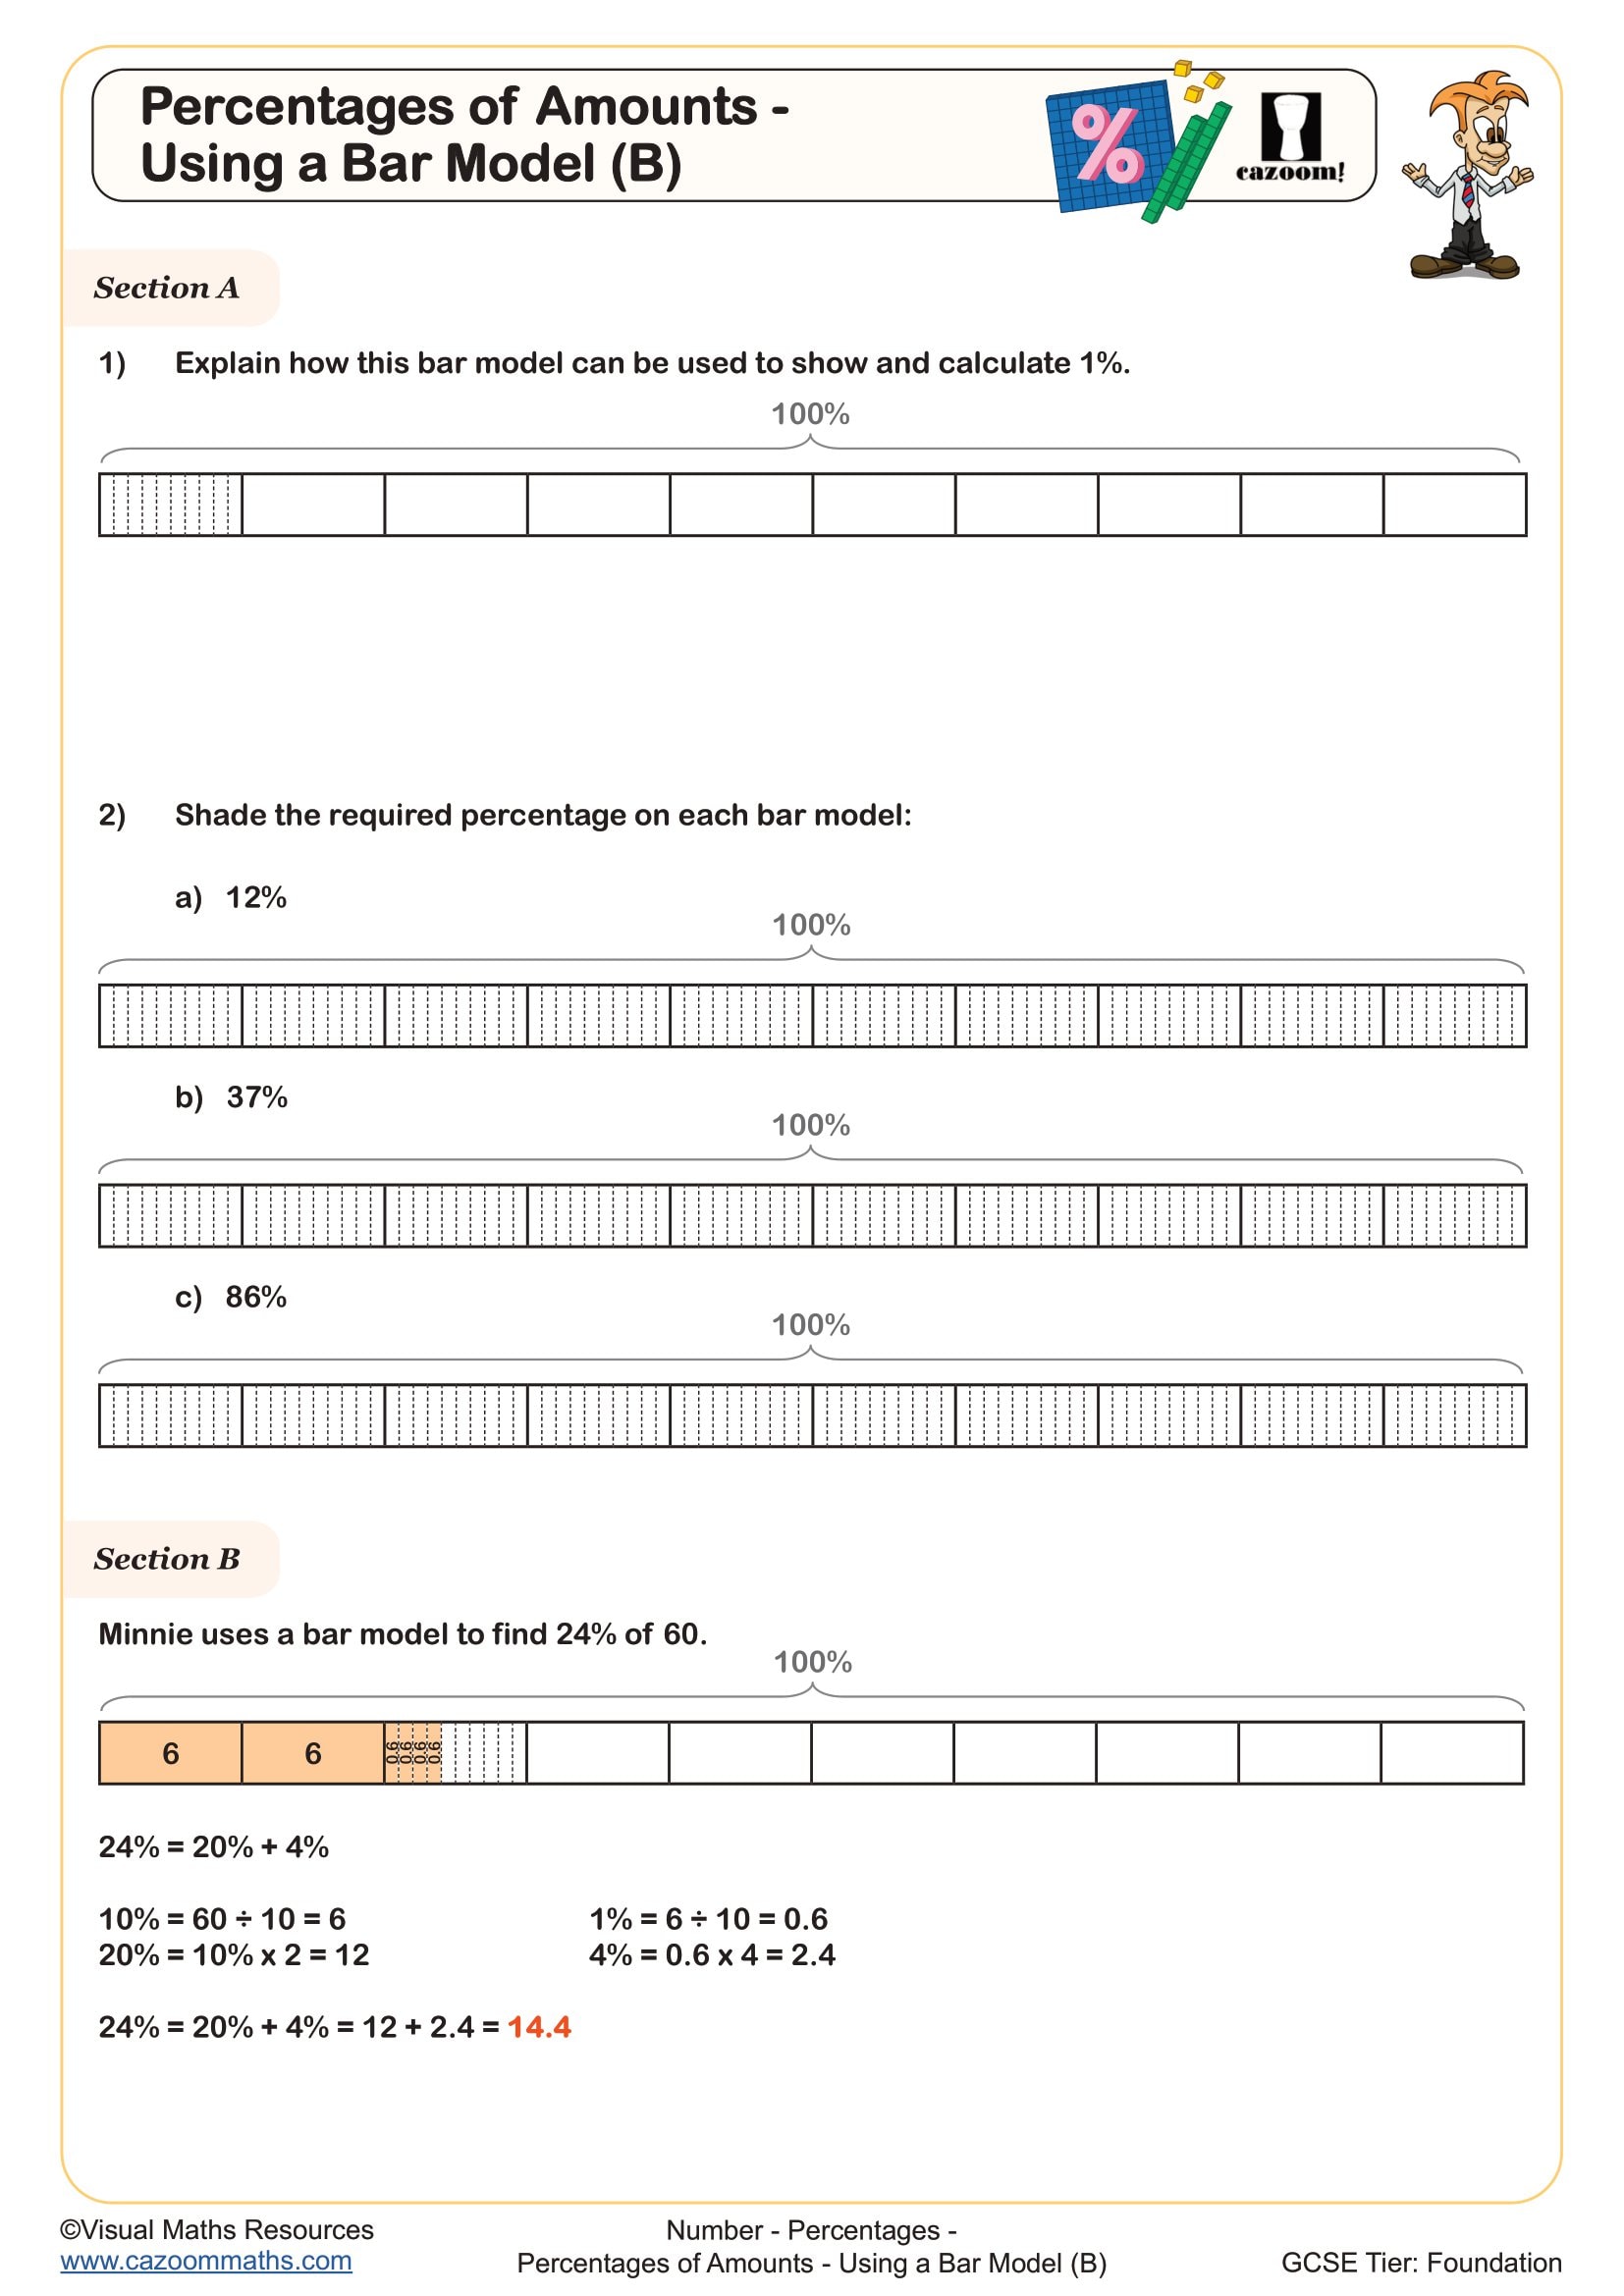
Students often lose marks on percentage problems because they apply operations in the wrong order or confuse finding a percentage of an amount with finding the original value. Bar model percentages worksheets address this by requiring students to sketch the situation first, identifying what represents 100% before calculating. This visual check catches errors before students commit to incorrect calculations, and many teachers find it reduces the common mistake of dividing when they should multiply, or vice versa.
Which year groups use bar models in the UK curriculum?
Bar models appear throughout KS2 and KS3, with Year 9 representing the transition point where these visual tools support increasingly algebraic thinking. At this stage, students use bar models to solve problems involving fractions of amounts, ratio sharing, percentage change, and simple linear equations, aligning with the National Curriculum expectations for proportional reasoning.
The progression from earlier year groups becomes evident in problem complexity rather than the bar model technique itself. Year 9 students tackle multi-step problems where the bar must represent algebraic unknowns or compound percentage changes, whereas younger students might use the same visual structure for simpler fraction and ratio work. This consistency in approach helps students build confidence as problems become more demanding, providing familiar scaffolding when introducing new mathematical concepts.
What makes bar models effective for ratio problems?
Bar models excel at ratio problems because they make the concept of 'parts' concrete and visual. Students divide a bar into equal sections representing the ratio quantities, then use these to find actual values once they know what one part represents. This method works seamlessly for sharing in a given ratio, comparing ratios, or finding missing quantities in proportional relationships.
Engineers and architects regularly use proportional reasoning when scaling designs or calculating material quantities, making ratio competence genuinely applicable beyond the classroom. Construction professionals, for instance, must maintain accurate ratios when mixing concrete or calculating load distributions. When students understand ratio through bar models, they develop the proportional thinking that underpins these real-world applications, whether they're adjusting recipe quantities or understanding map scales in geography.
How can teachers use these worksheets in lessons?
These worksheets work effectively as structured practice following direct instruction on bar model techniques, with questions that gradually increase in complexity. Teachers can use the answer sheets to model correct visual representation during whole-class teaching, demonstrating how to translate word problems into accurate bar diagrams before attempting calculations.
Many teachers find bar model worksheets particularly valuable for intervention sessions with students who struggle with abstract algebraic notation. The visual approach provides an alternative entry point that can later connect back to formal methods. They also work well for homework consolidation, allowing students to practise the technique independently with immediate access to worked solutions. Some teachers use them for paired work where students compare their bar model sketches before calculating, encouraging mathematical discussion about problem structure rather than just numerical answers.