Back to:
Equation of the Line of Best Fit WORKSHEET
Suitable for Year groups: Year 10, Year 11
GCSE Tier: Foundation/Higher
Targeting grades: 4-5
Prerequisite knowledge: Plotting and interpreting scatter graphs. Drawing and understanding lines of best fit. Rearranging and working with linear equations in the form y=mx+c. Substitution into equations to find unknown values. Solving equations.
Learning Objective: Draw estimated lines of best fit. Interpolate and extrapolate apparent trends whilst knowing the dangers of so doing.
Equation of the Line of Best Fit WORKSHEET DESCRIPTION
This worksheet helps students practise drawing and interpreting lines of best fit on scatter graphs.
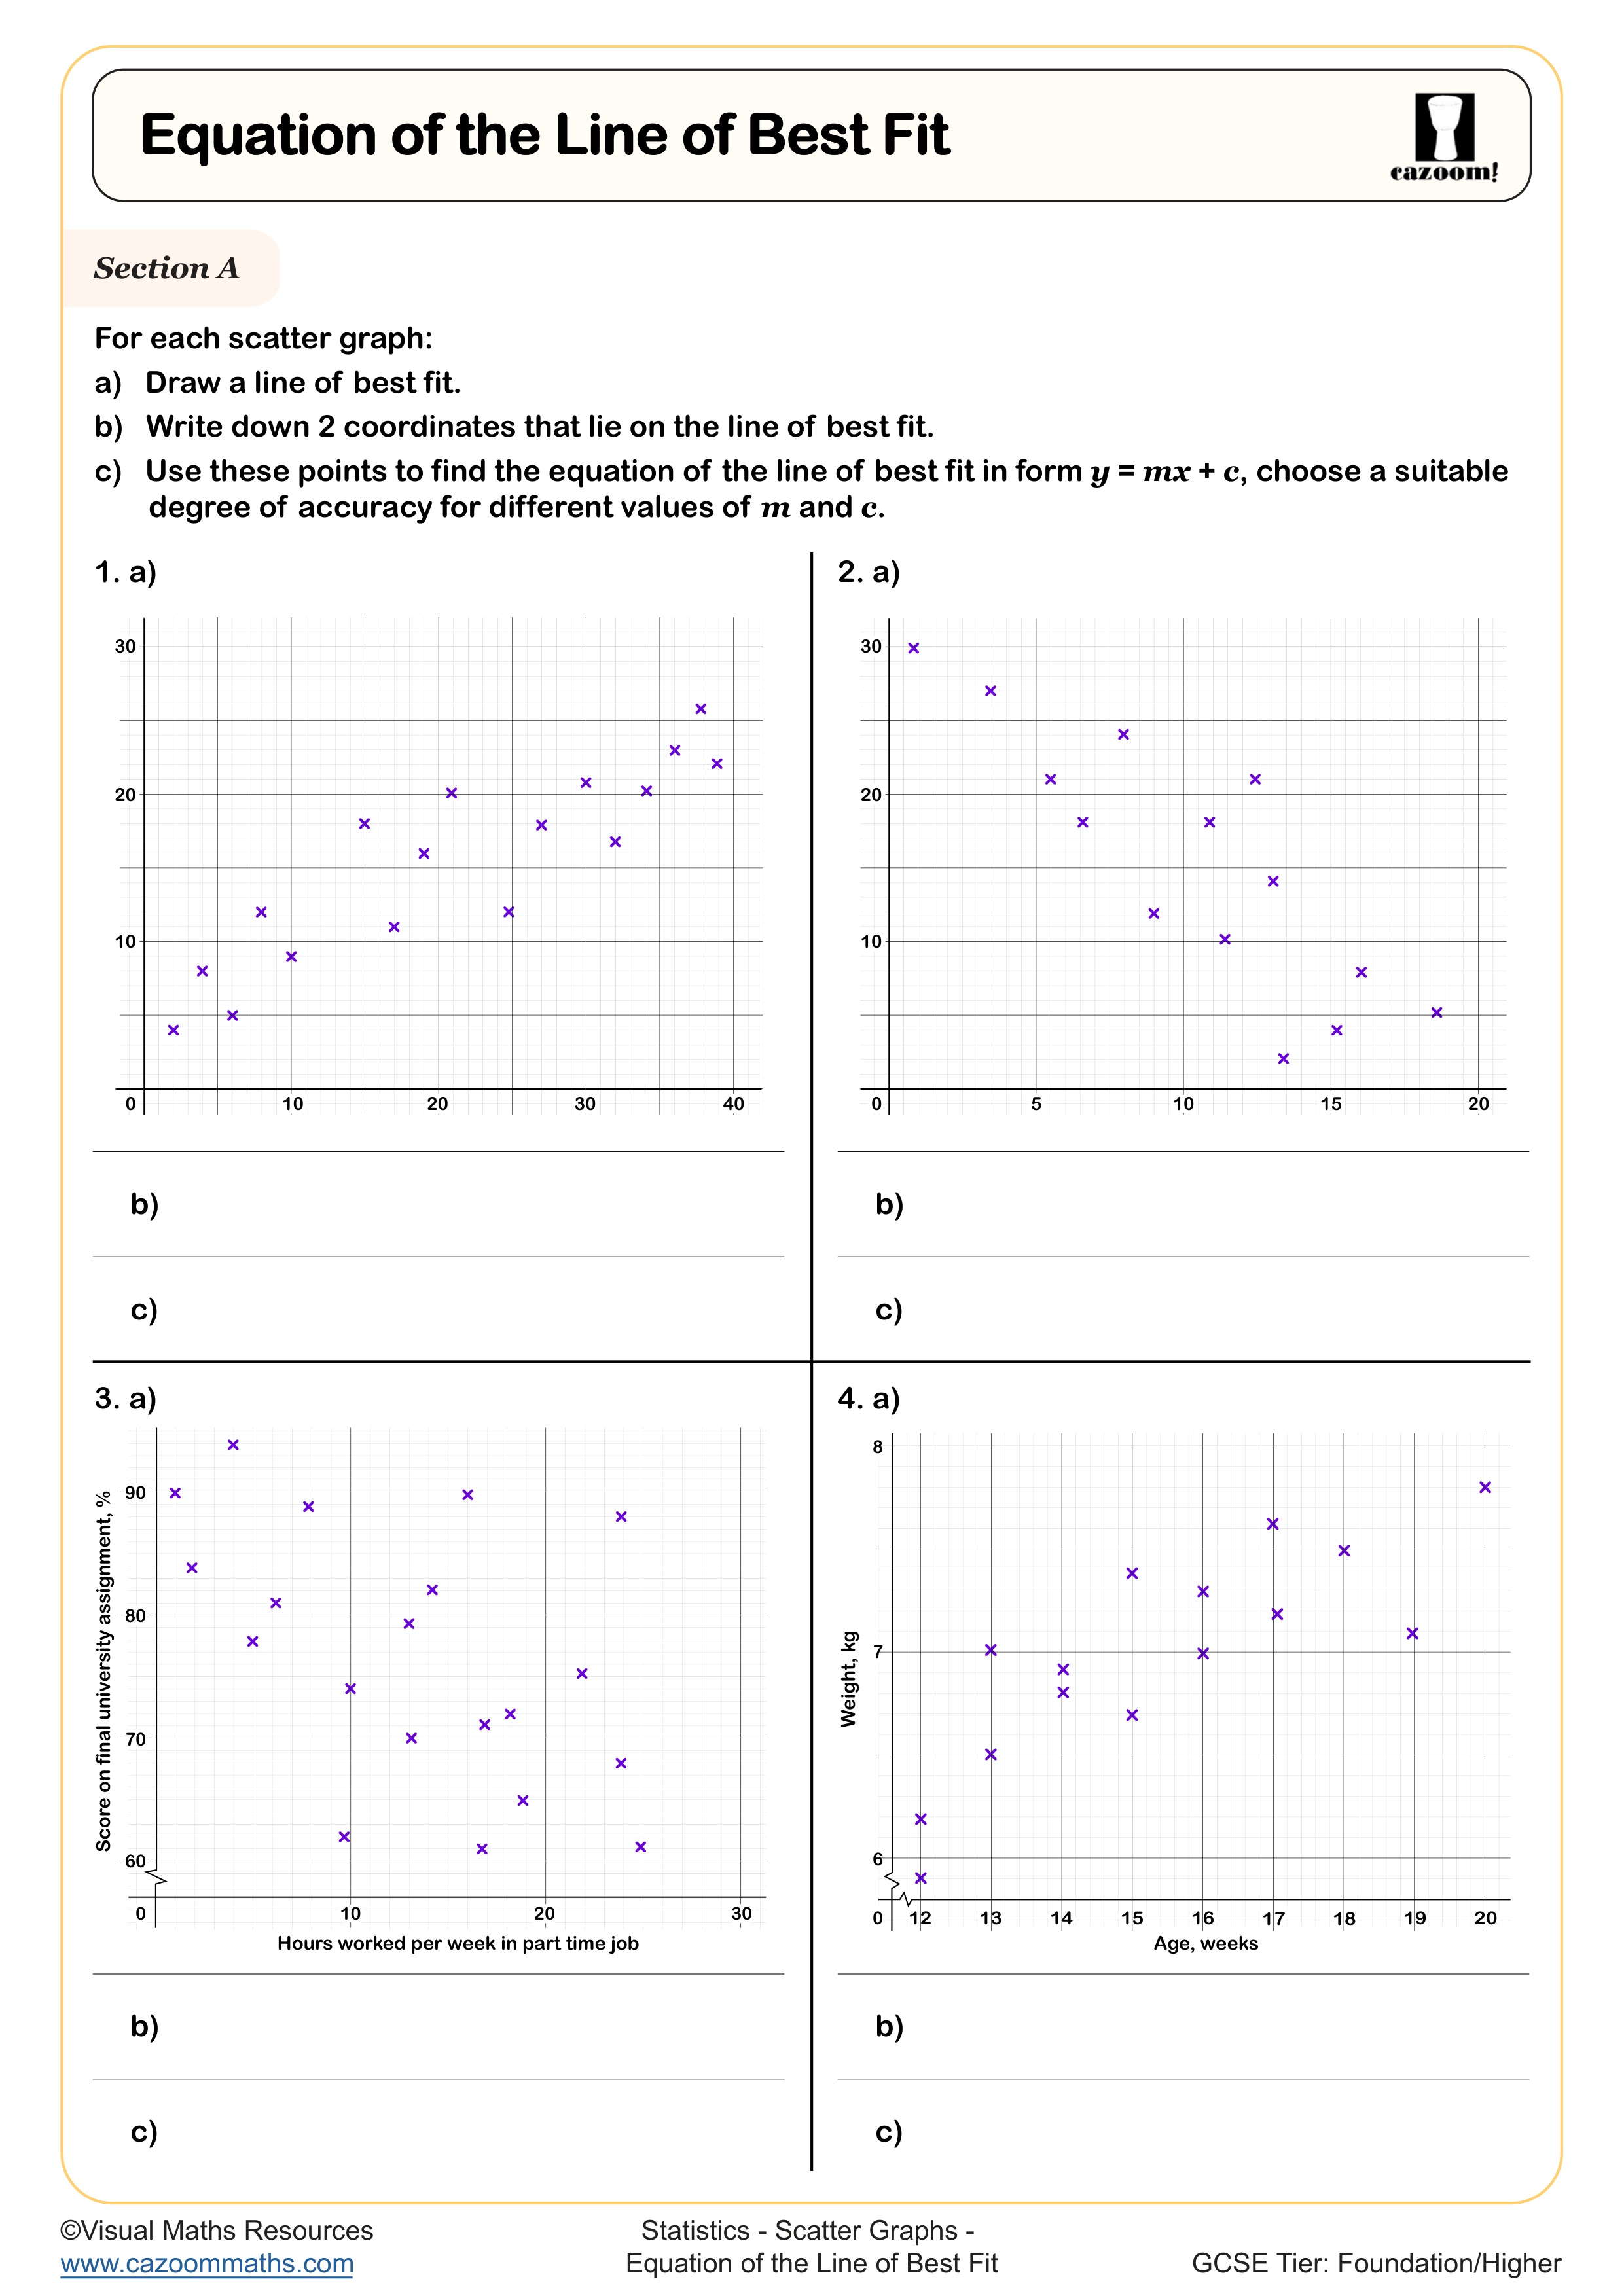
In Section A, pupils plot a line of best fit, select two suitable points, and use these to calculate the equation in the form y=mx+c. They are encouraged to think carefully about choosing an appropriate level of accuracy for their gradient and intercept values.
Section B builds on this by asking students to use their equations to make estimates and predictions, applying both interpolation and extrapolation.
Realistic contexts such as student study hours compared with grades, and a baby’s growth over time, make the questions engaging and relatable. By working through these activities, learners strengthen their skills in handling data, deepen their understanding of correlation, and gain confidence with straight line equations in statistical settings.
All worksheets are created by the team of experienced teachers at Cazoom Maths.
RELATED TO Equation of the Line of Best Fit WORKSHEET
Frequently Asked Questions
Draw estimated lines of best fit. Interpolate and extrapolate apparent trends whilst knowing the dangers of so doing.
