Back to:
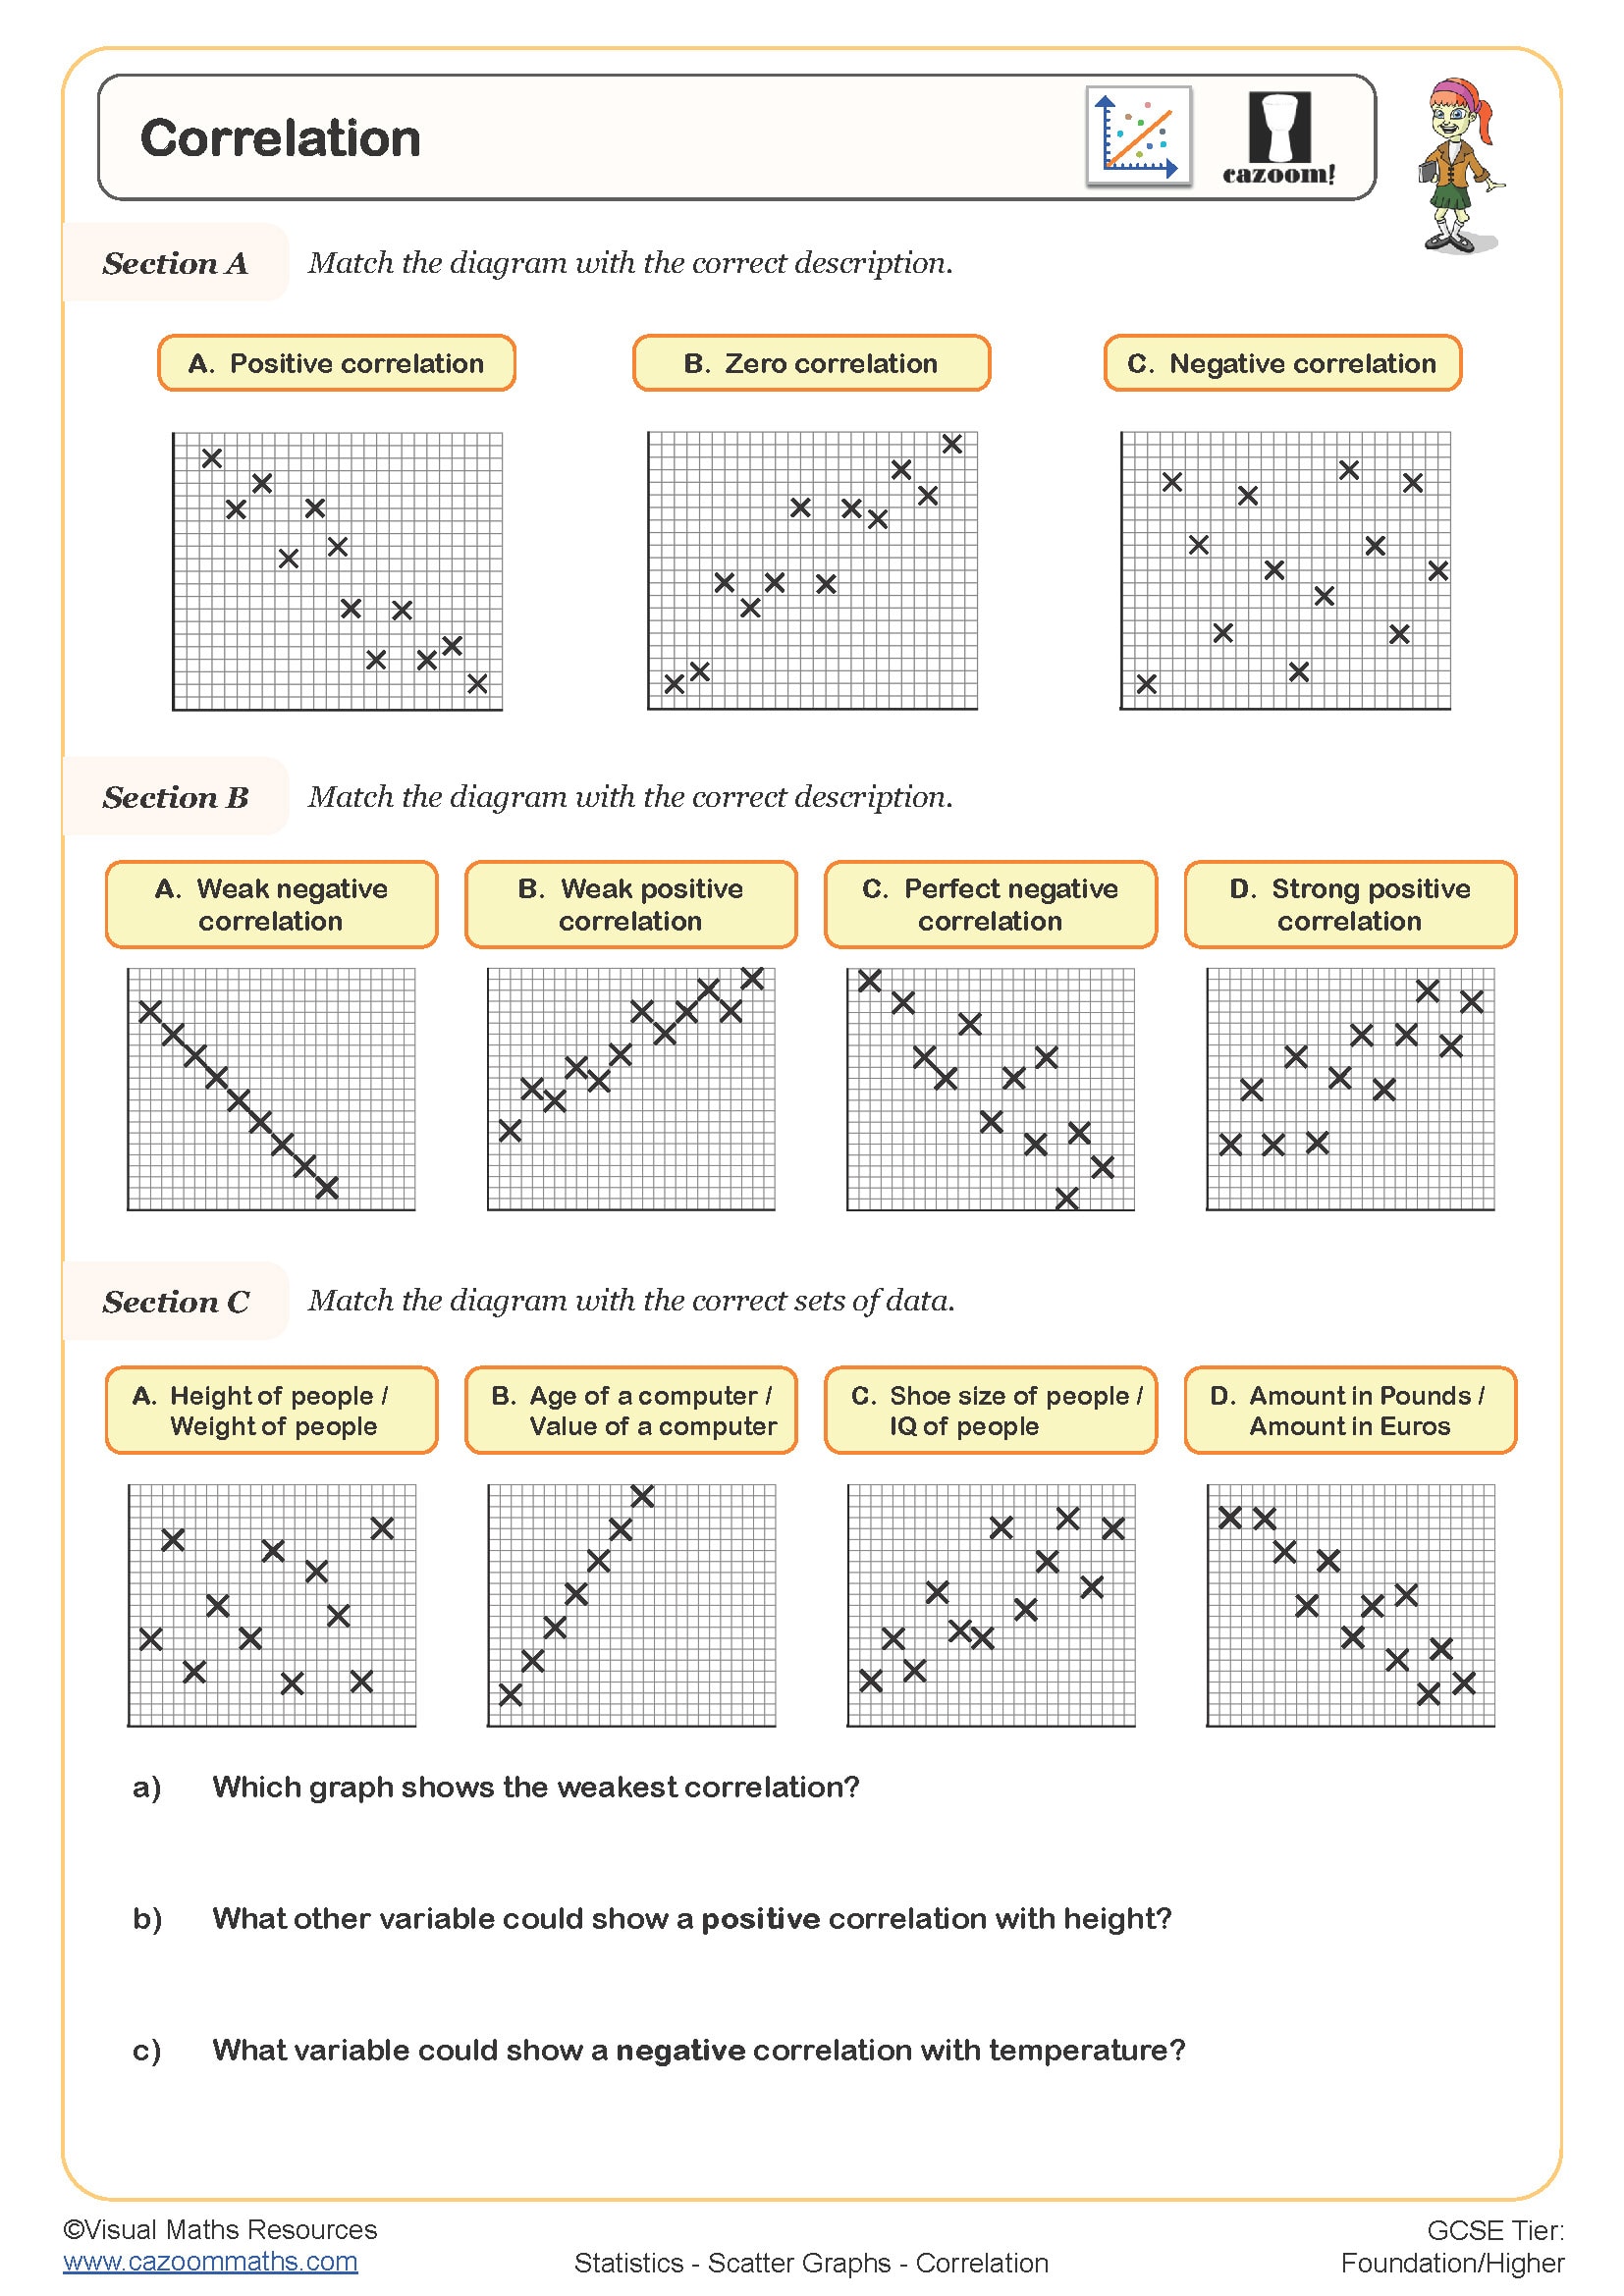
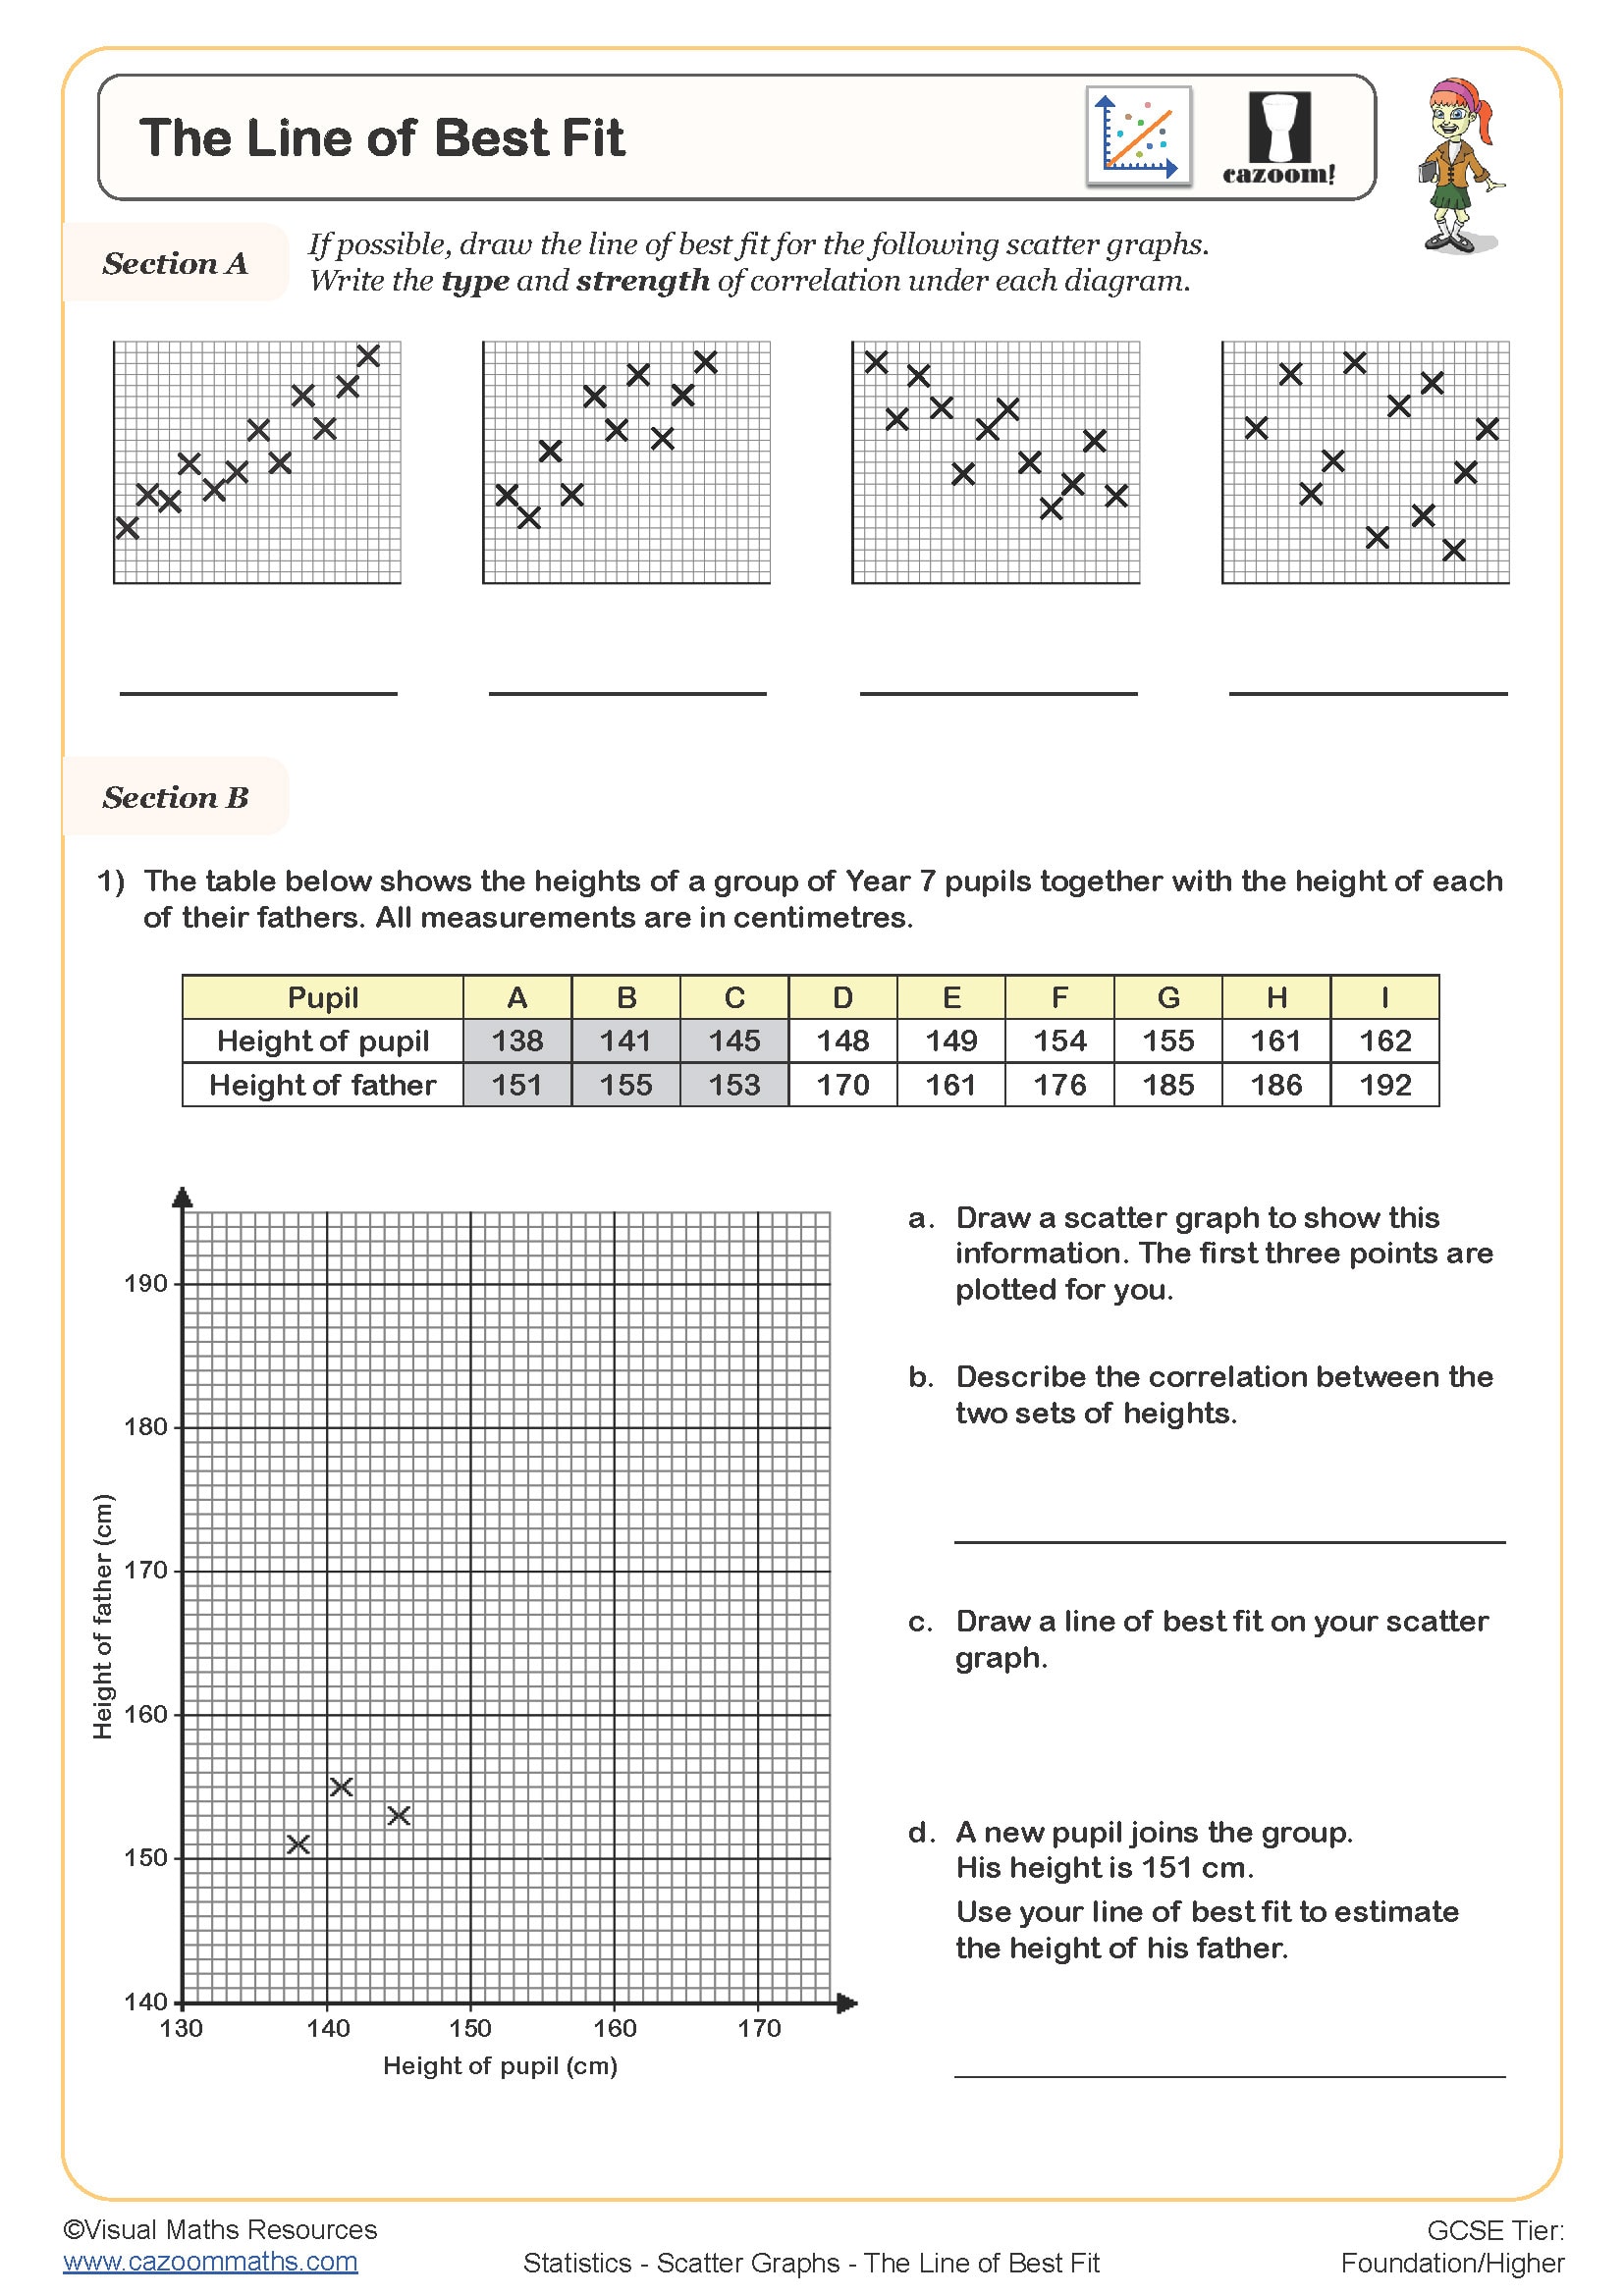
Reading and Drawing Scatter Graphs WORKSHEET
Suitable for Year groups: Year 7, Year 8
GCSE Tier: Foundation/Higher
Targeting grades: 4-5
Prerequisite knowledge: Coordinates, type of data.
Learning Objective: Describe simple mathematical relationships between two variables (bivariate data) in observational and experimental contexts and illustrate using scatter graphs.
Reading and Drawing Scatter Graphs WORKSHEET DESCRIPTION
Use this worksheet alongside Correlation and The Line of Best Fit. This worksheet provides consolidation of reading and plotting coordinates for scatter graphs and describing the relationship presented in the bivariate data.
All worksheets are created by the team of experienced teachers at Cazoom Maths.

RELATED TO Reading and Drawing Scatter Graphs WORKSHEET
Frequently Asked Questions
This worksheet is designed for Year 7 and Year 8 students who are developing their understanding of bivariate data representation. It's particularly effective for pupils who have already mastered basic coordinate plotting and understand different types of data, as these form the essential prerequisite knowledge for working with scatter graphs.