The Line of Best Fit WORKSHEET
The Line of Best Fit WORKSHEET DESCRIPTION
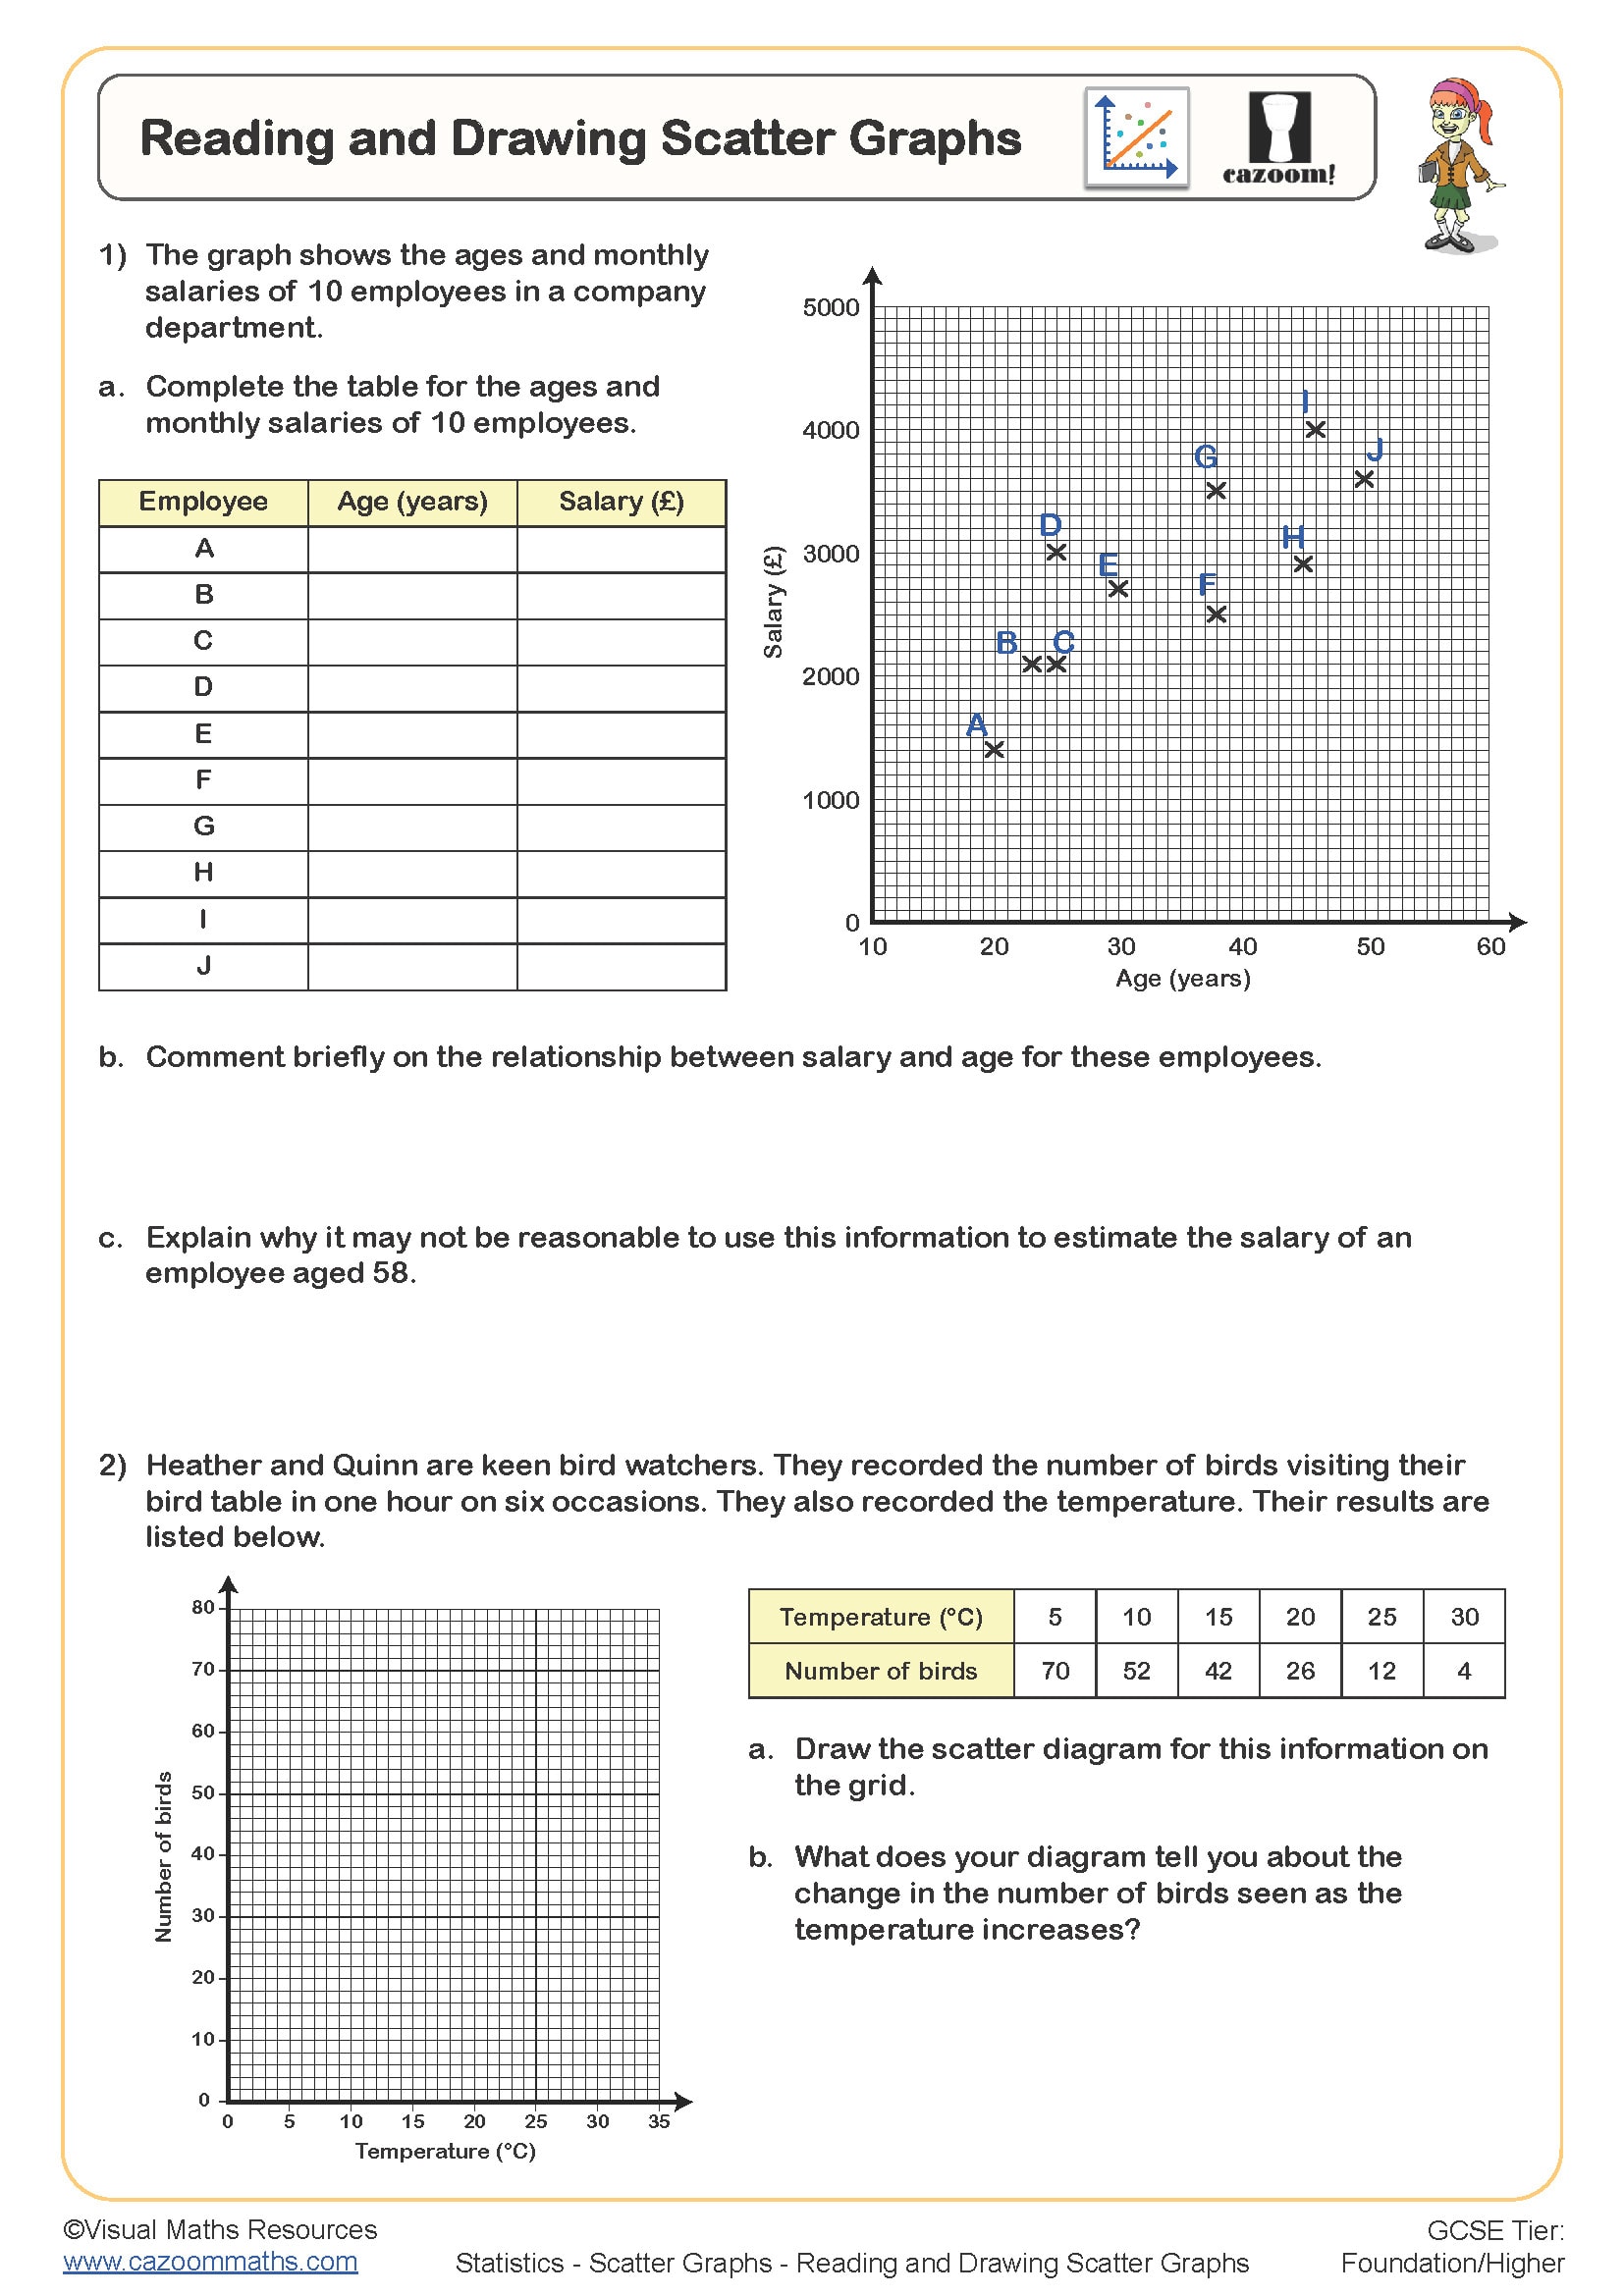
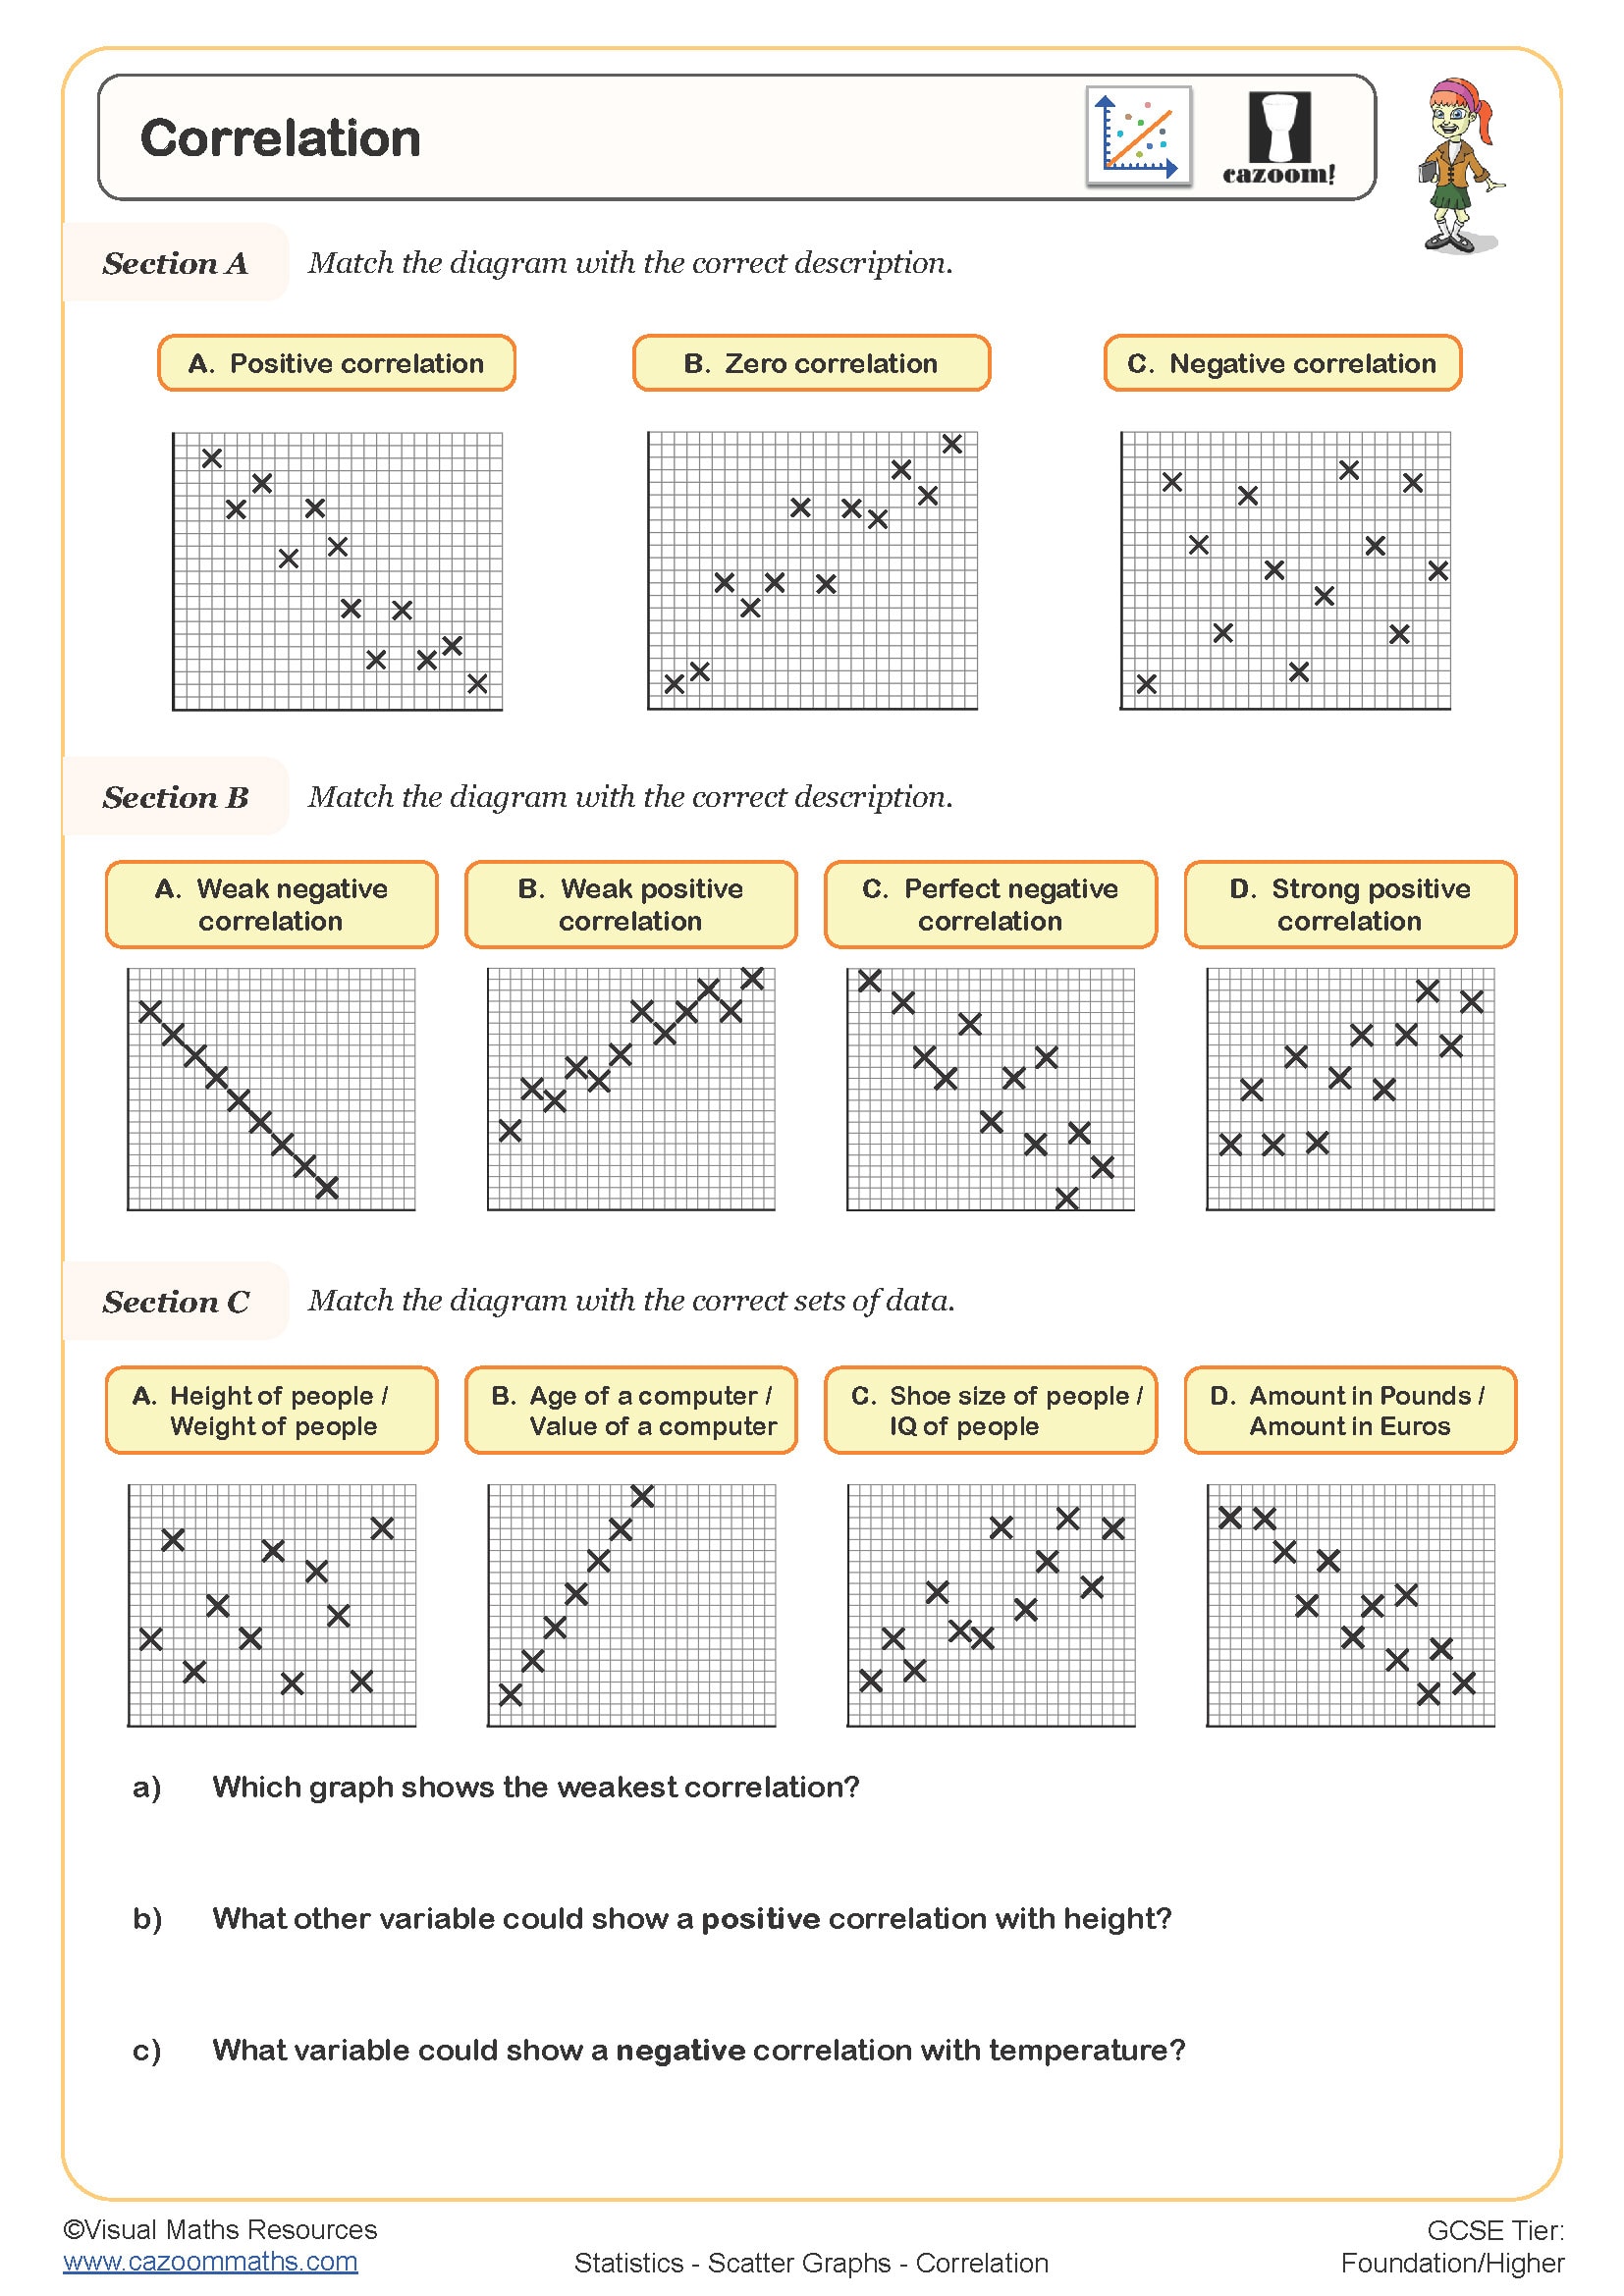
Use this worksheet alongside Reading and Drawing Scatter Graphs and Correlation. This worksheet provides an opportunity for learners to practise the skill of drawing and reading from and line of best fit.
Section A gives four scatter graphs to describe the correlation.
Section B then requires learners to plot some bivariate data, describe the correlation, draw a line of best fit and then use that line to estimate a value.
Section C provides a completed scatter graph and asks for a description of the relationship, a line of best fit and an estimation. There is also an extension task for learners to collect and plot their own data about arm span and hand span.
All worksheets are created by the team of experienced teachers at Cazoom Maths.

RELATED TO The Line of Best Fit WORKSHEET
Frequently Asked Questions
This worksheet is designed for Year 7 and Year 8 students who are developing their understanding of statistical representations. The activities progress from identifying correlation patterns to independently plotting data and making estimations, making it ideal for students in these year groups to build confidence with scatter graphs.