KS3 Probability Worksheets
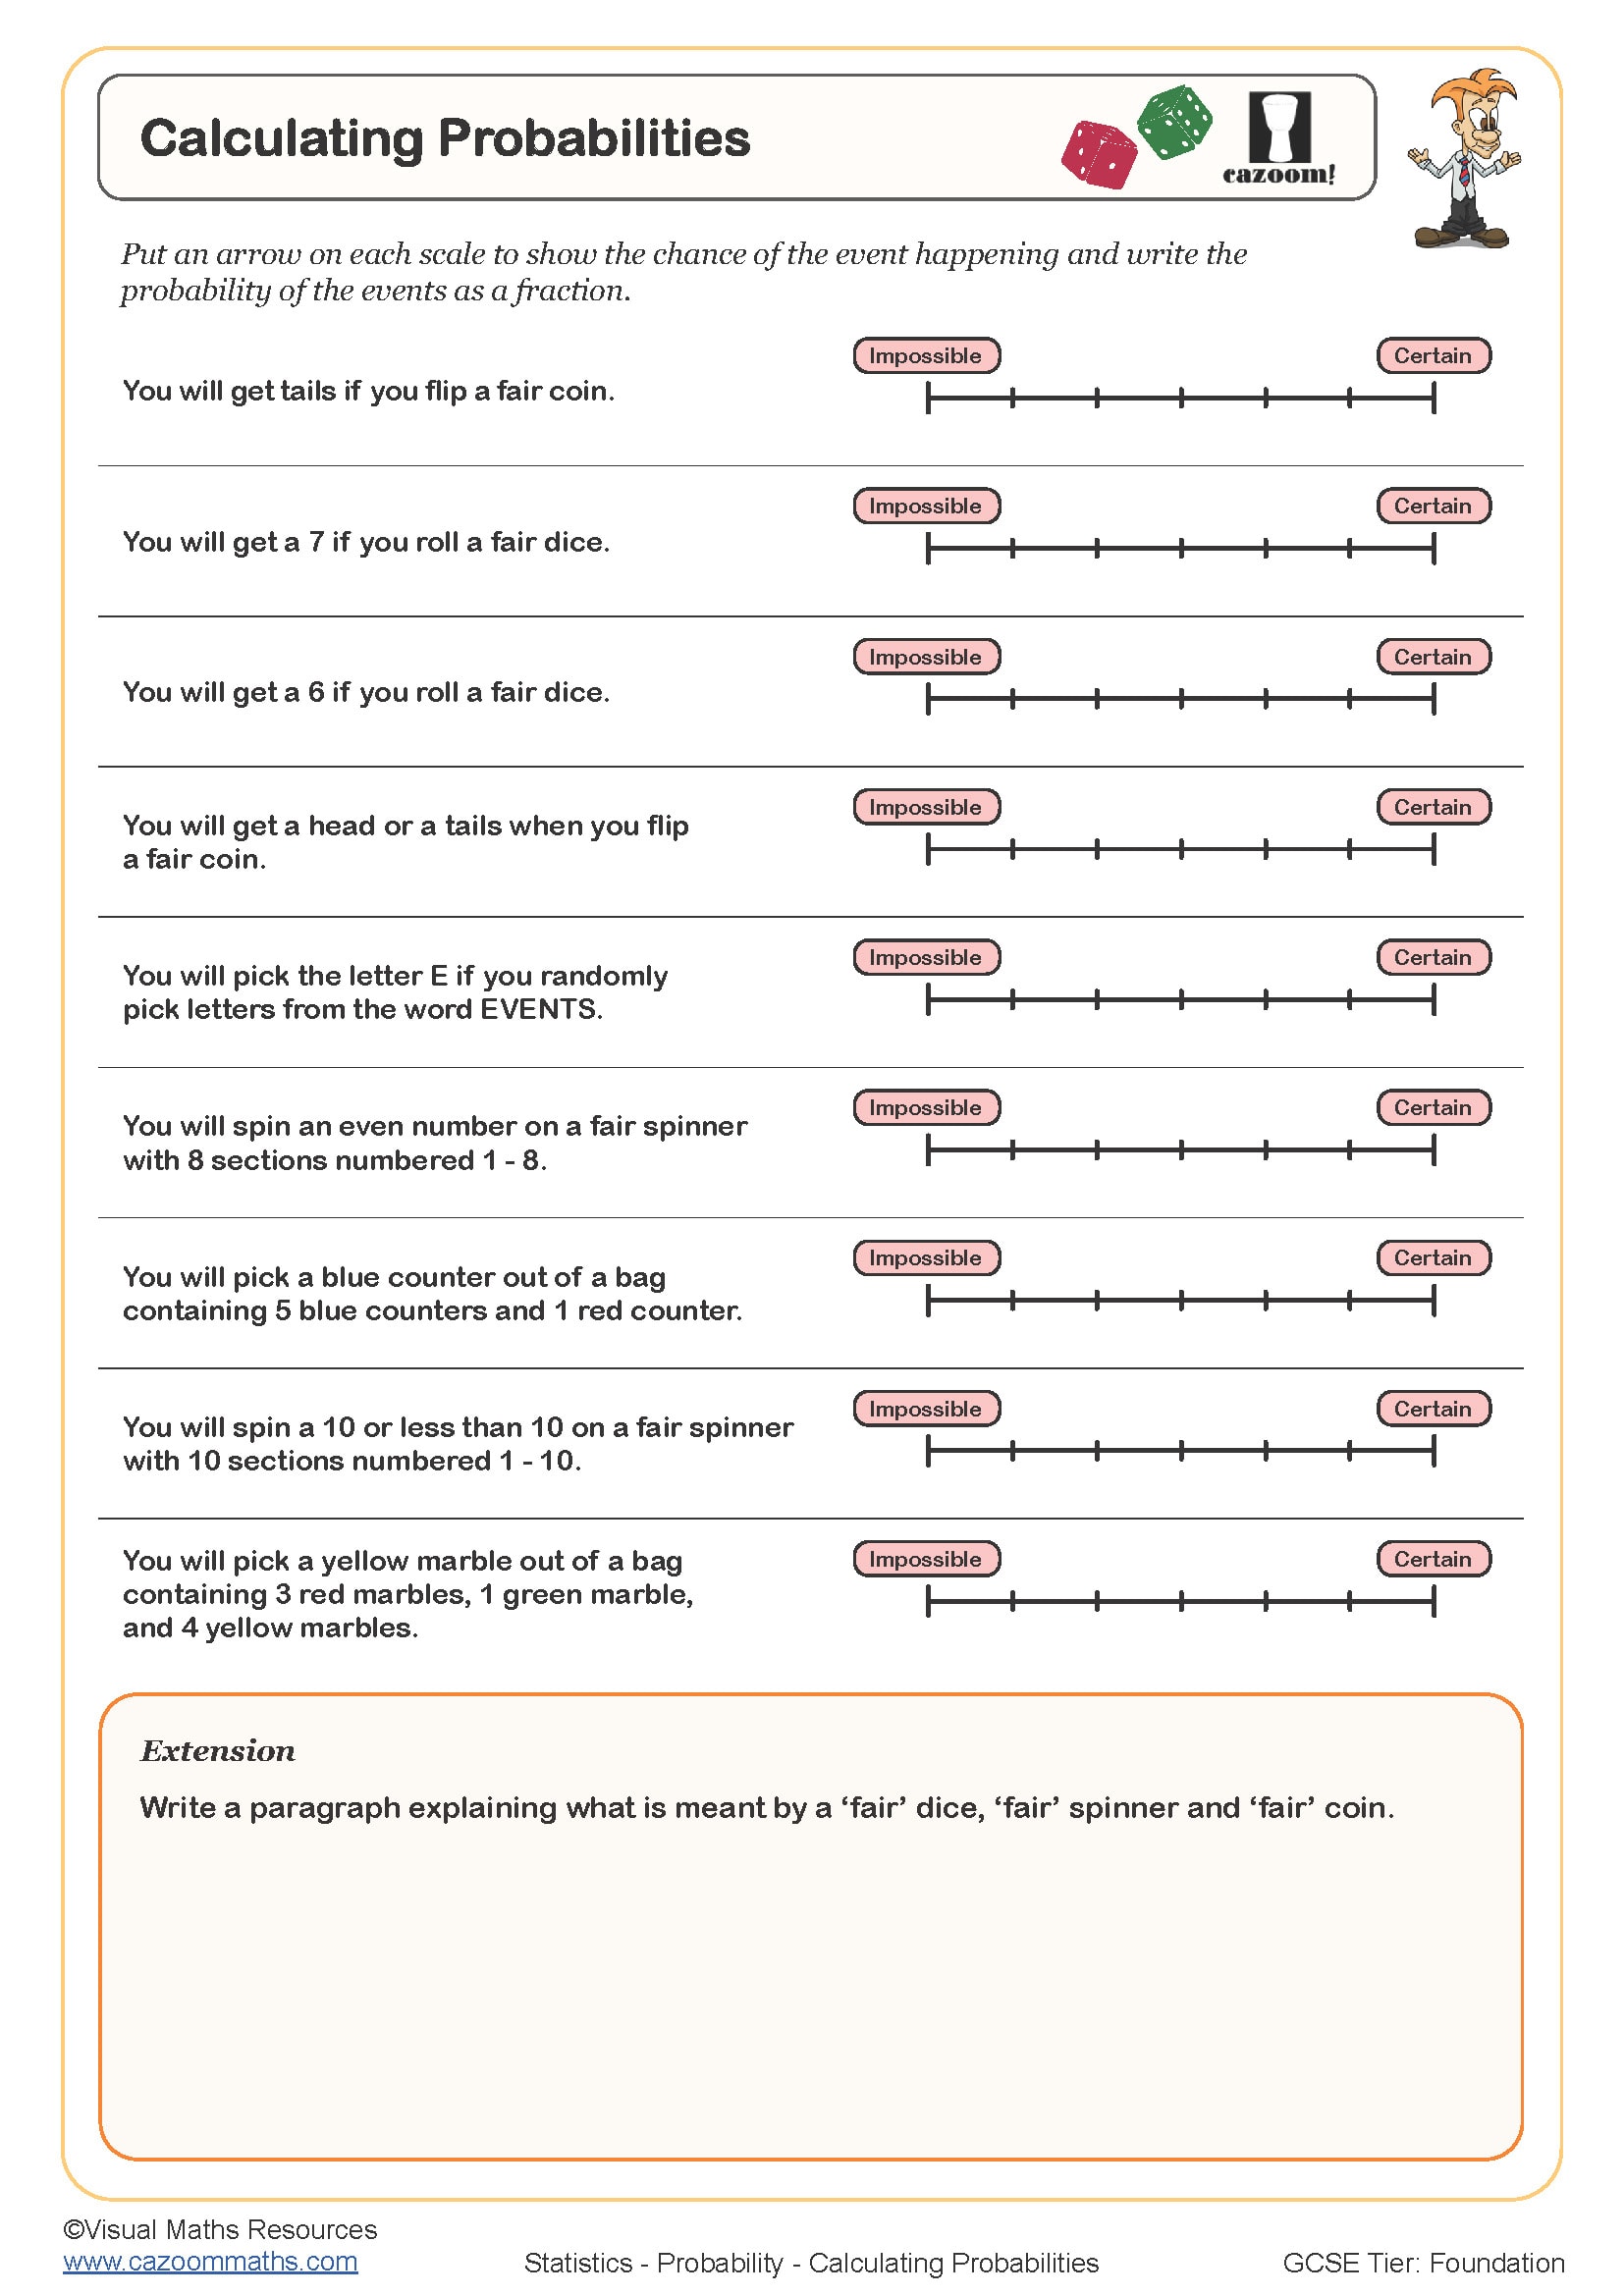
Calculating Probabilities
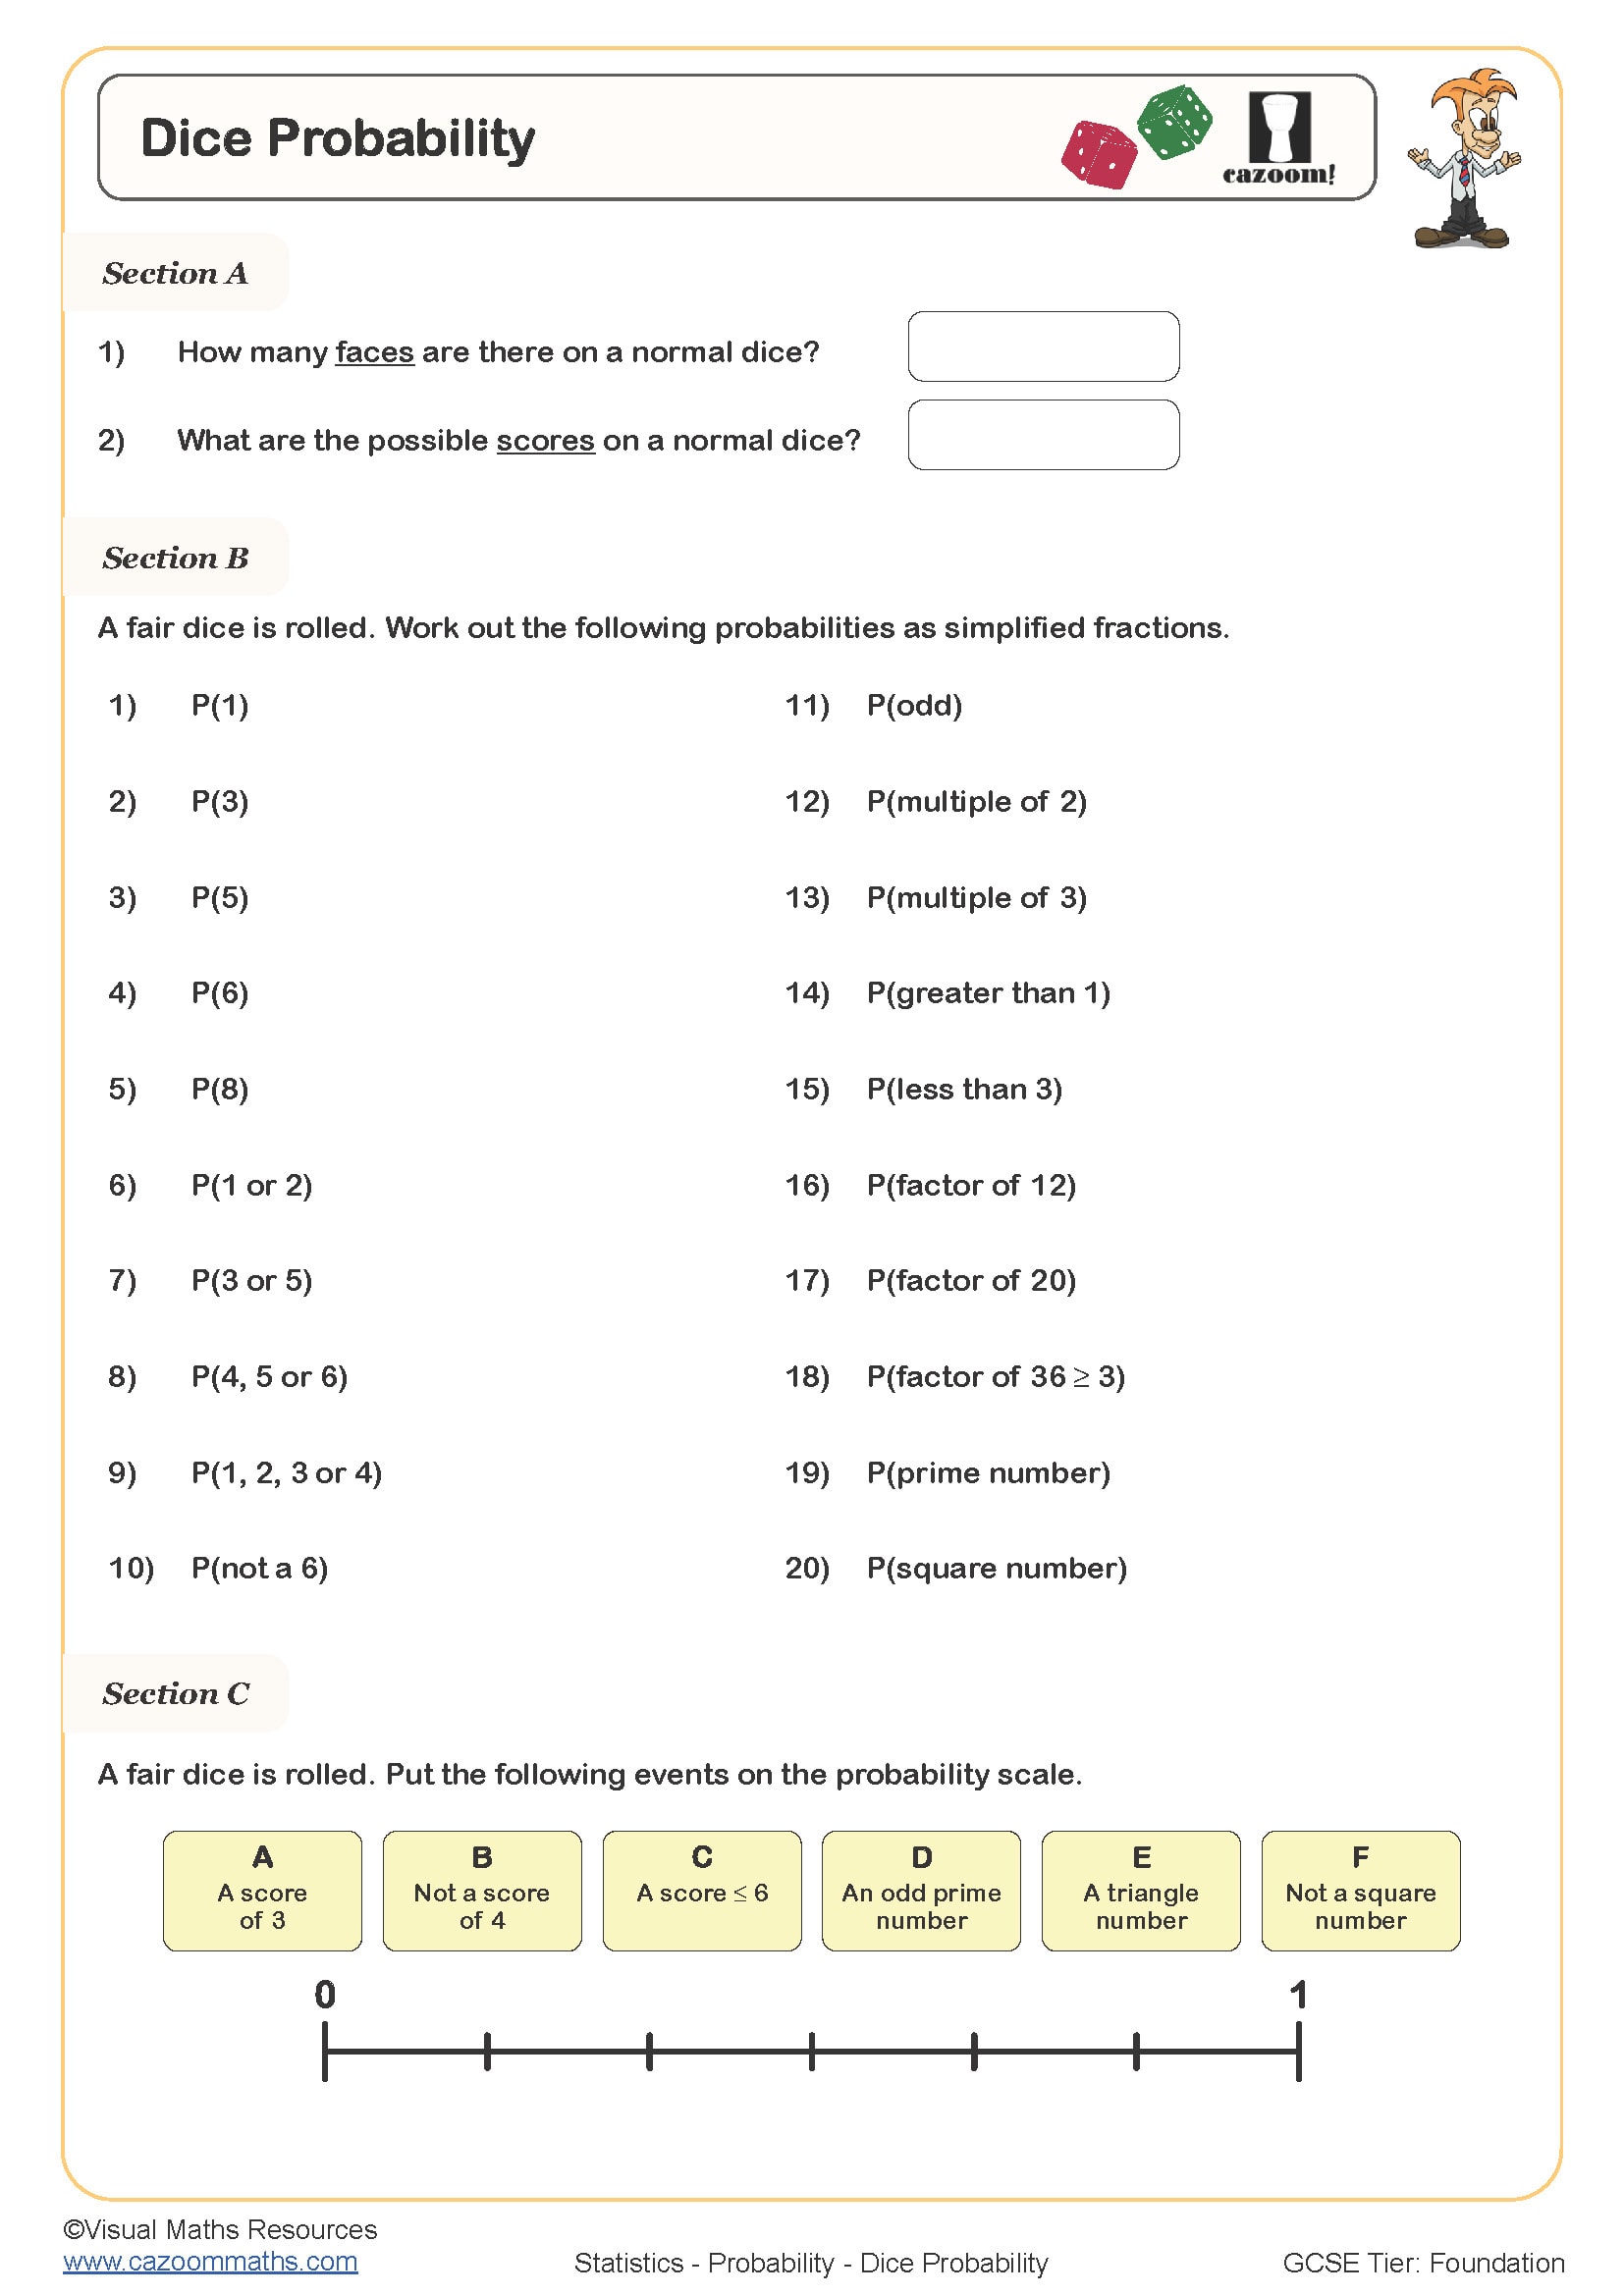
Dice Probability
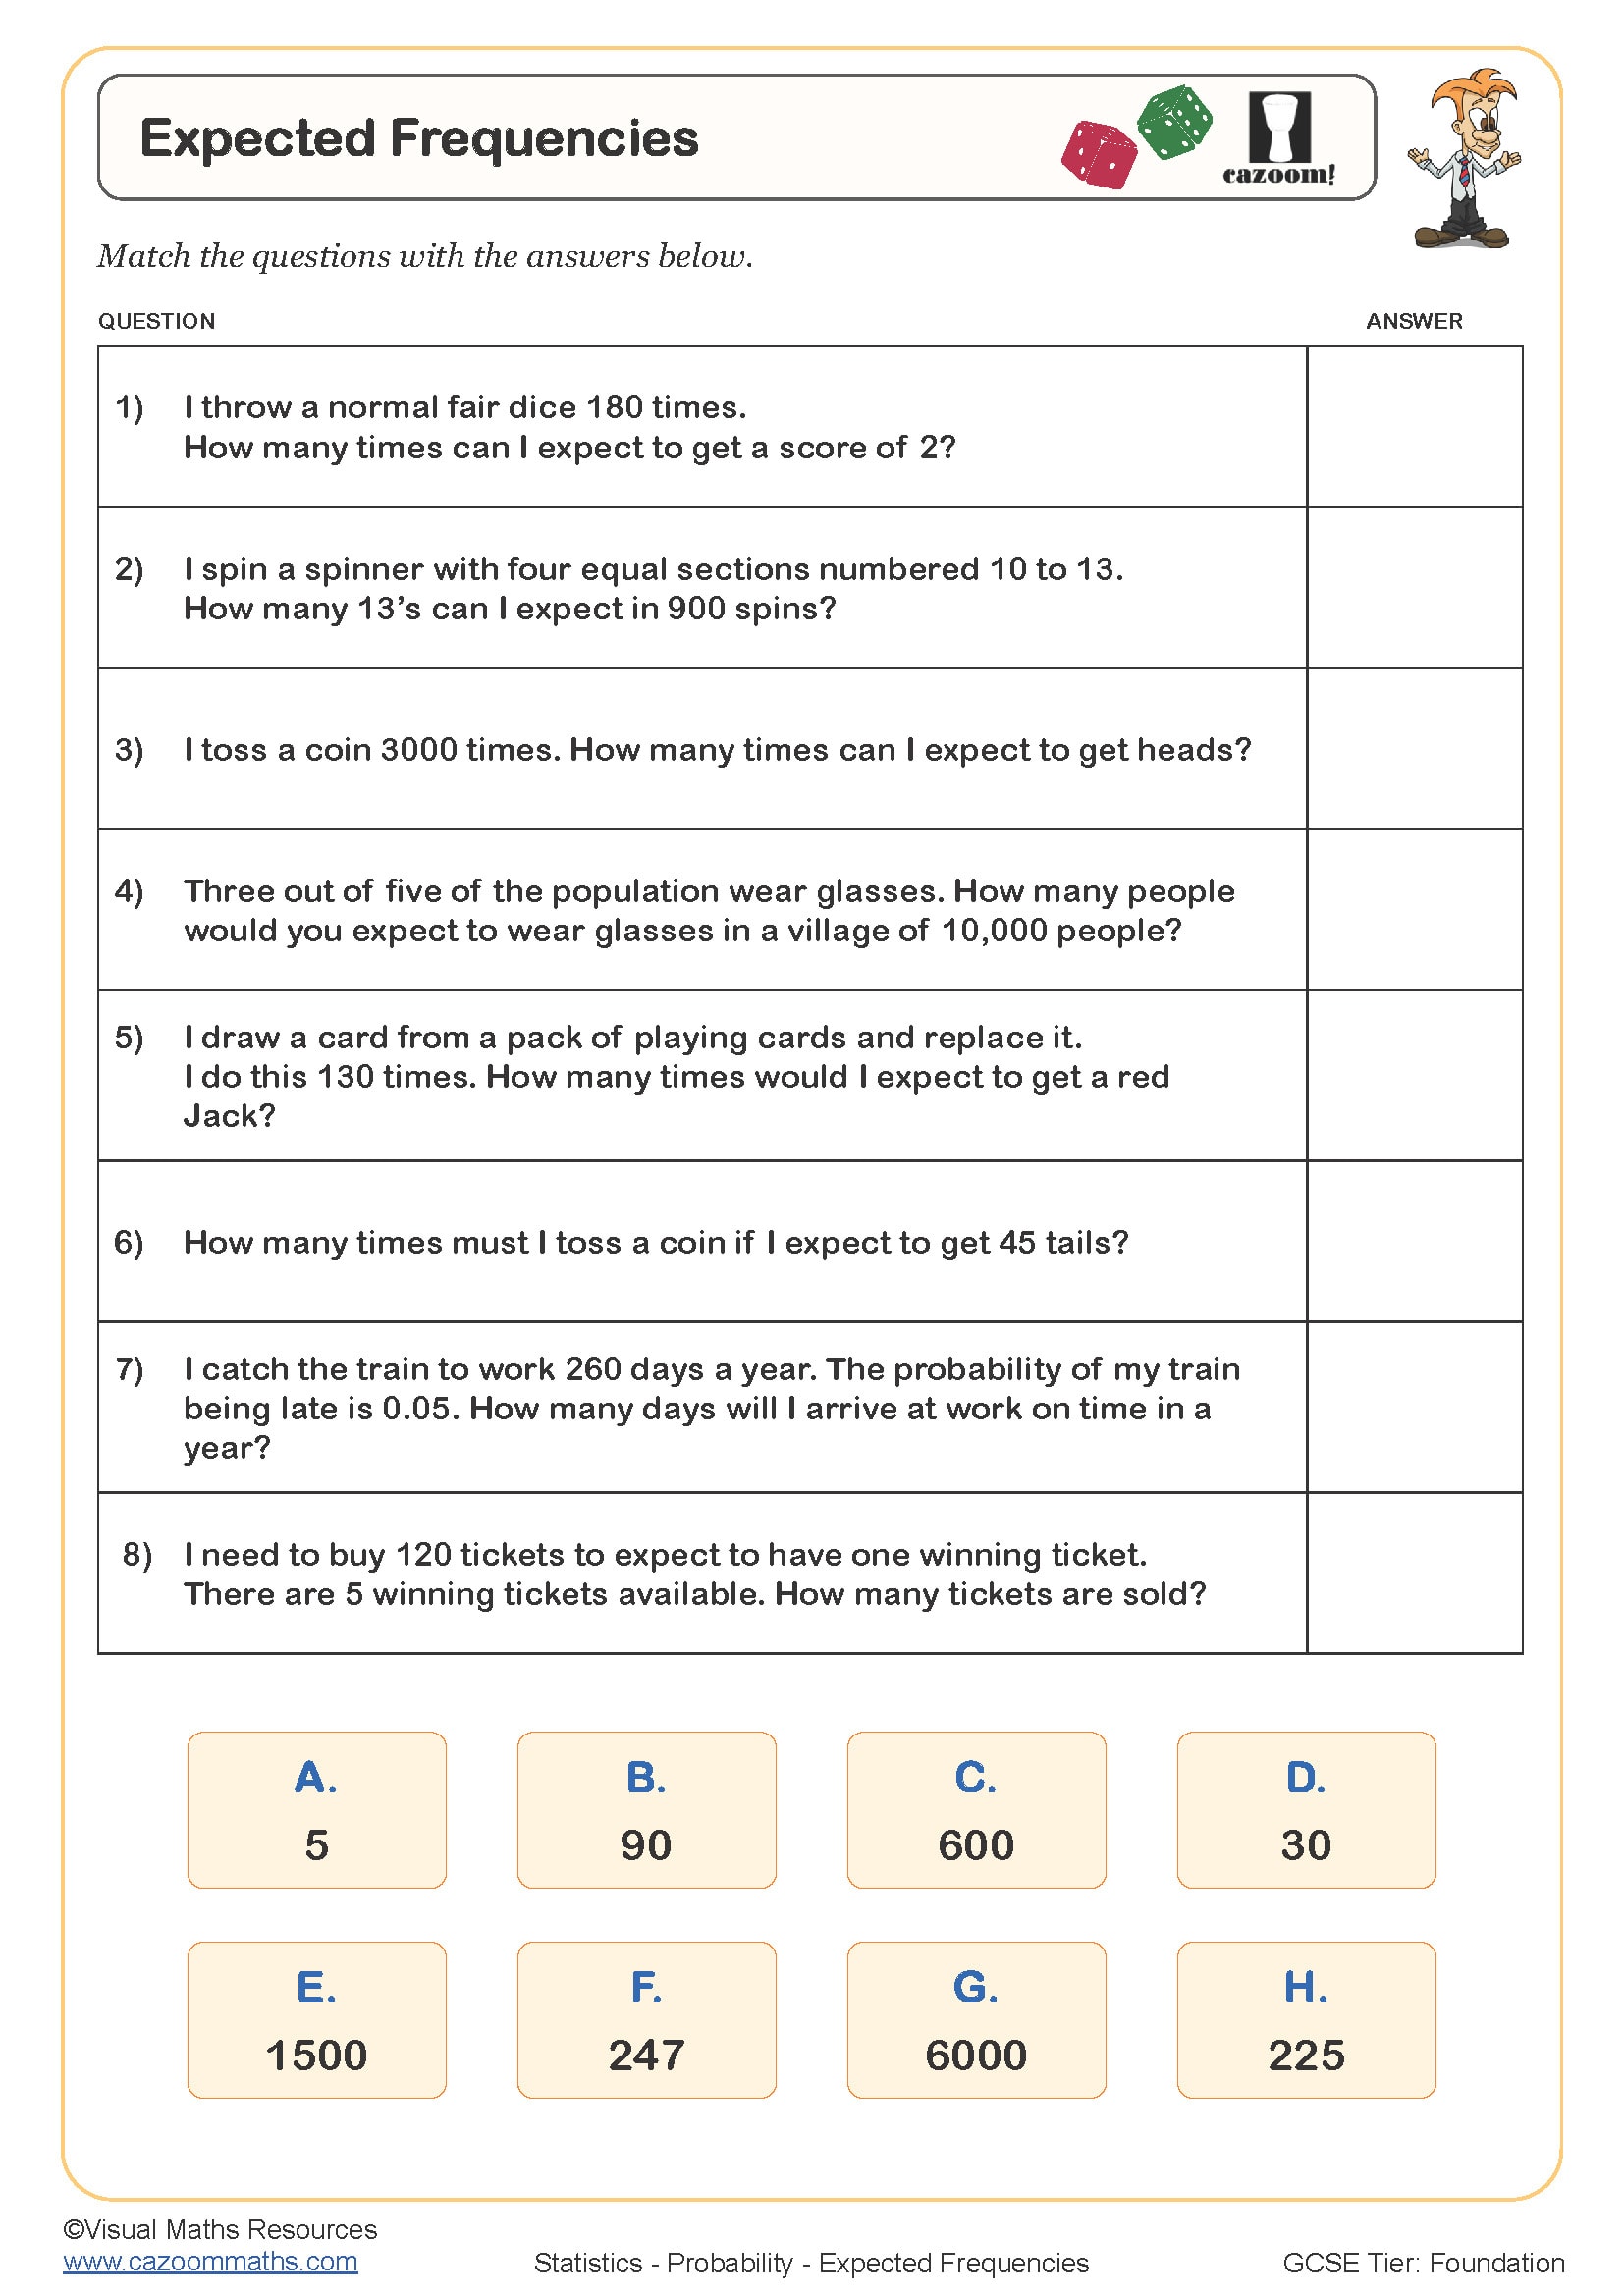
Expected Frequencies
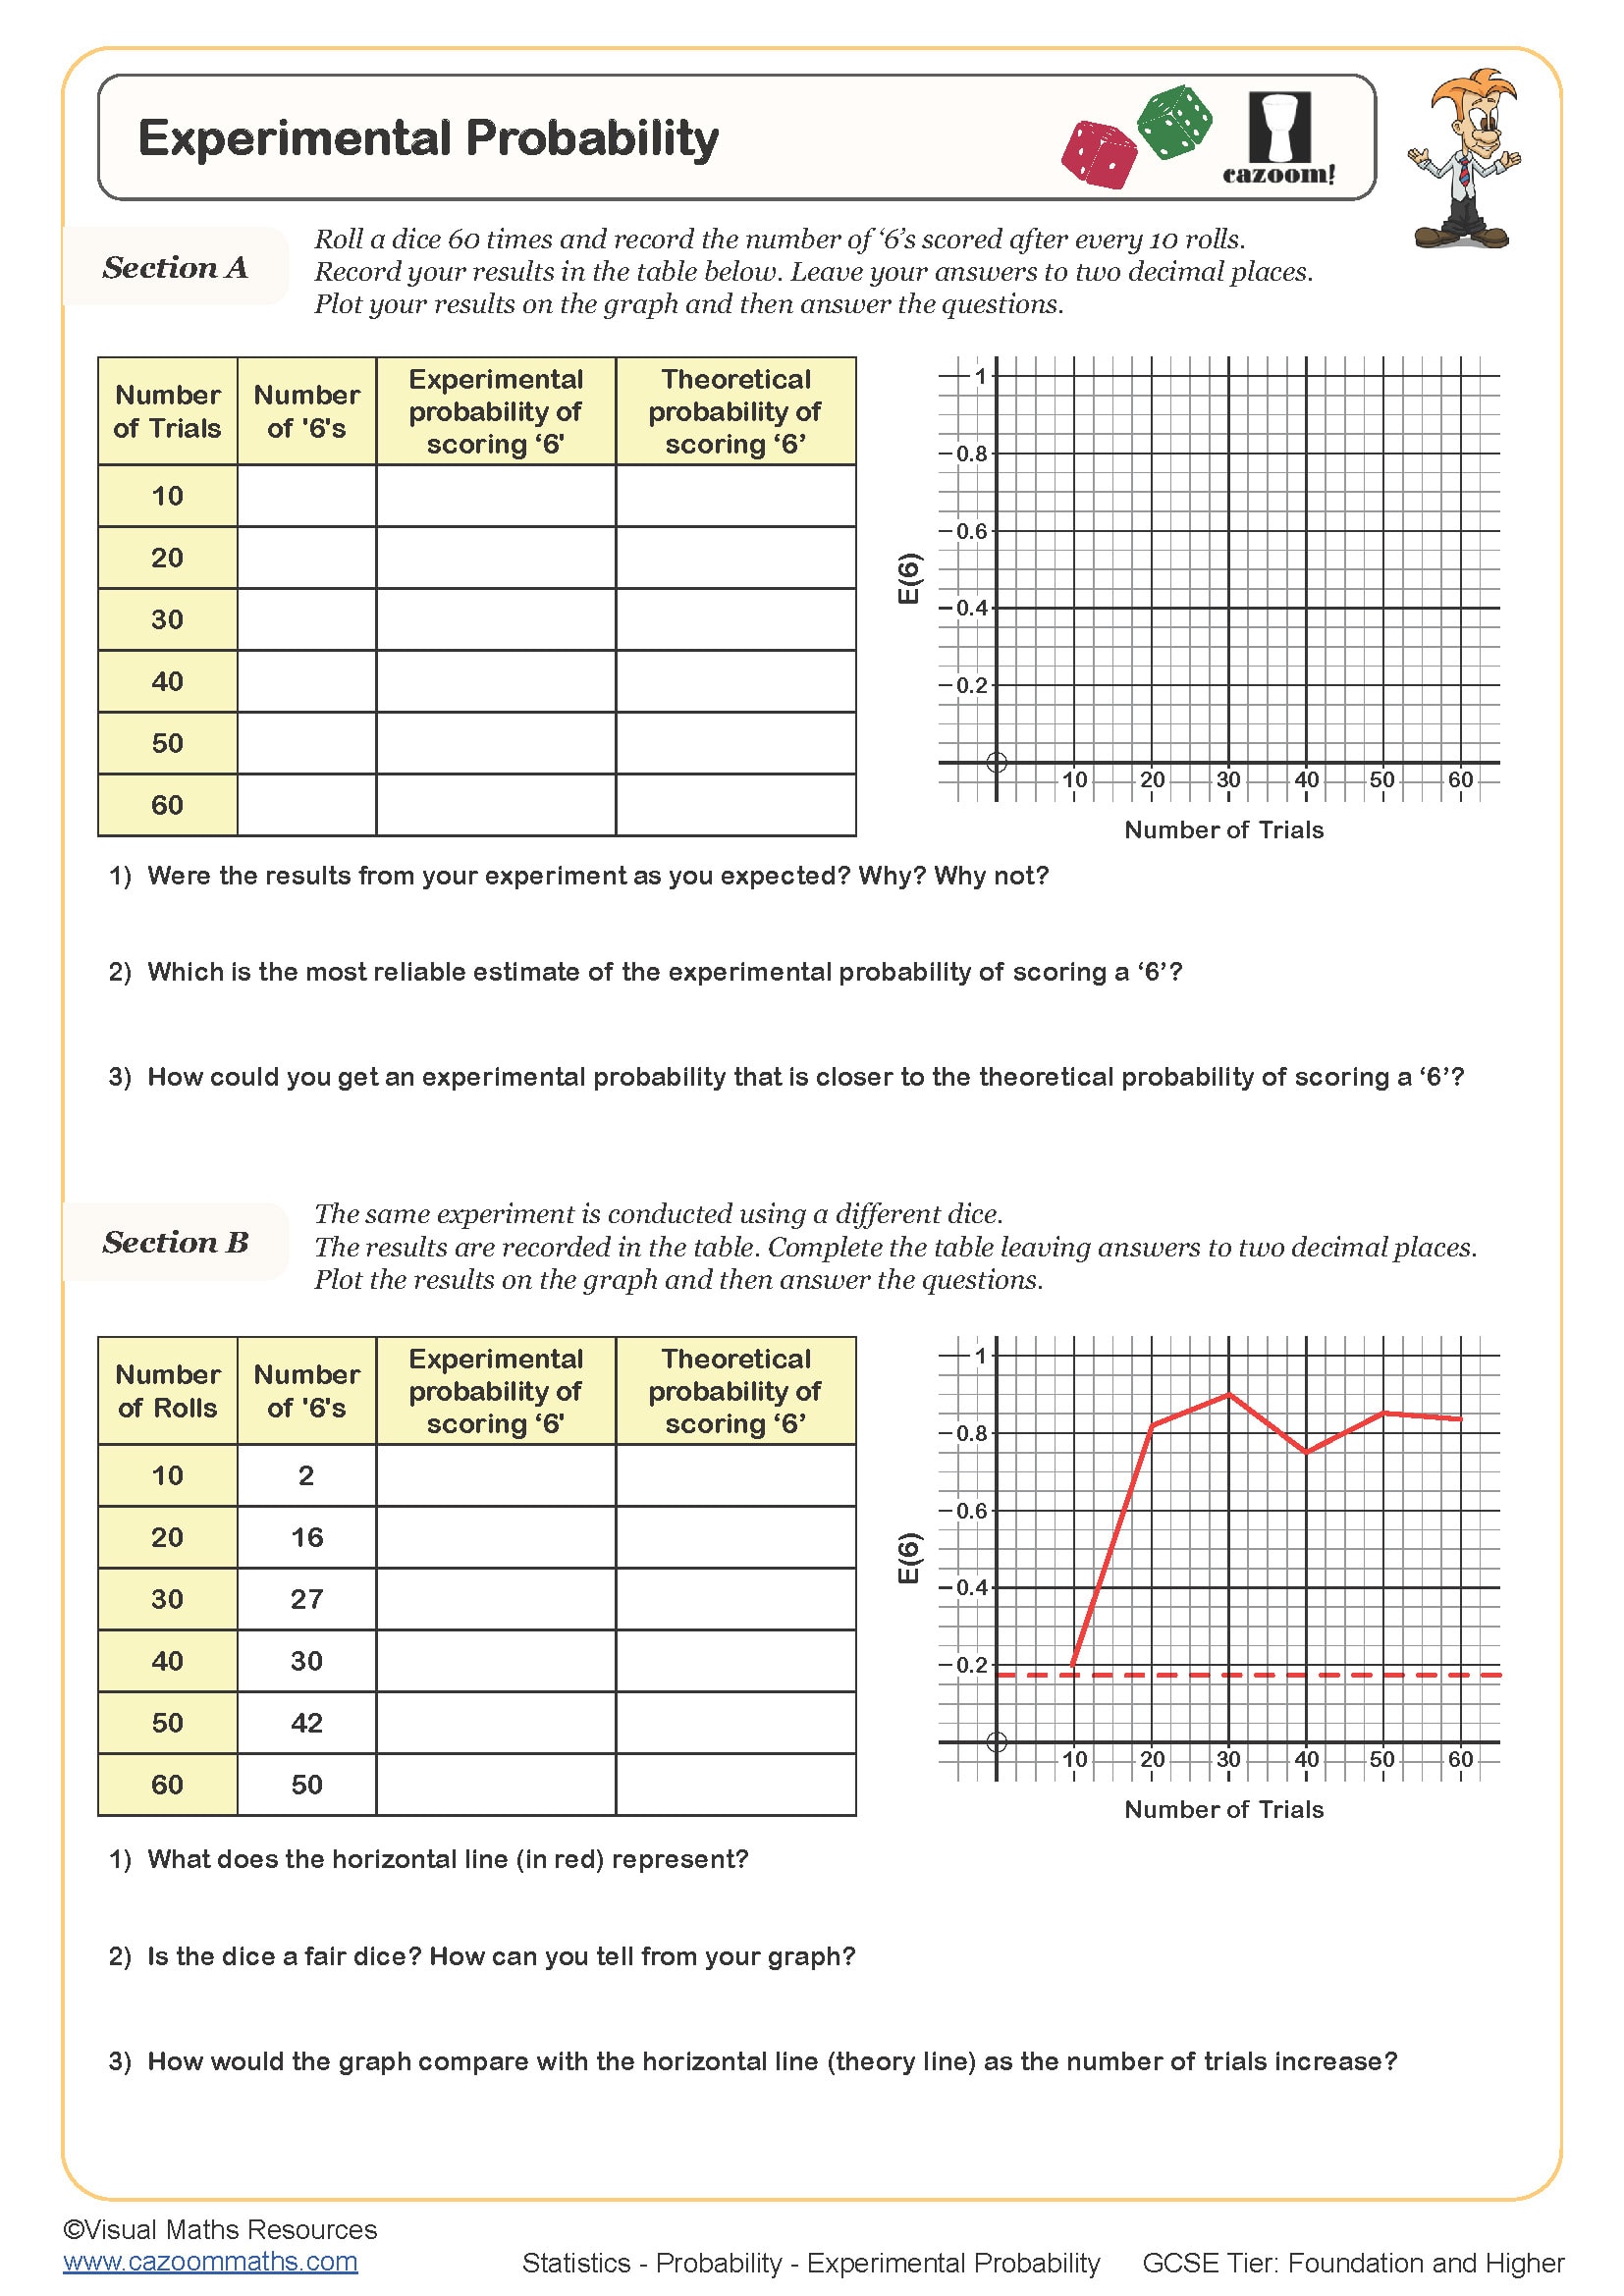
Experimental Probability
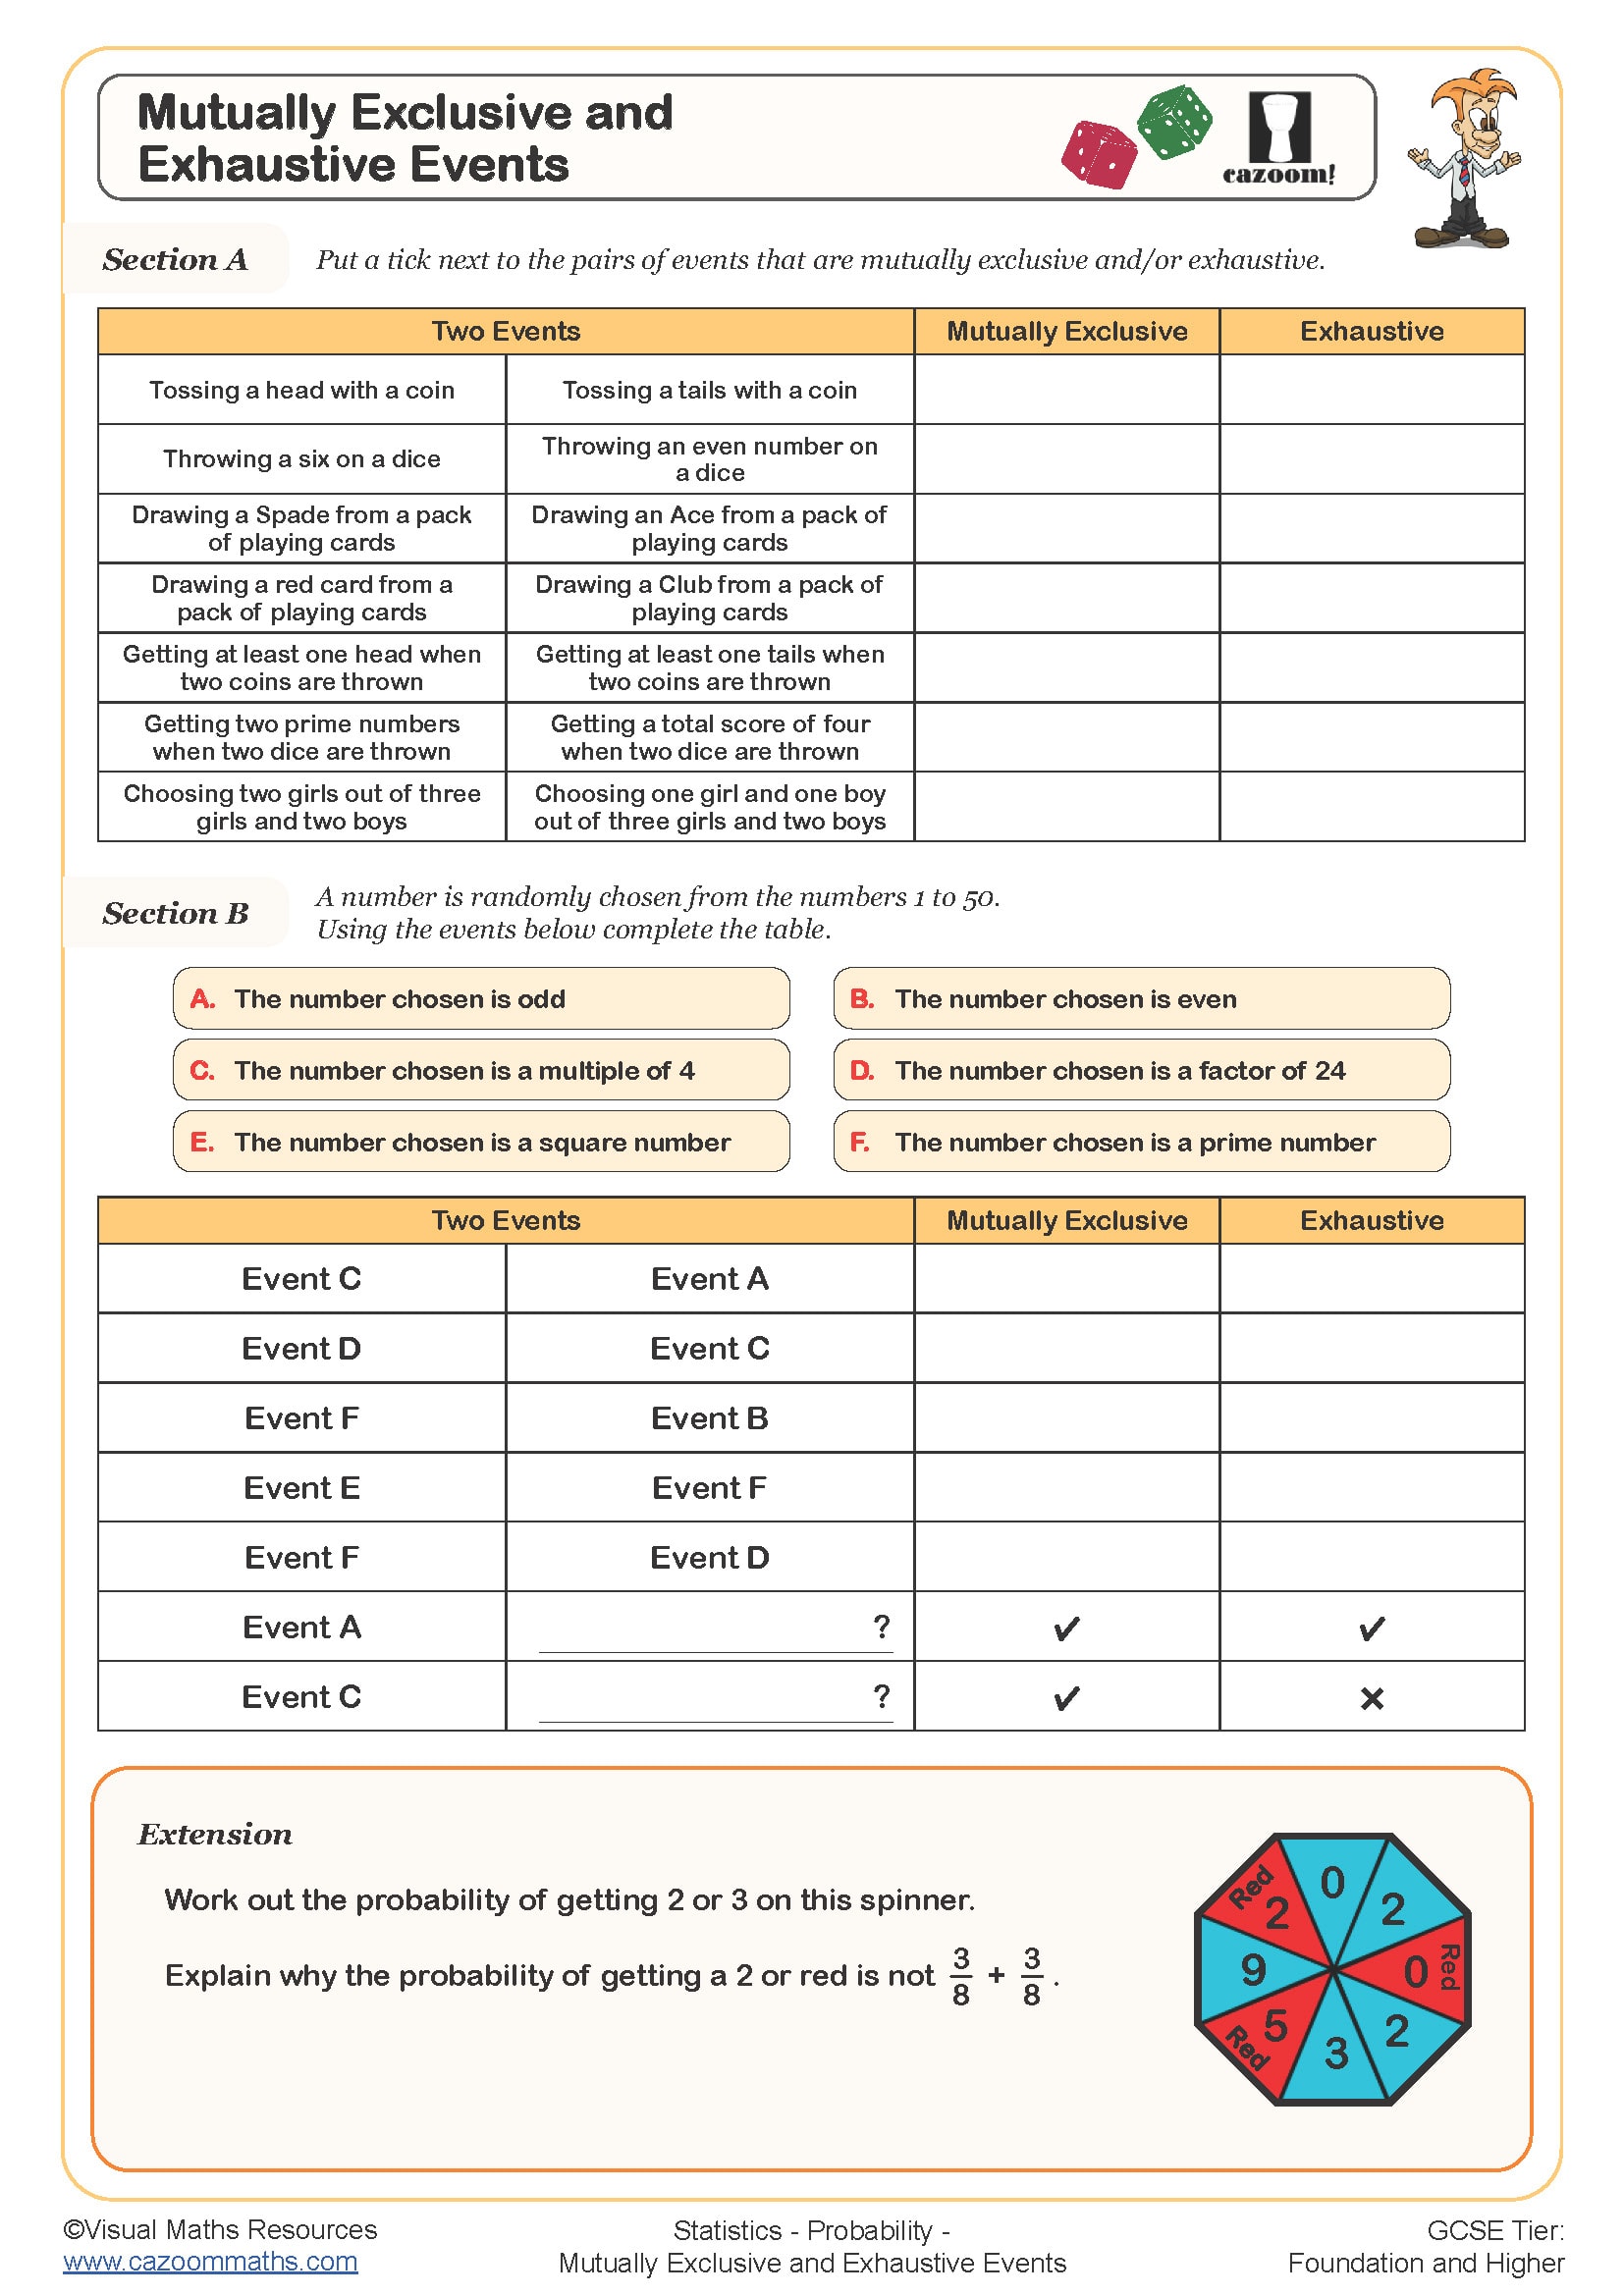
Mutually Exclusive and Exhaustive Events
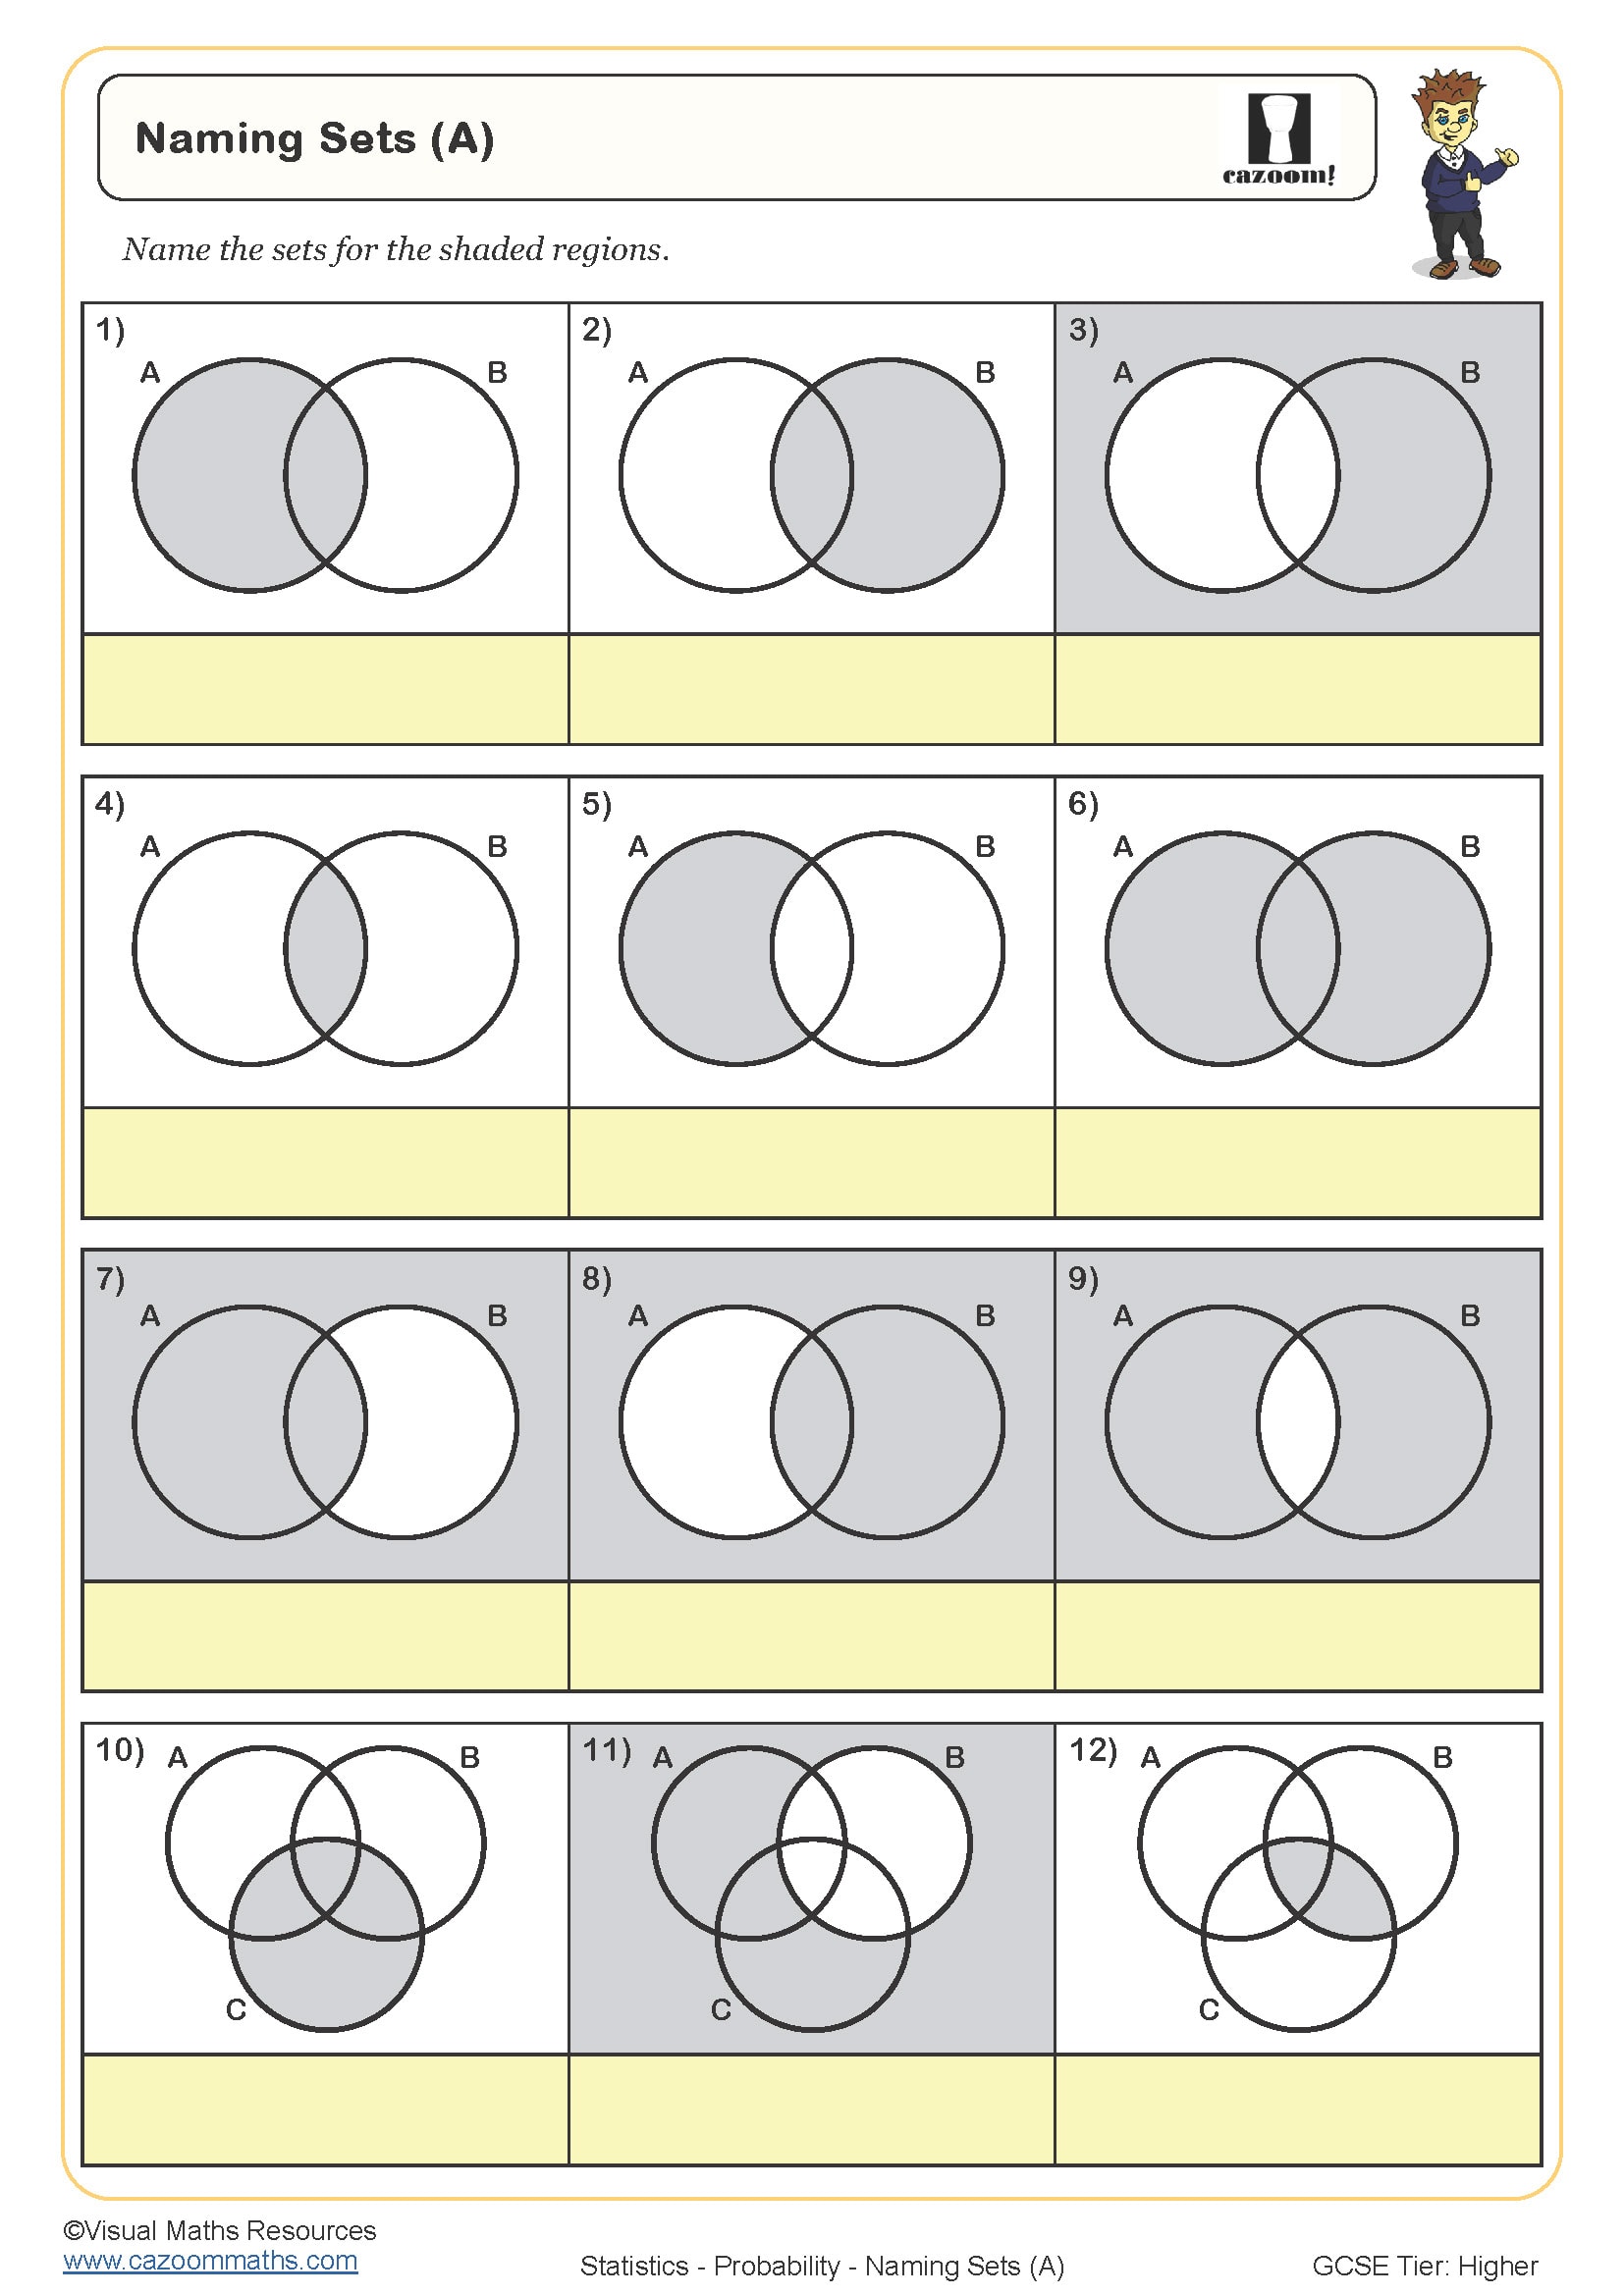
Naming Sets (A)
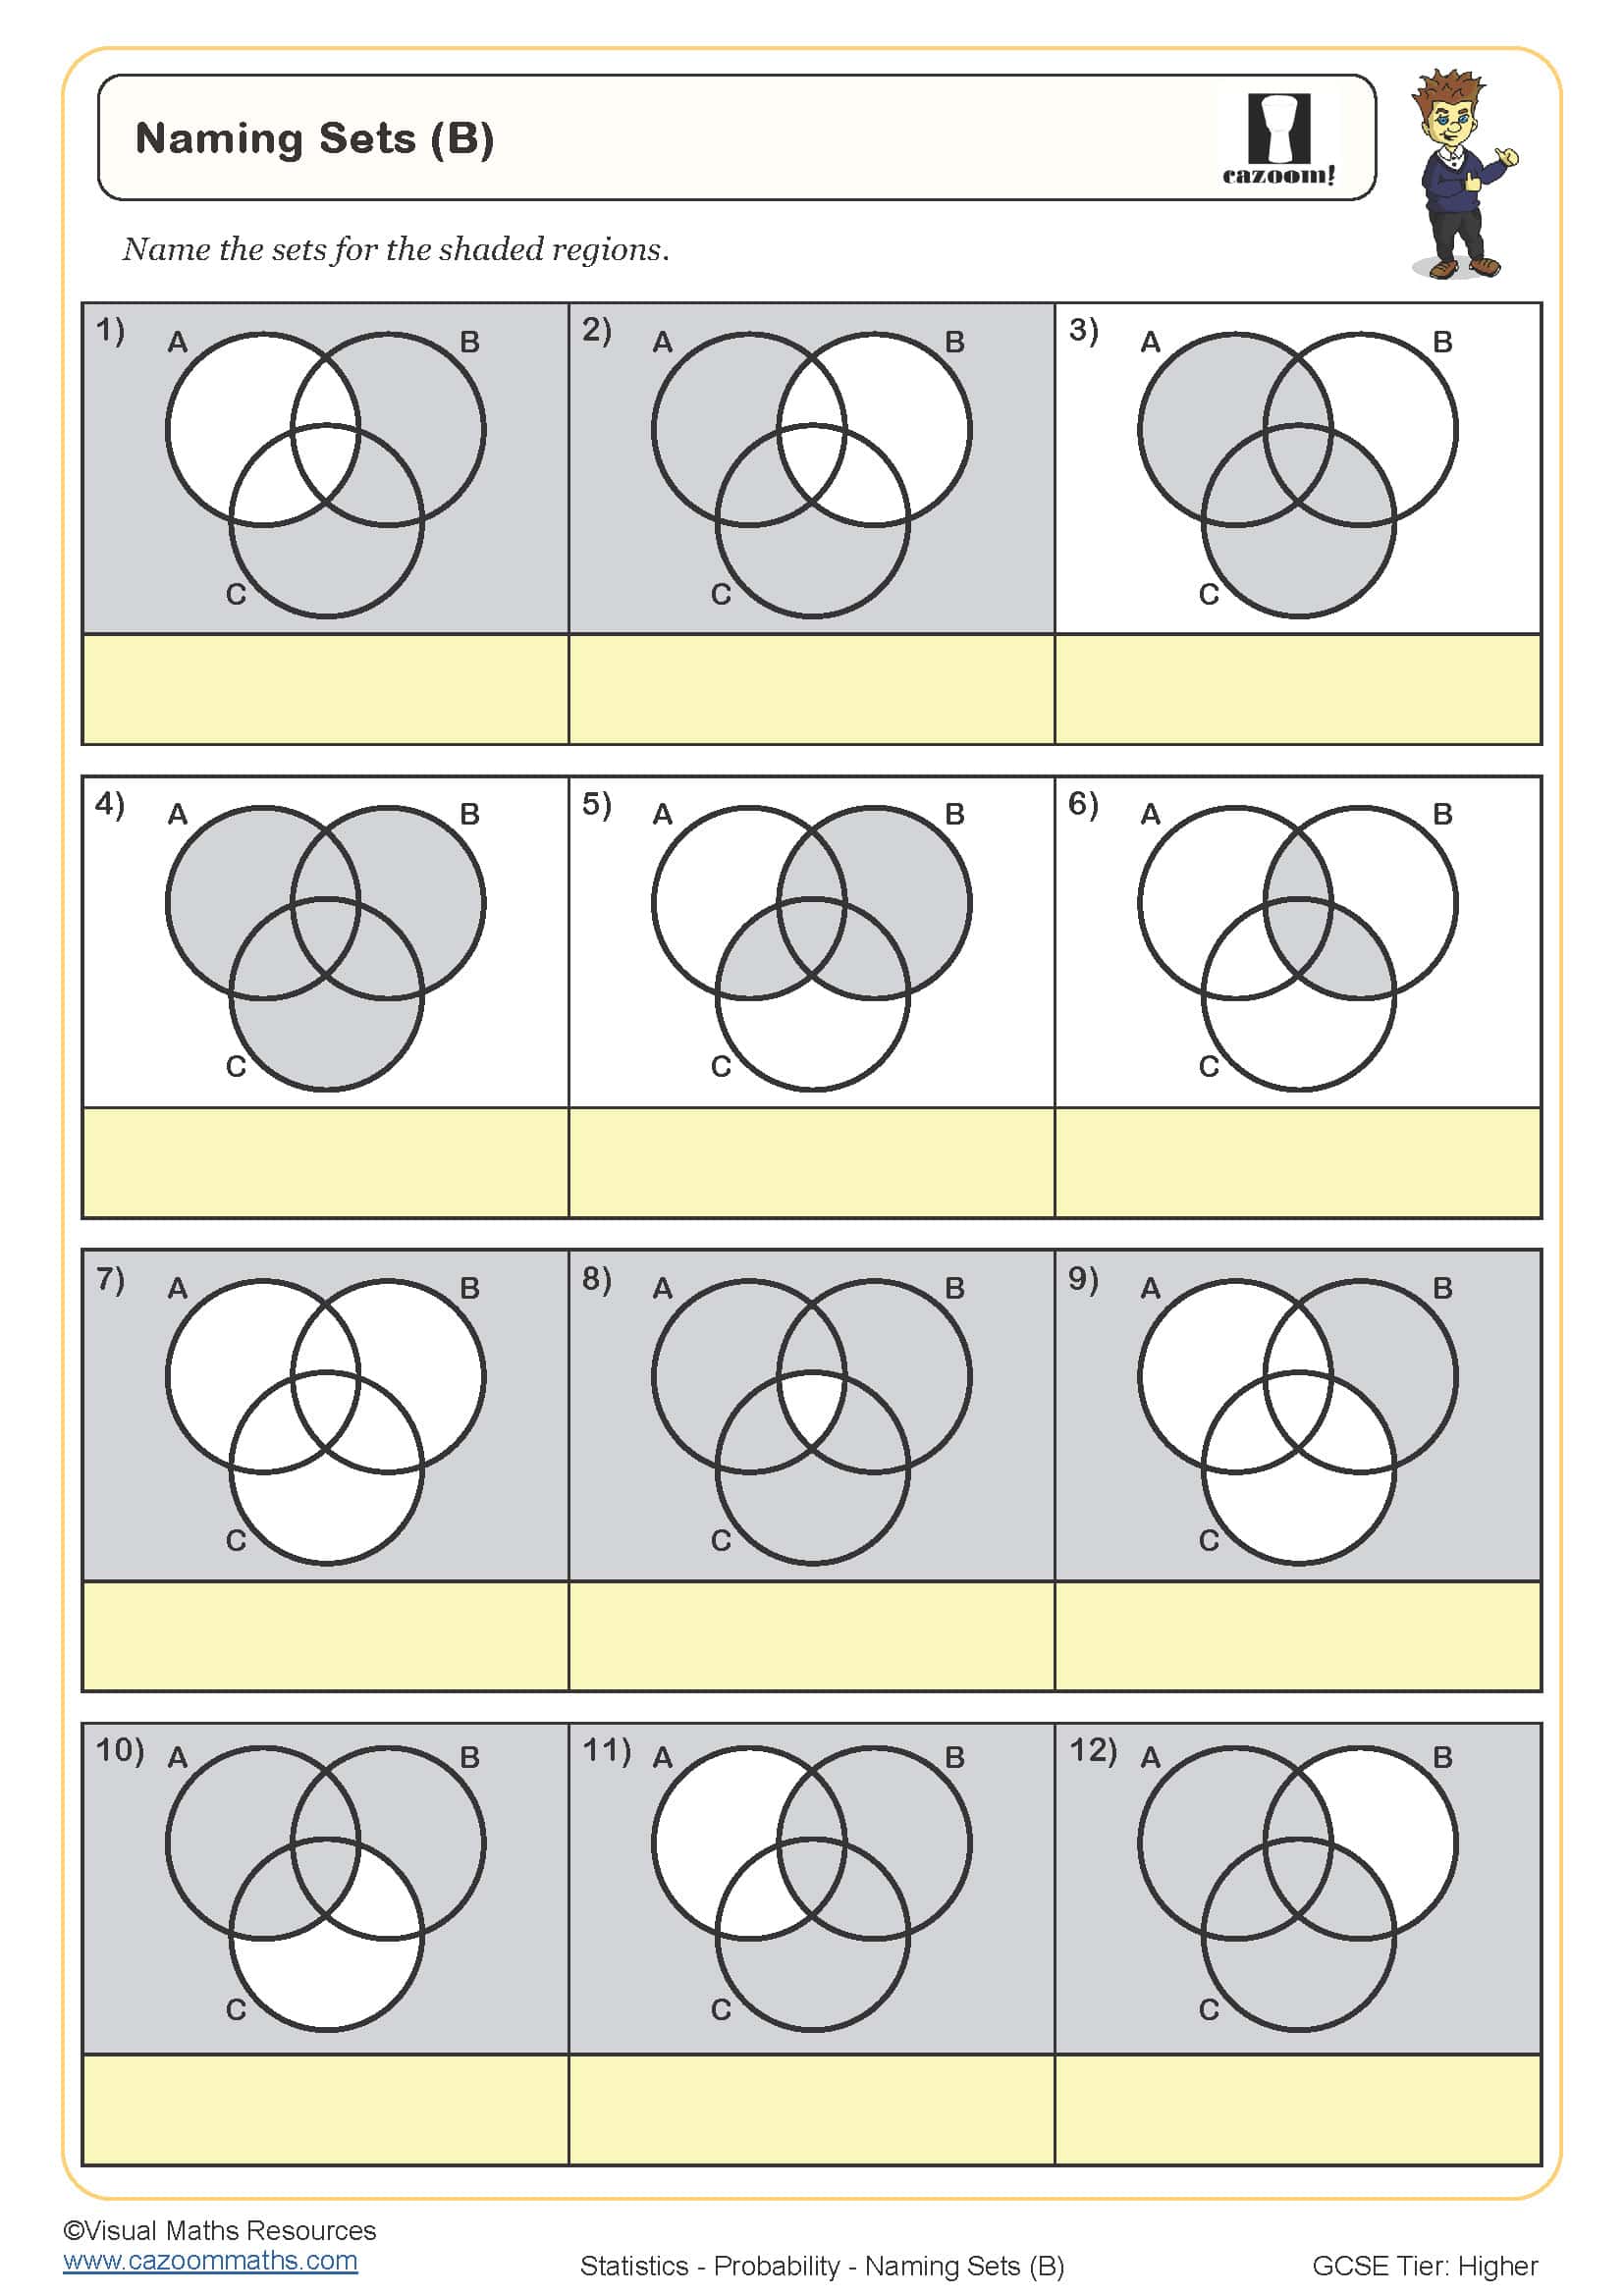
Naming Sets (B)
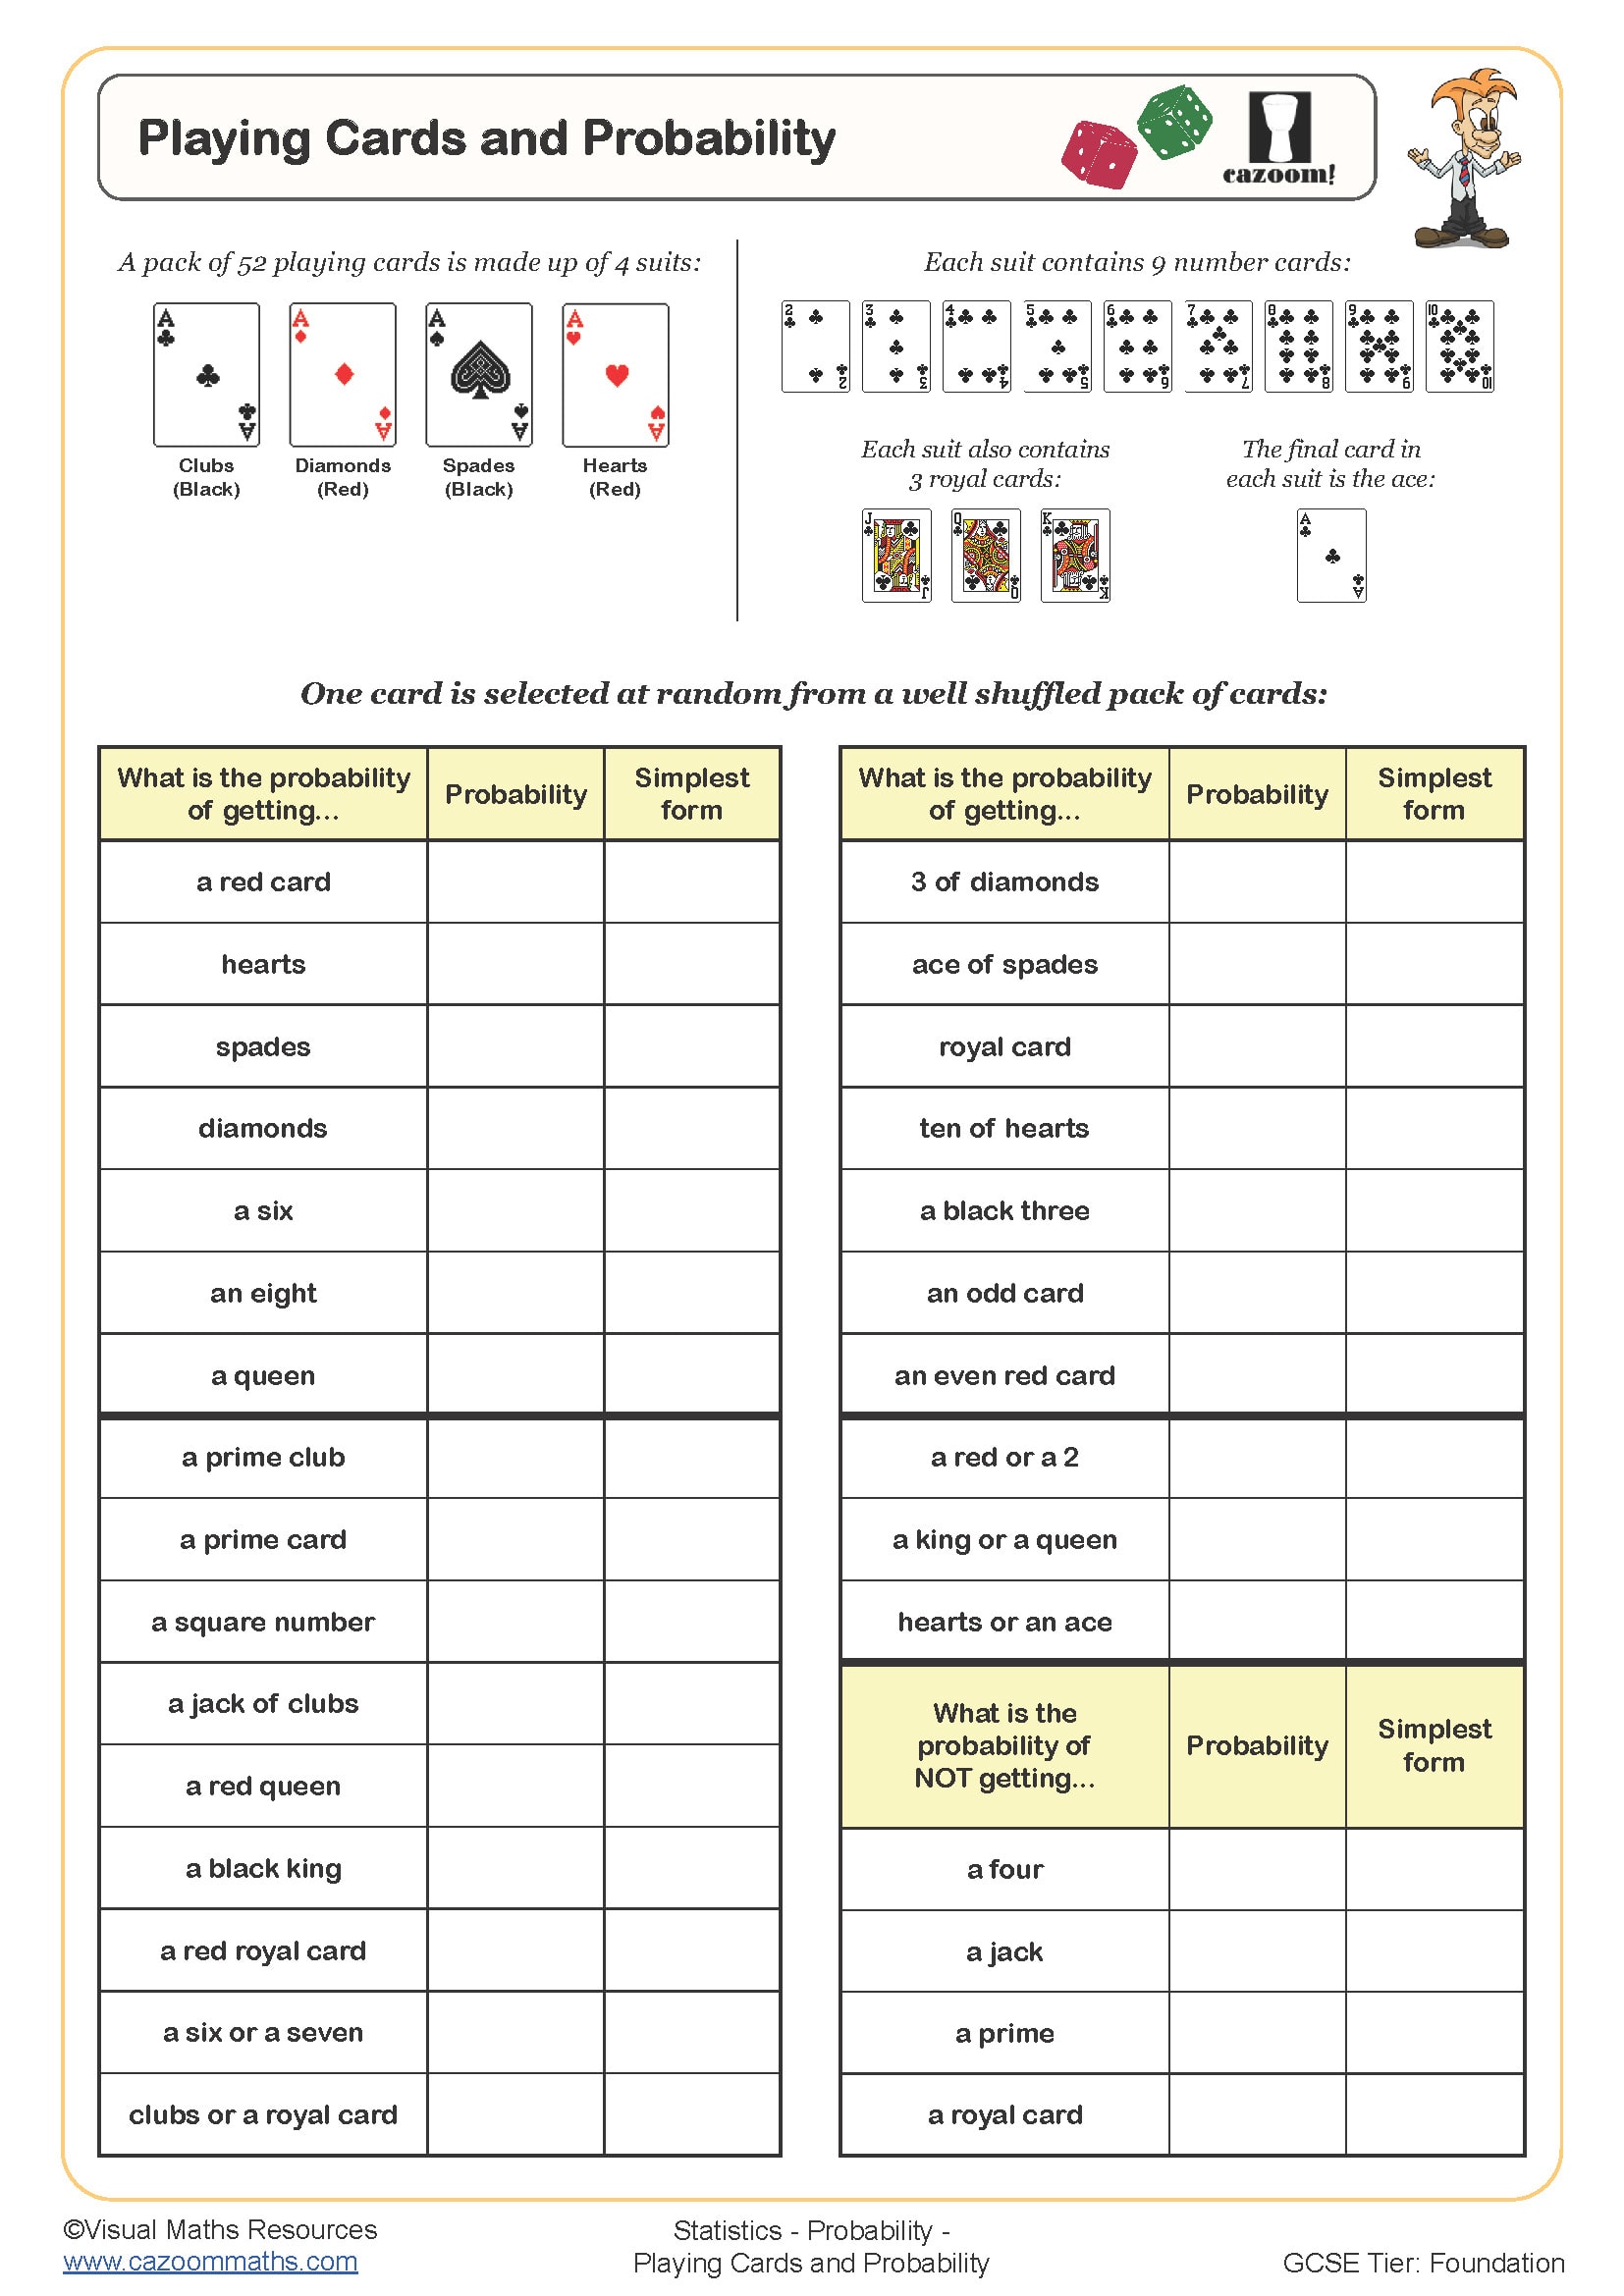
Playing Cards and Probability
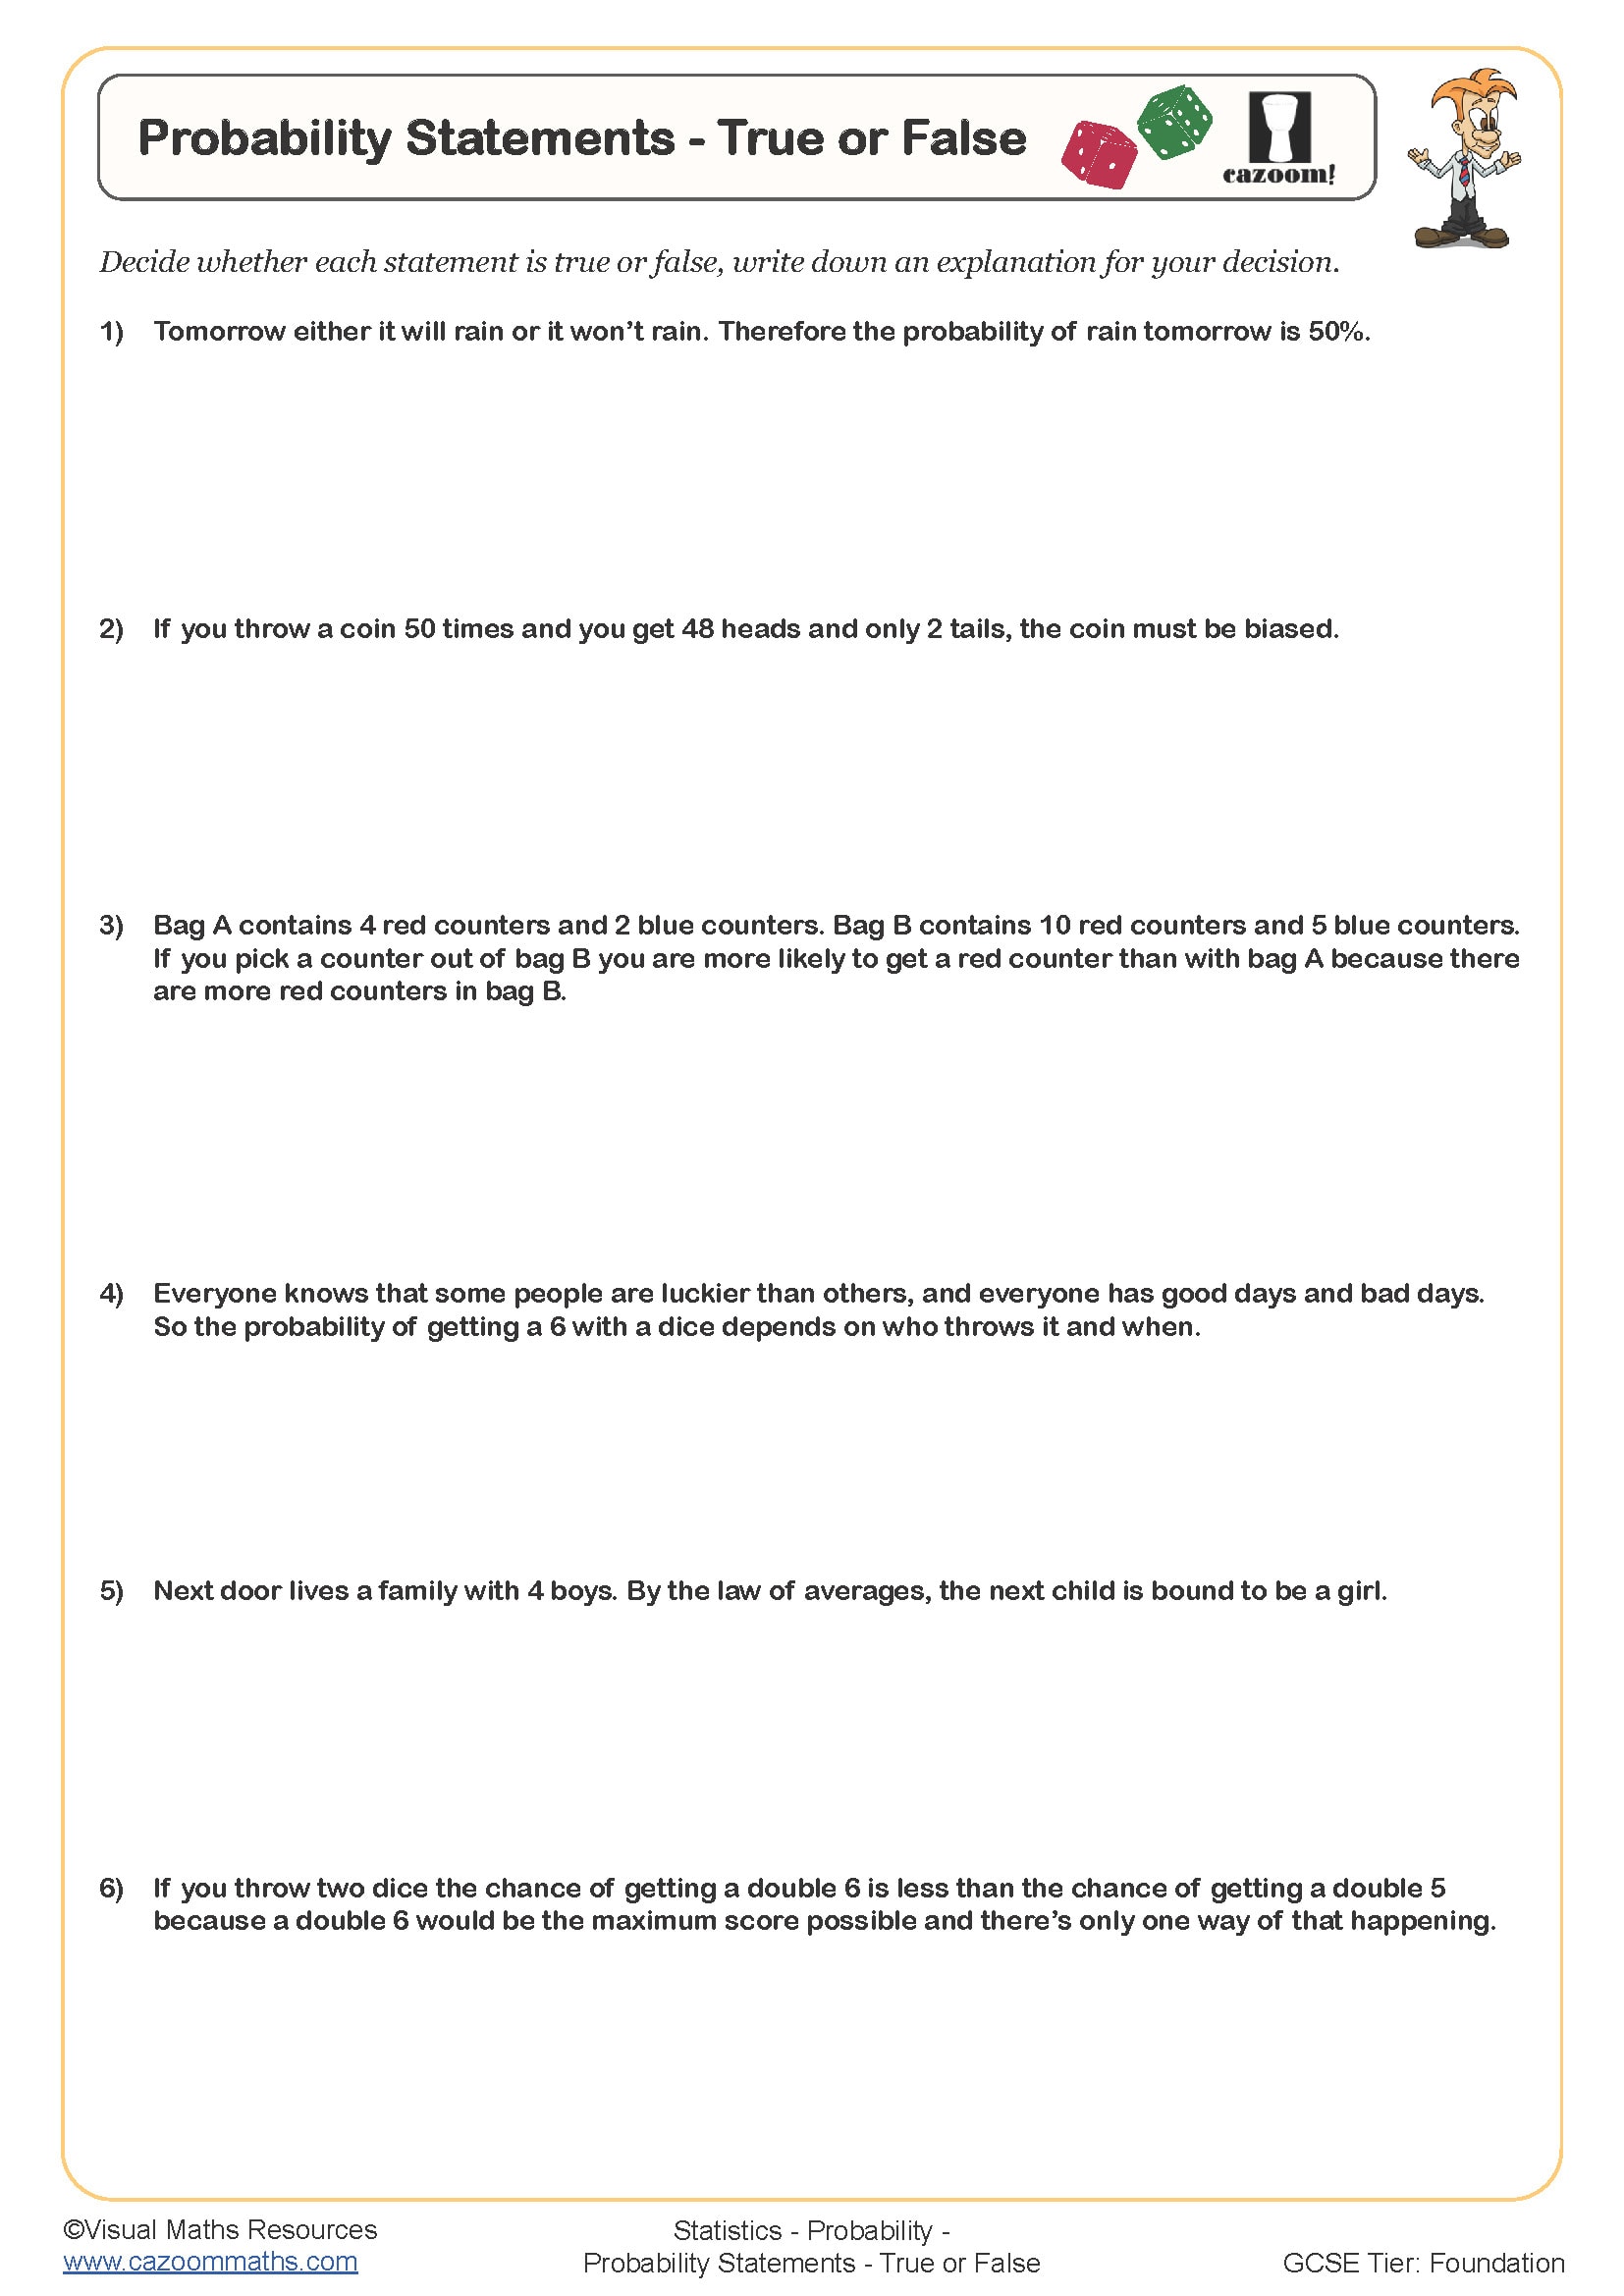
Probability Statements - True or False
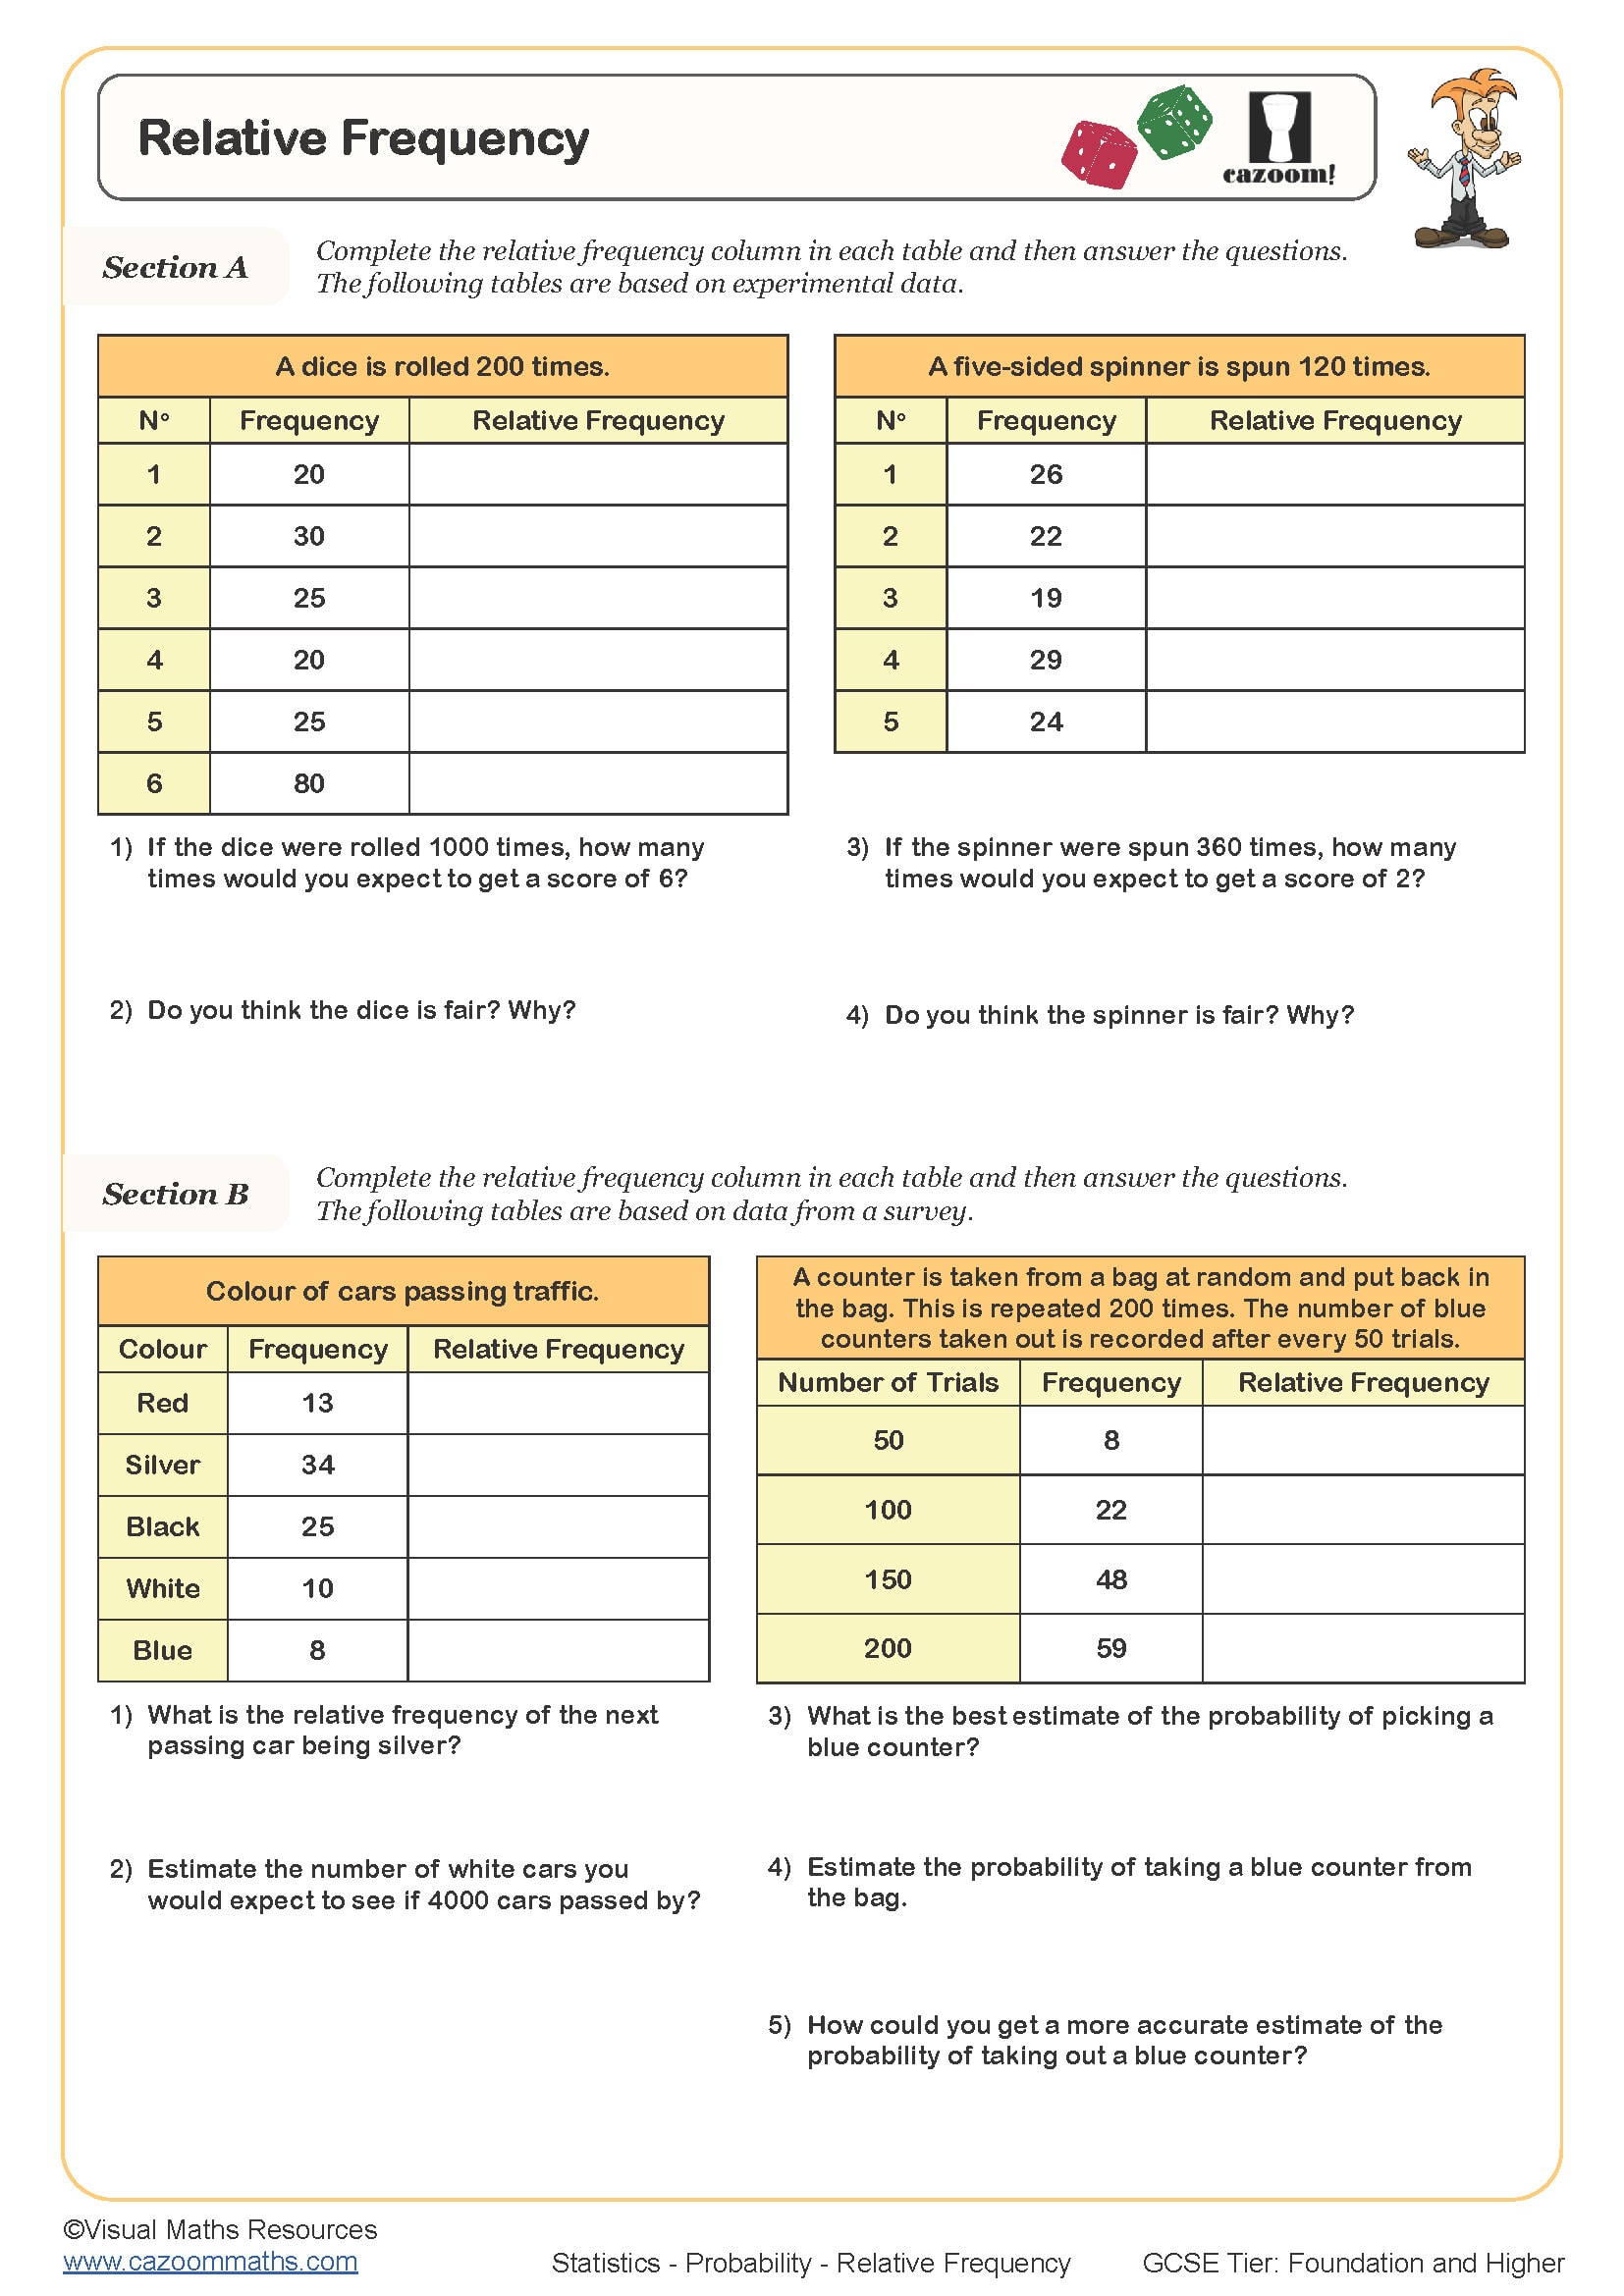
Relative Frequency
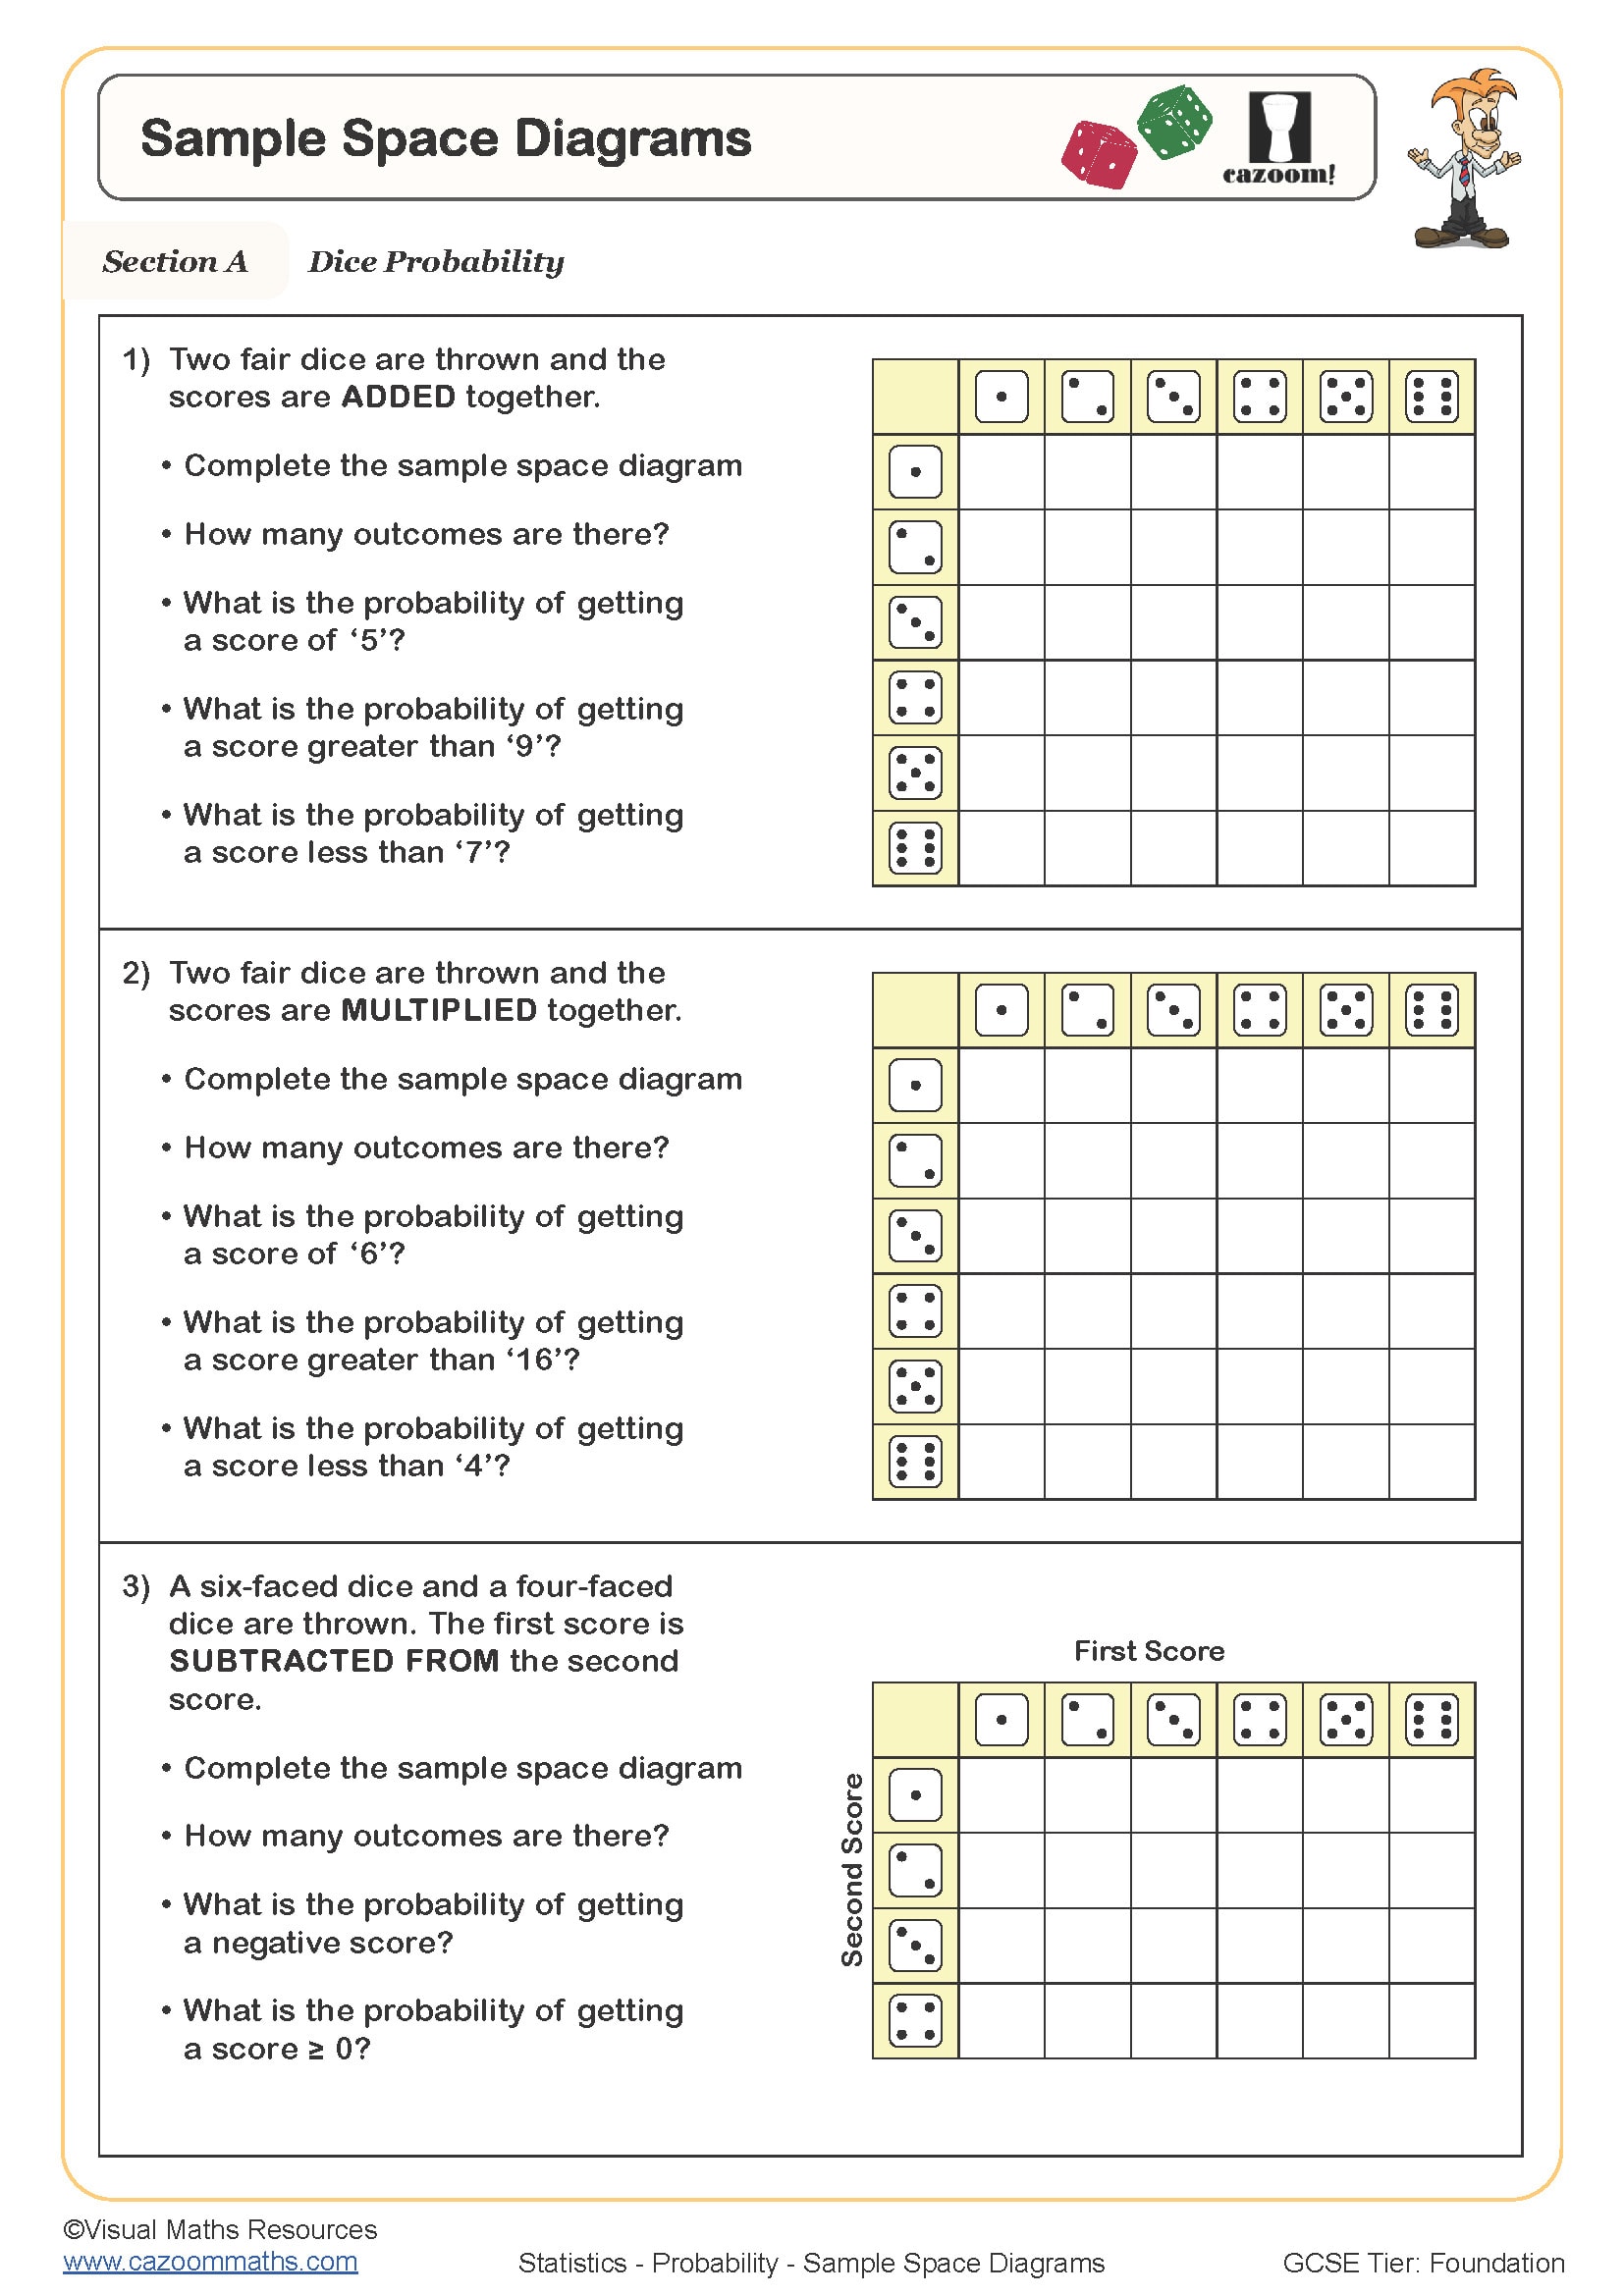
Sample Space Diagrams
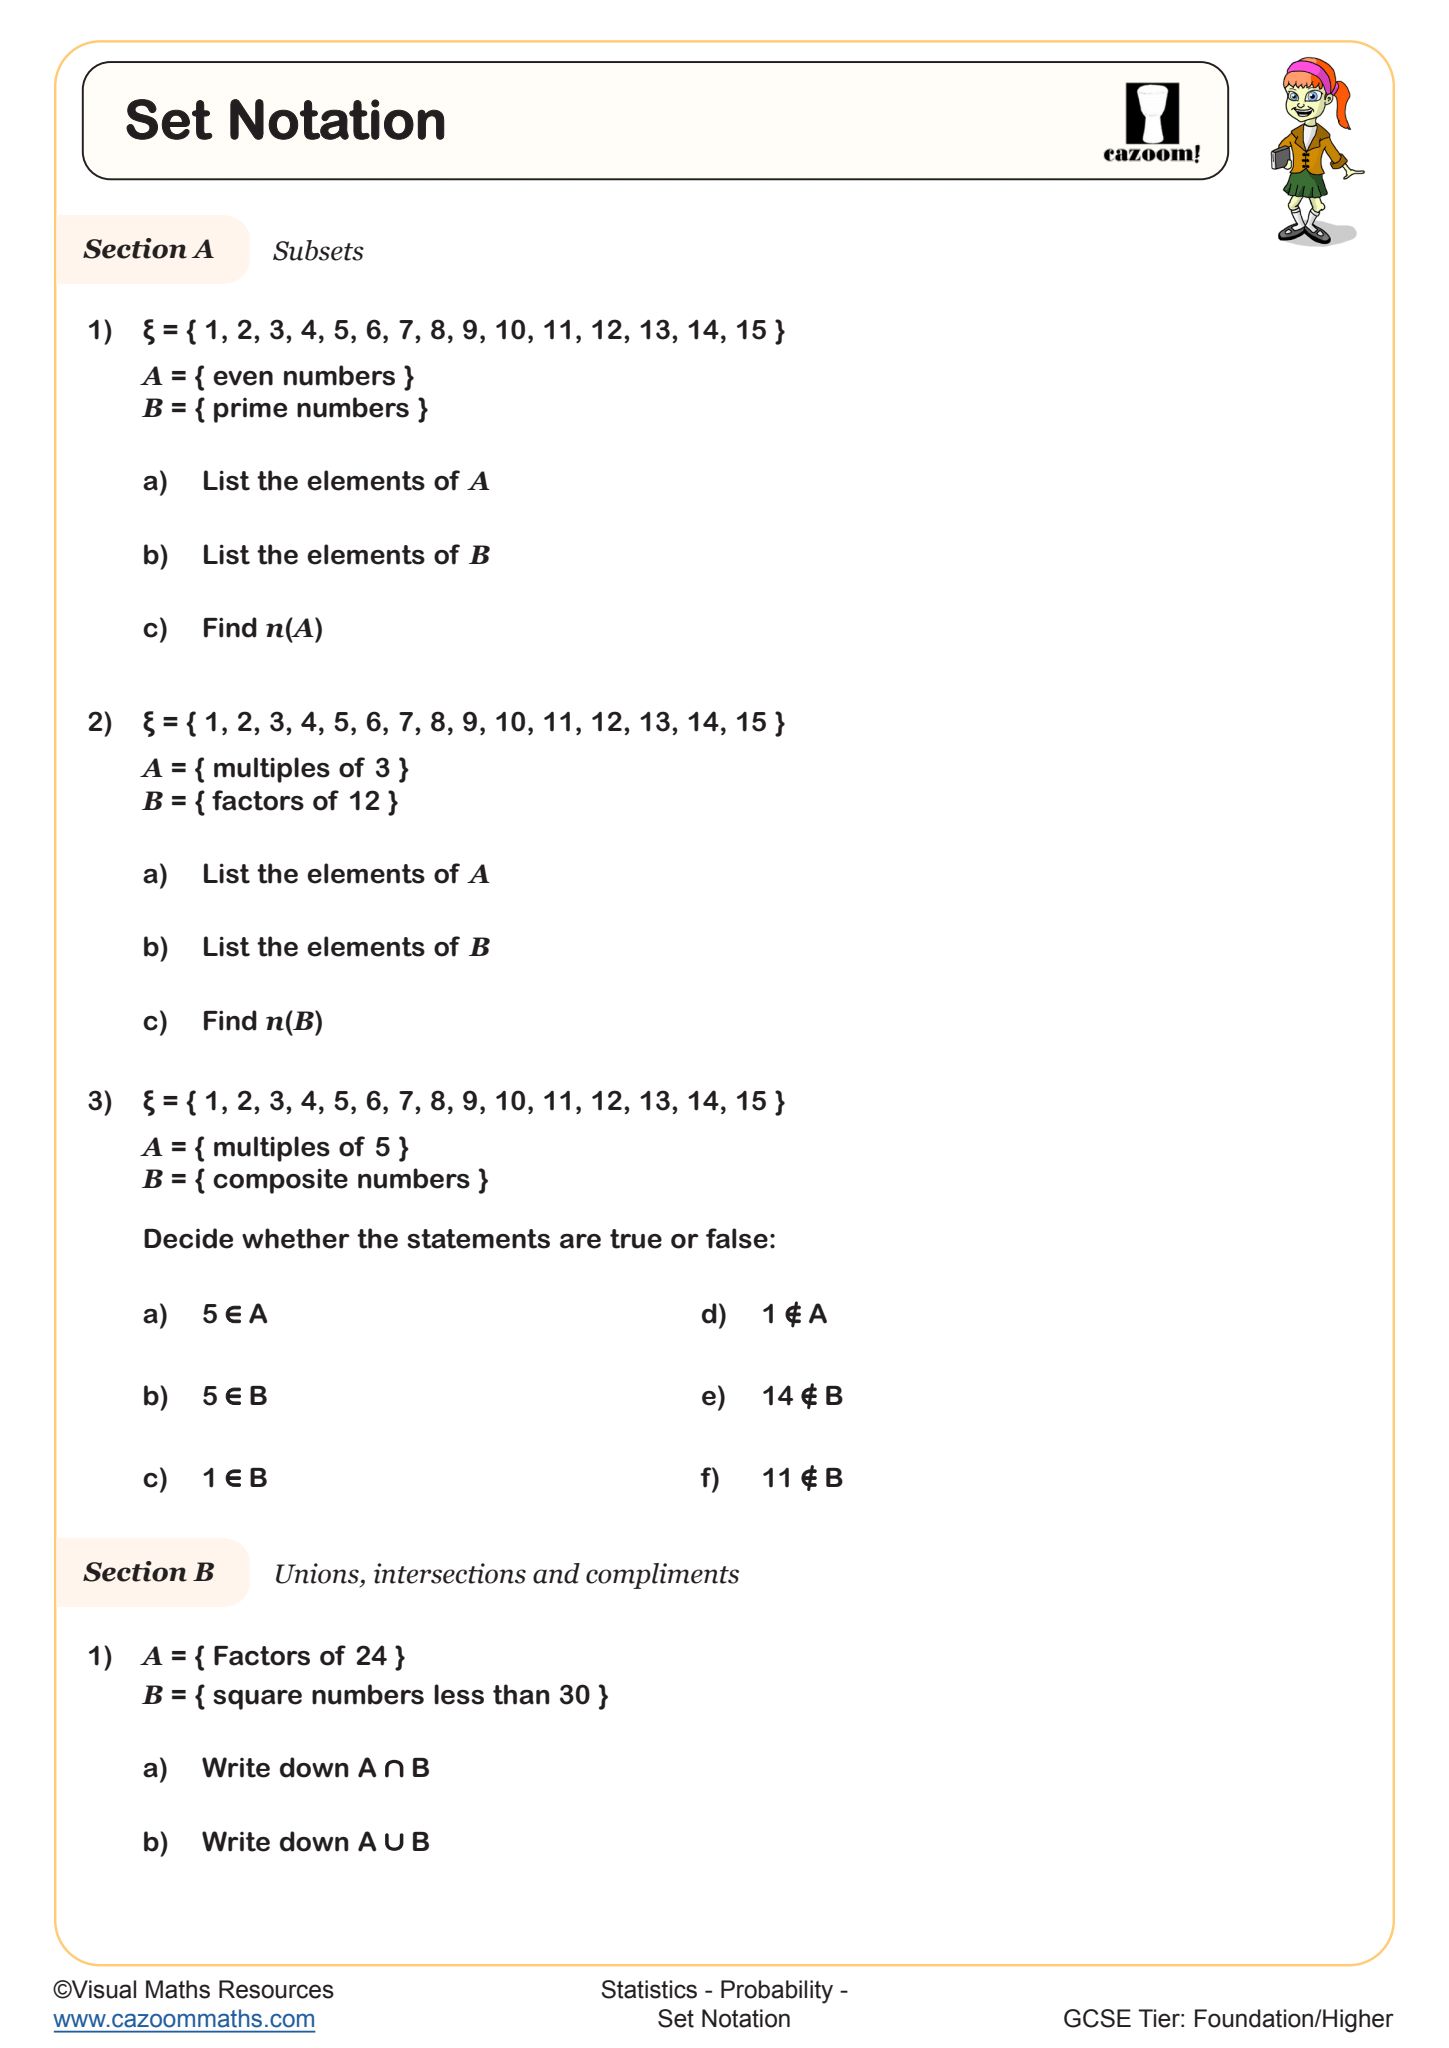
Set Notation
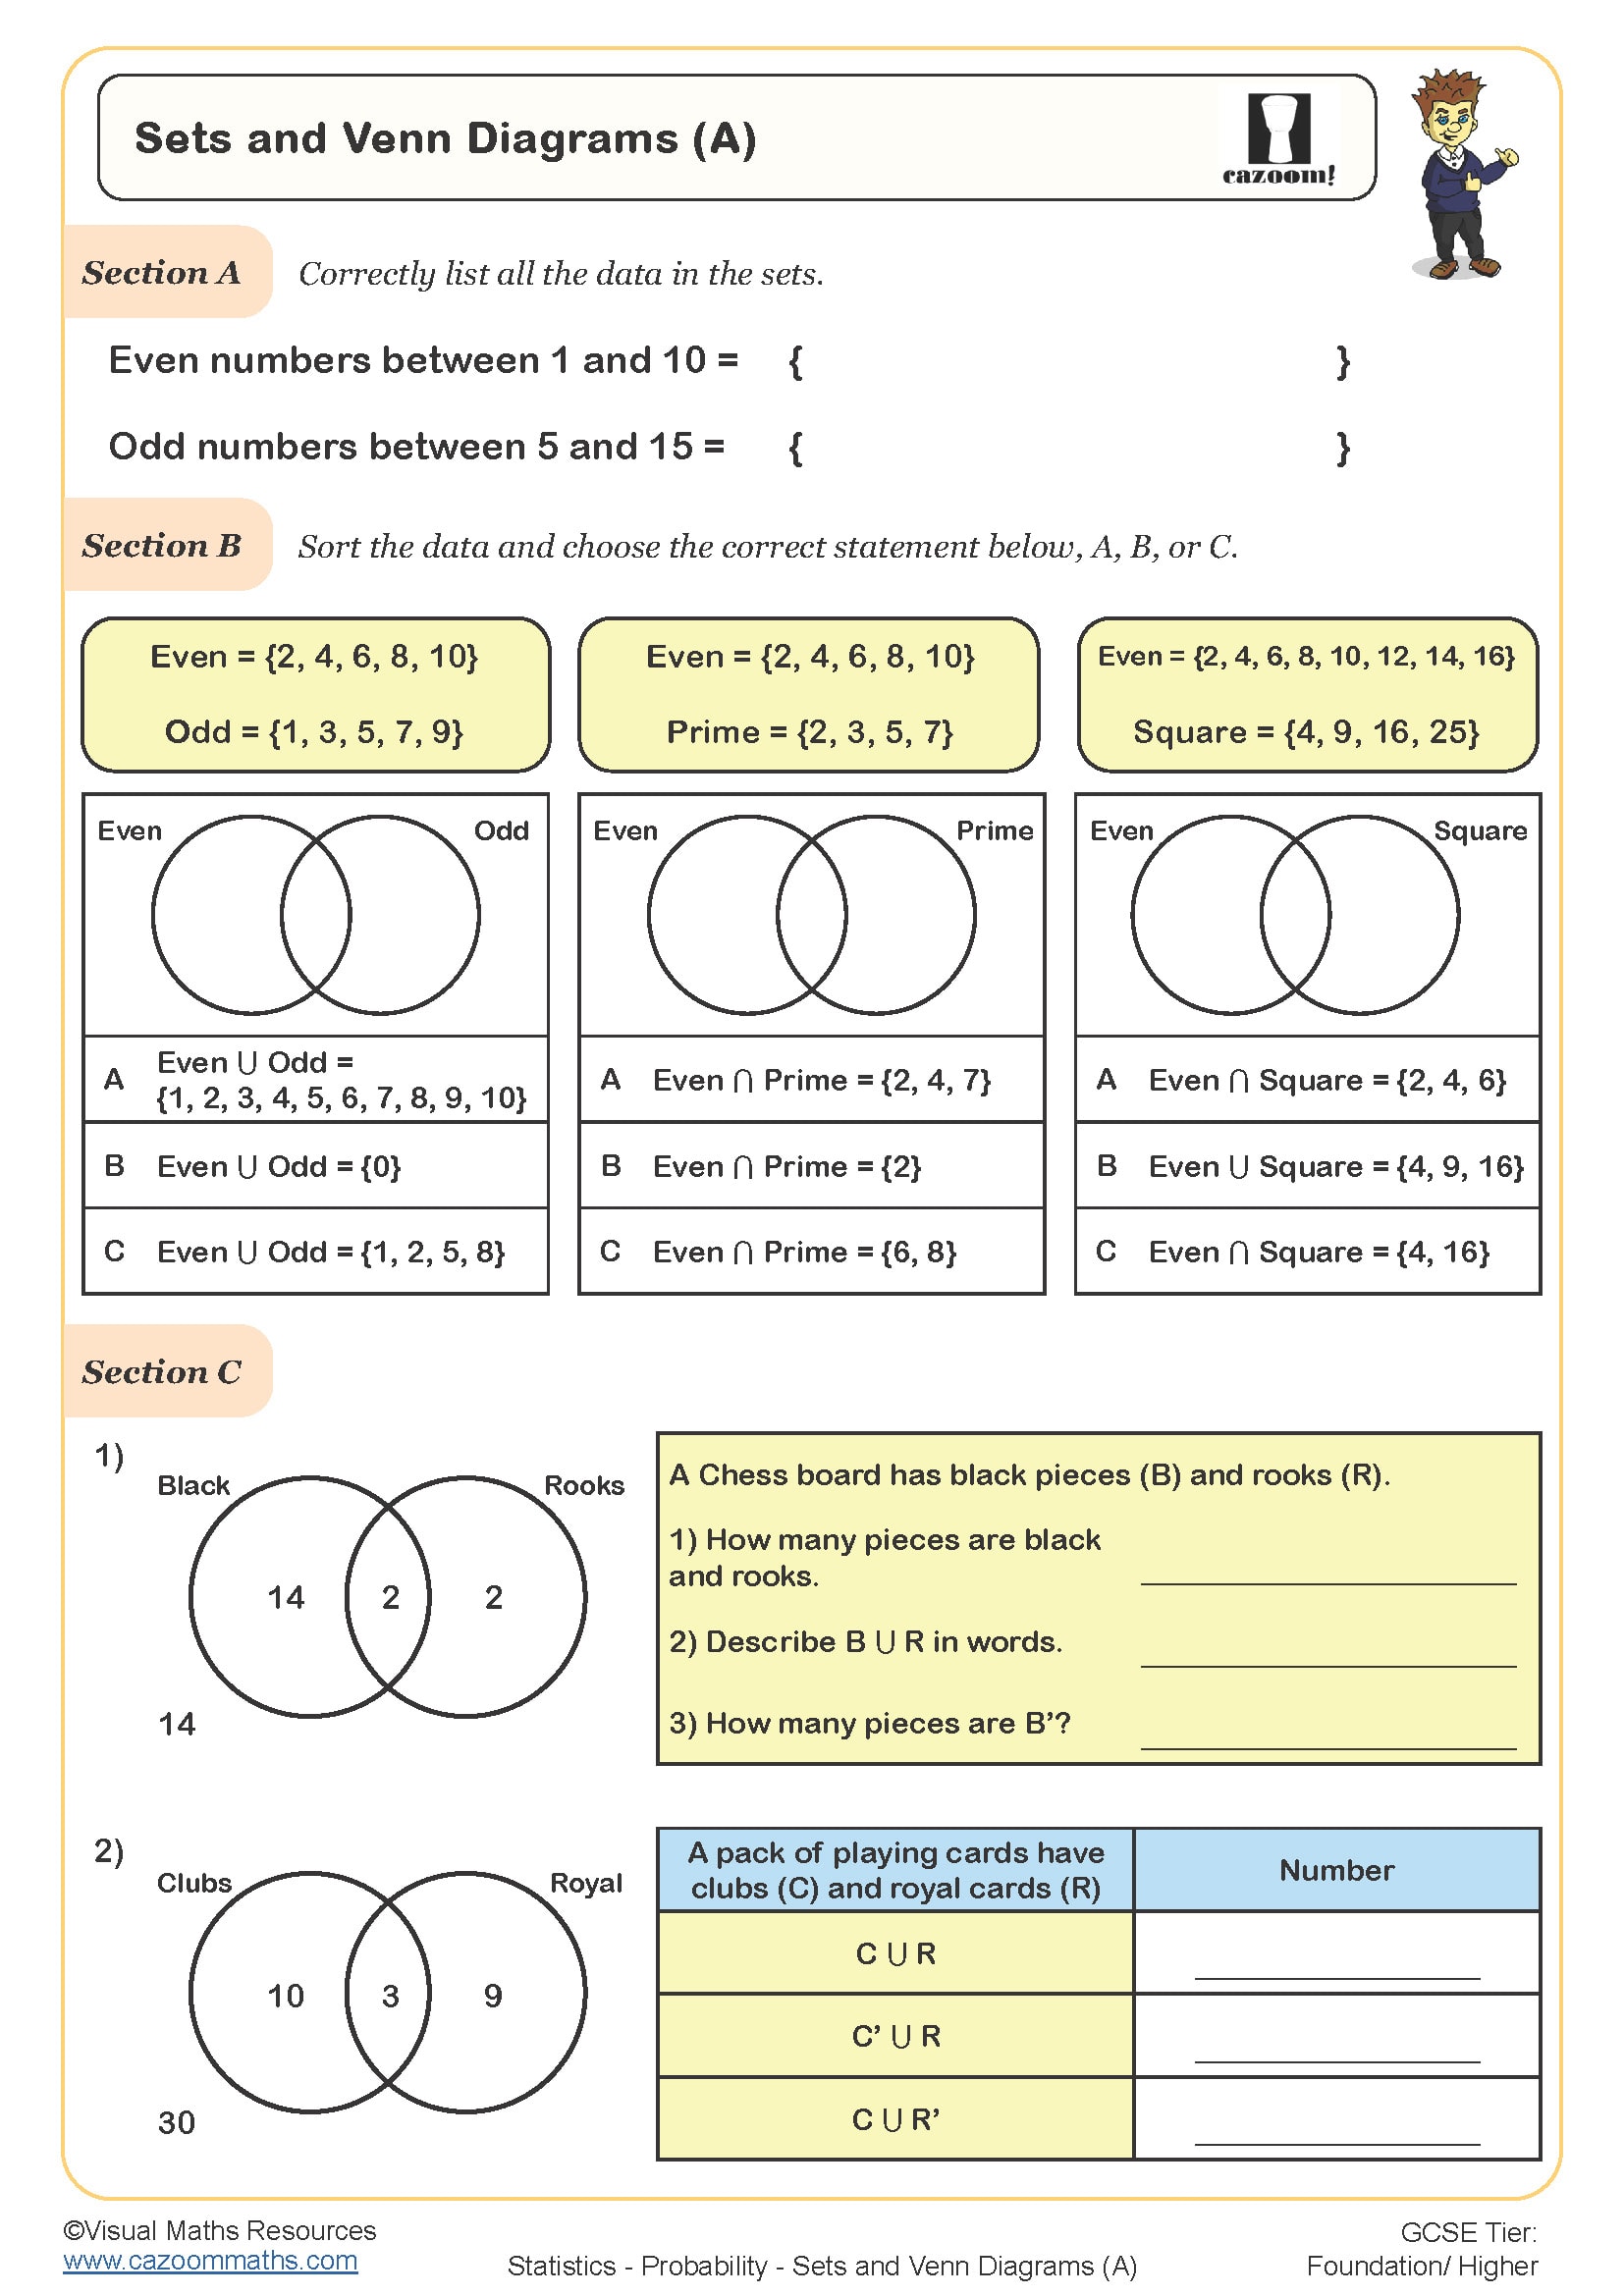
Sets and Venn Diagrams (A)
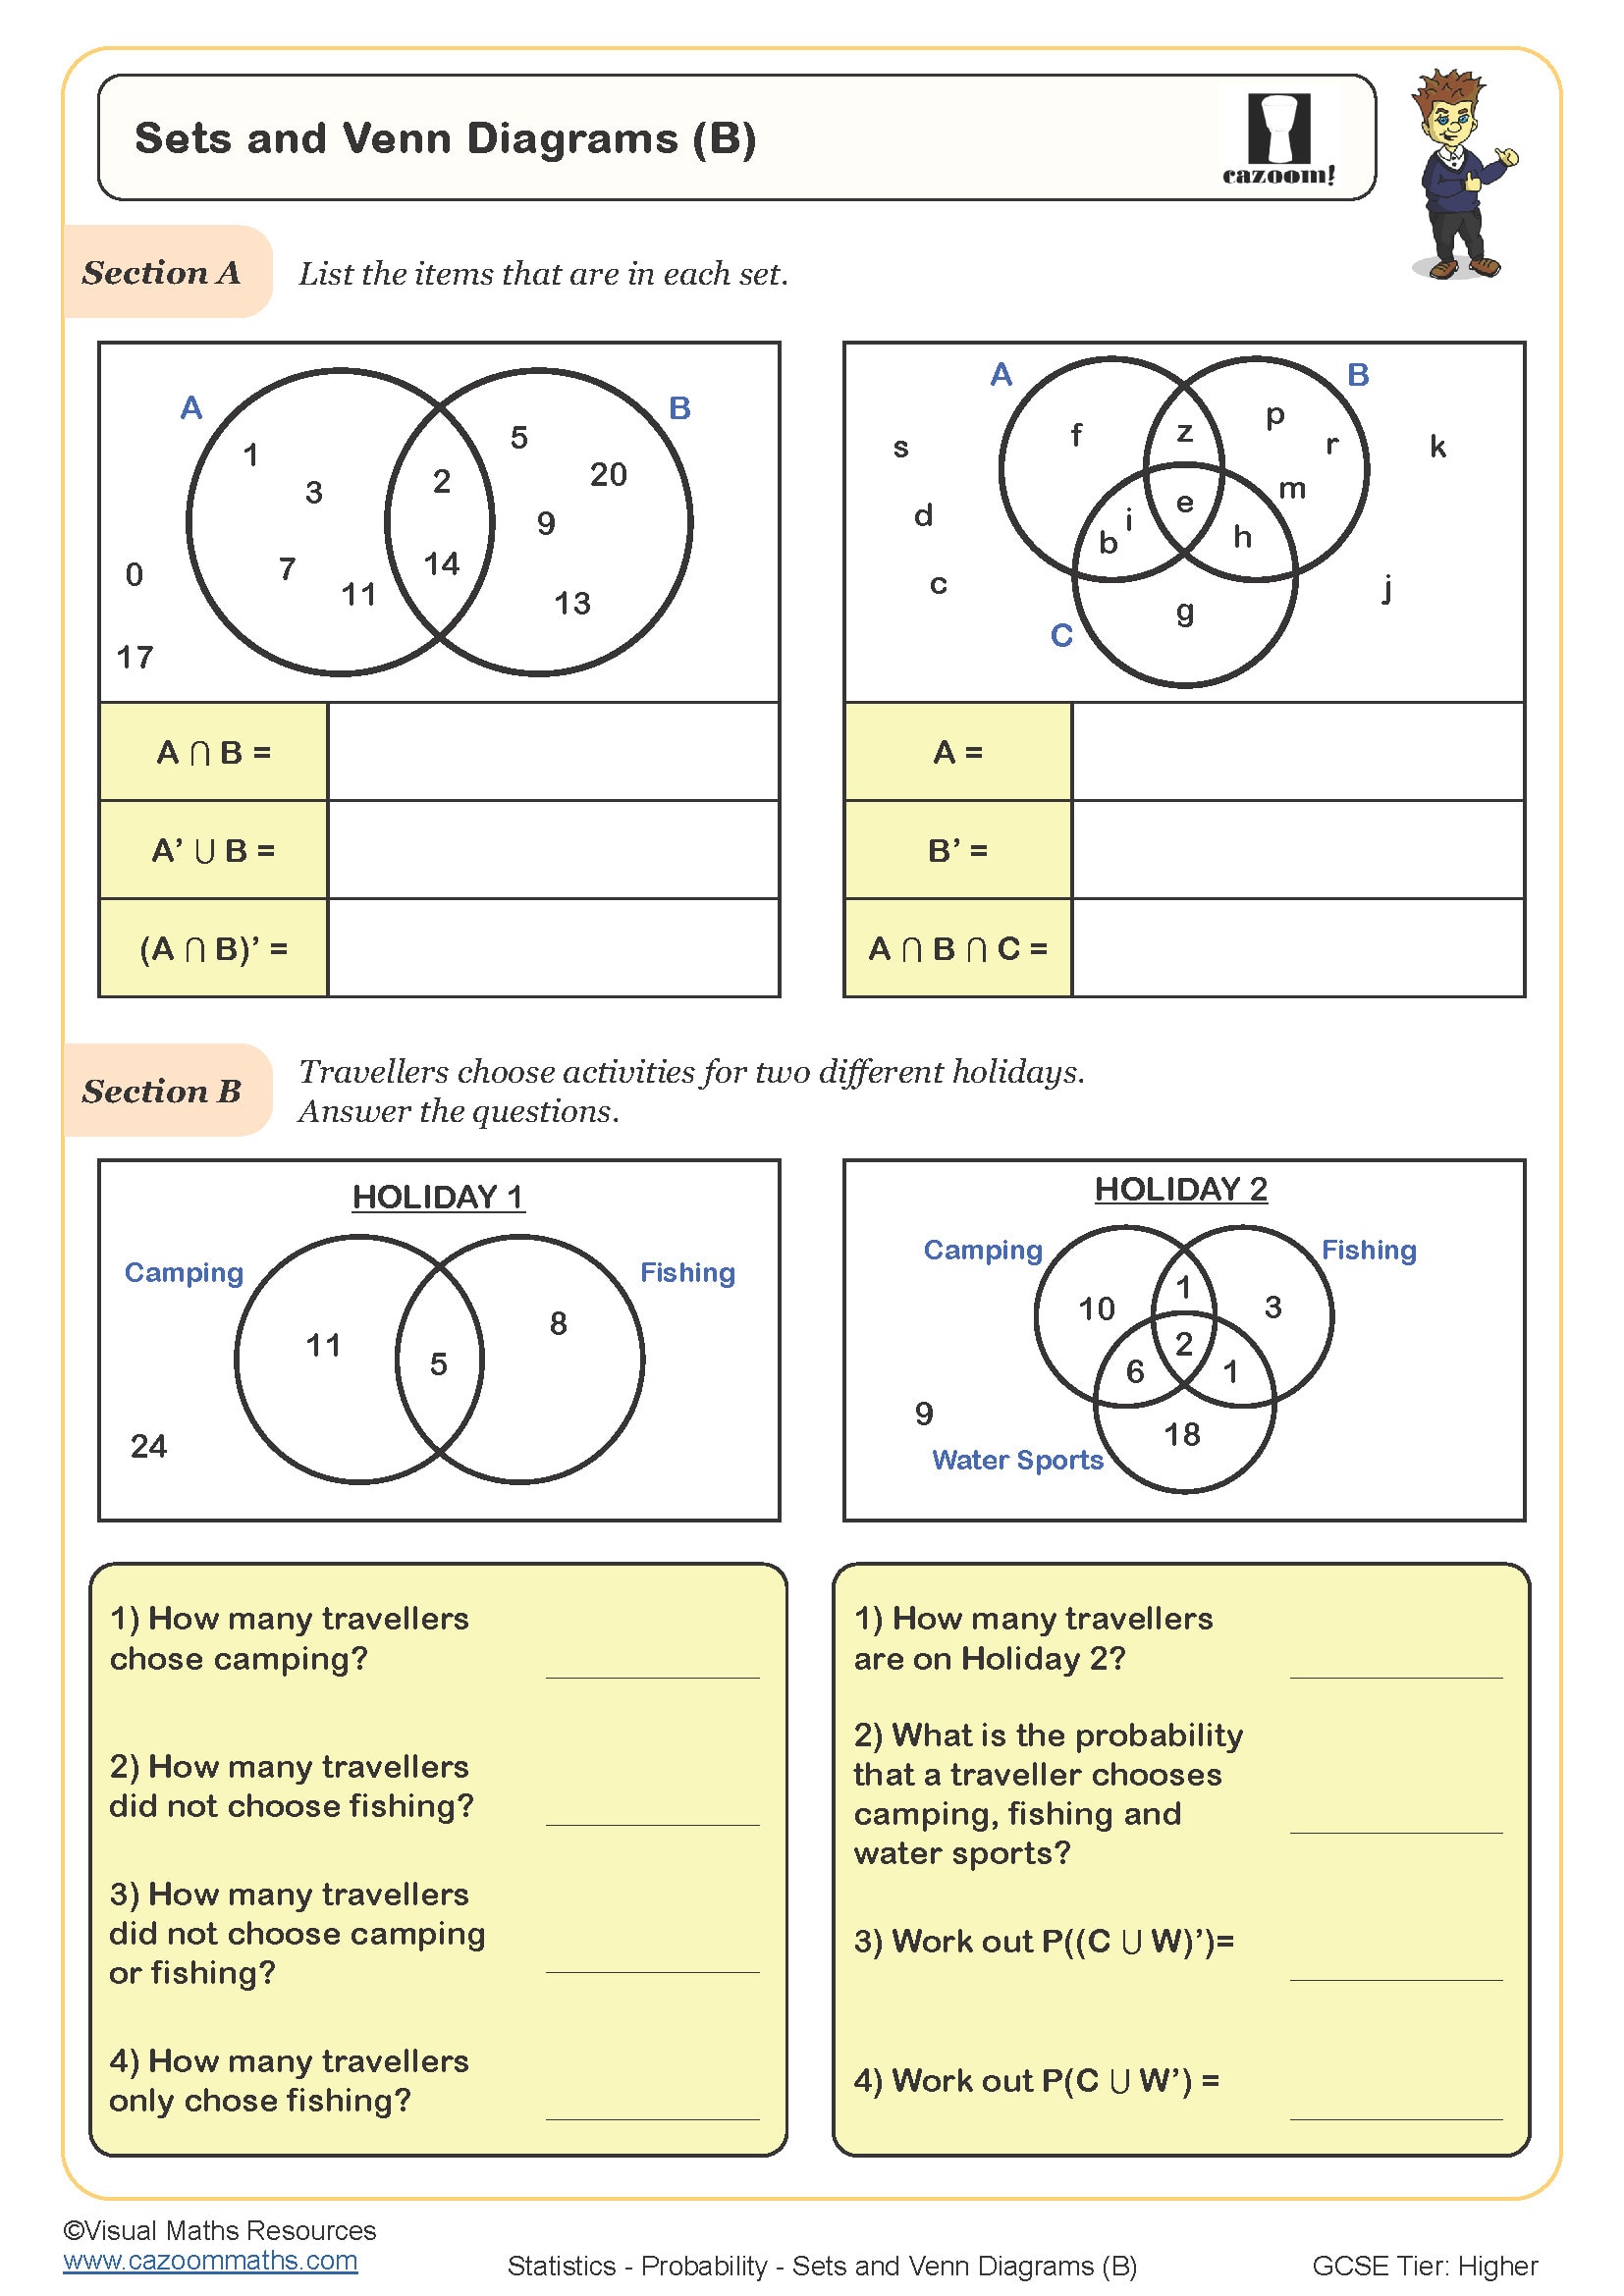
Sets and Venn Diagrams (B)
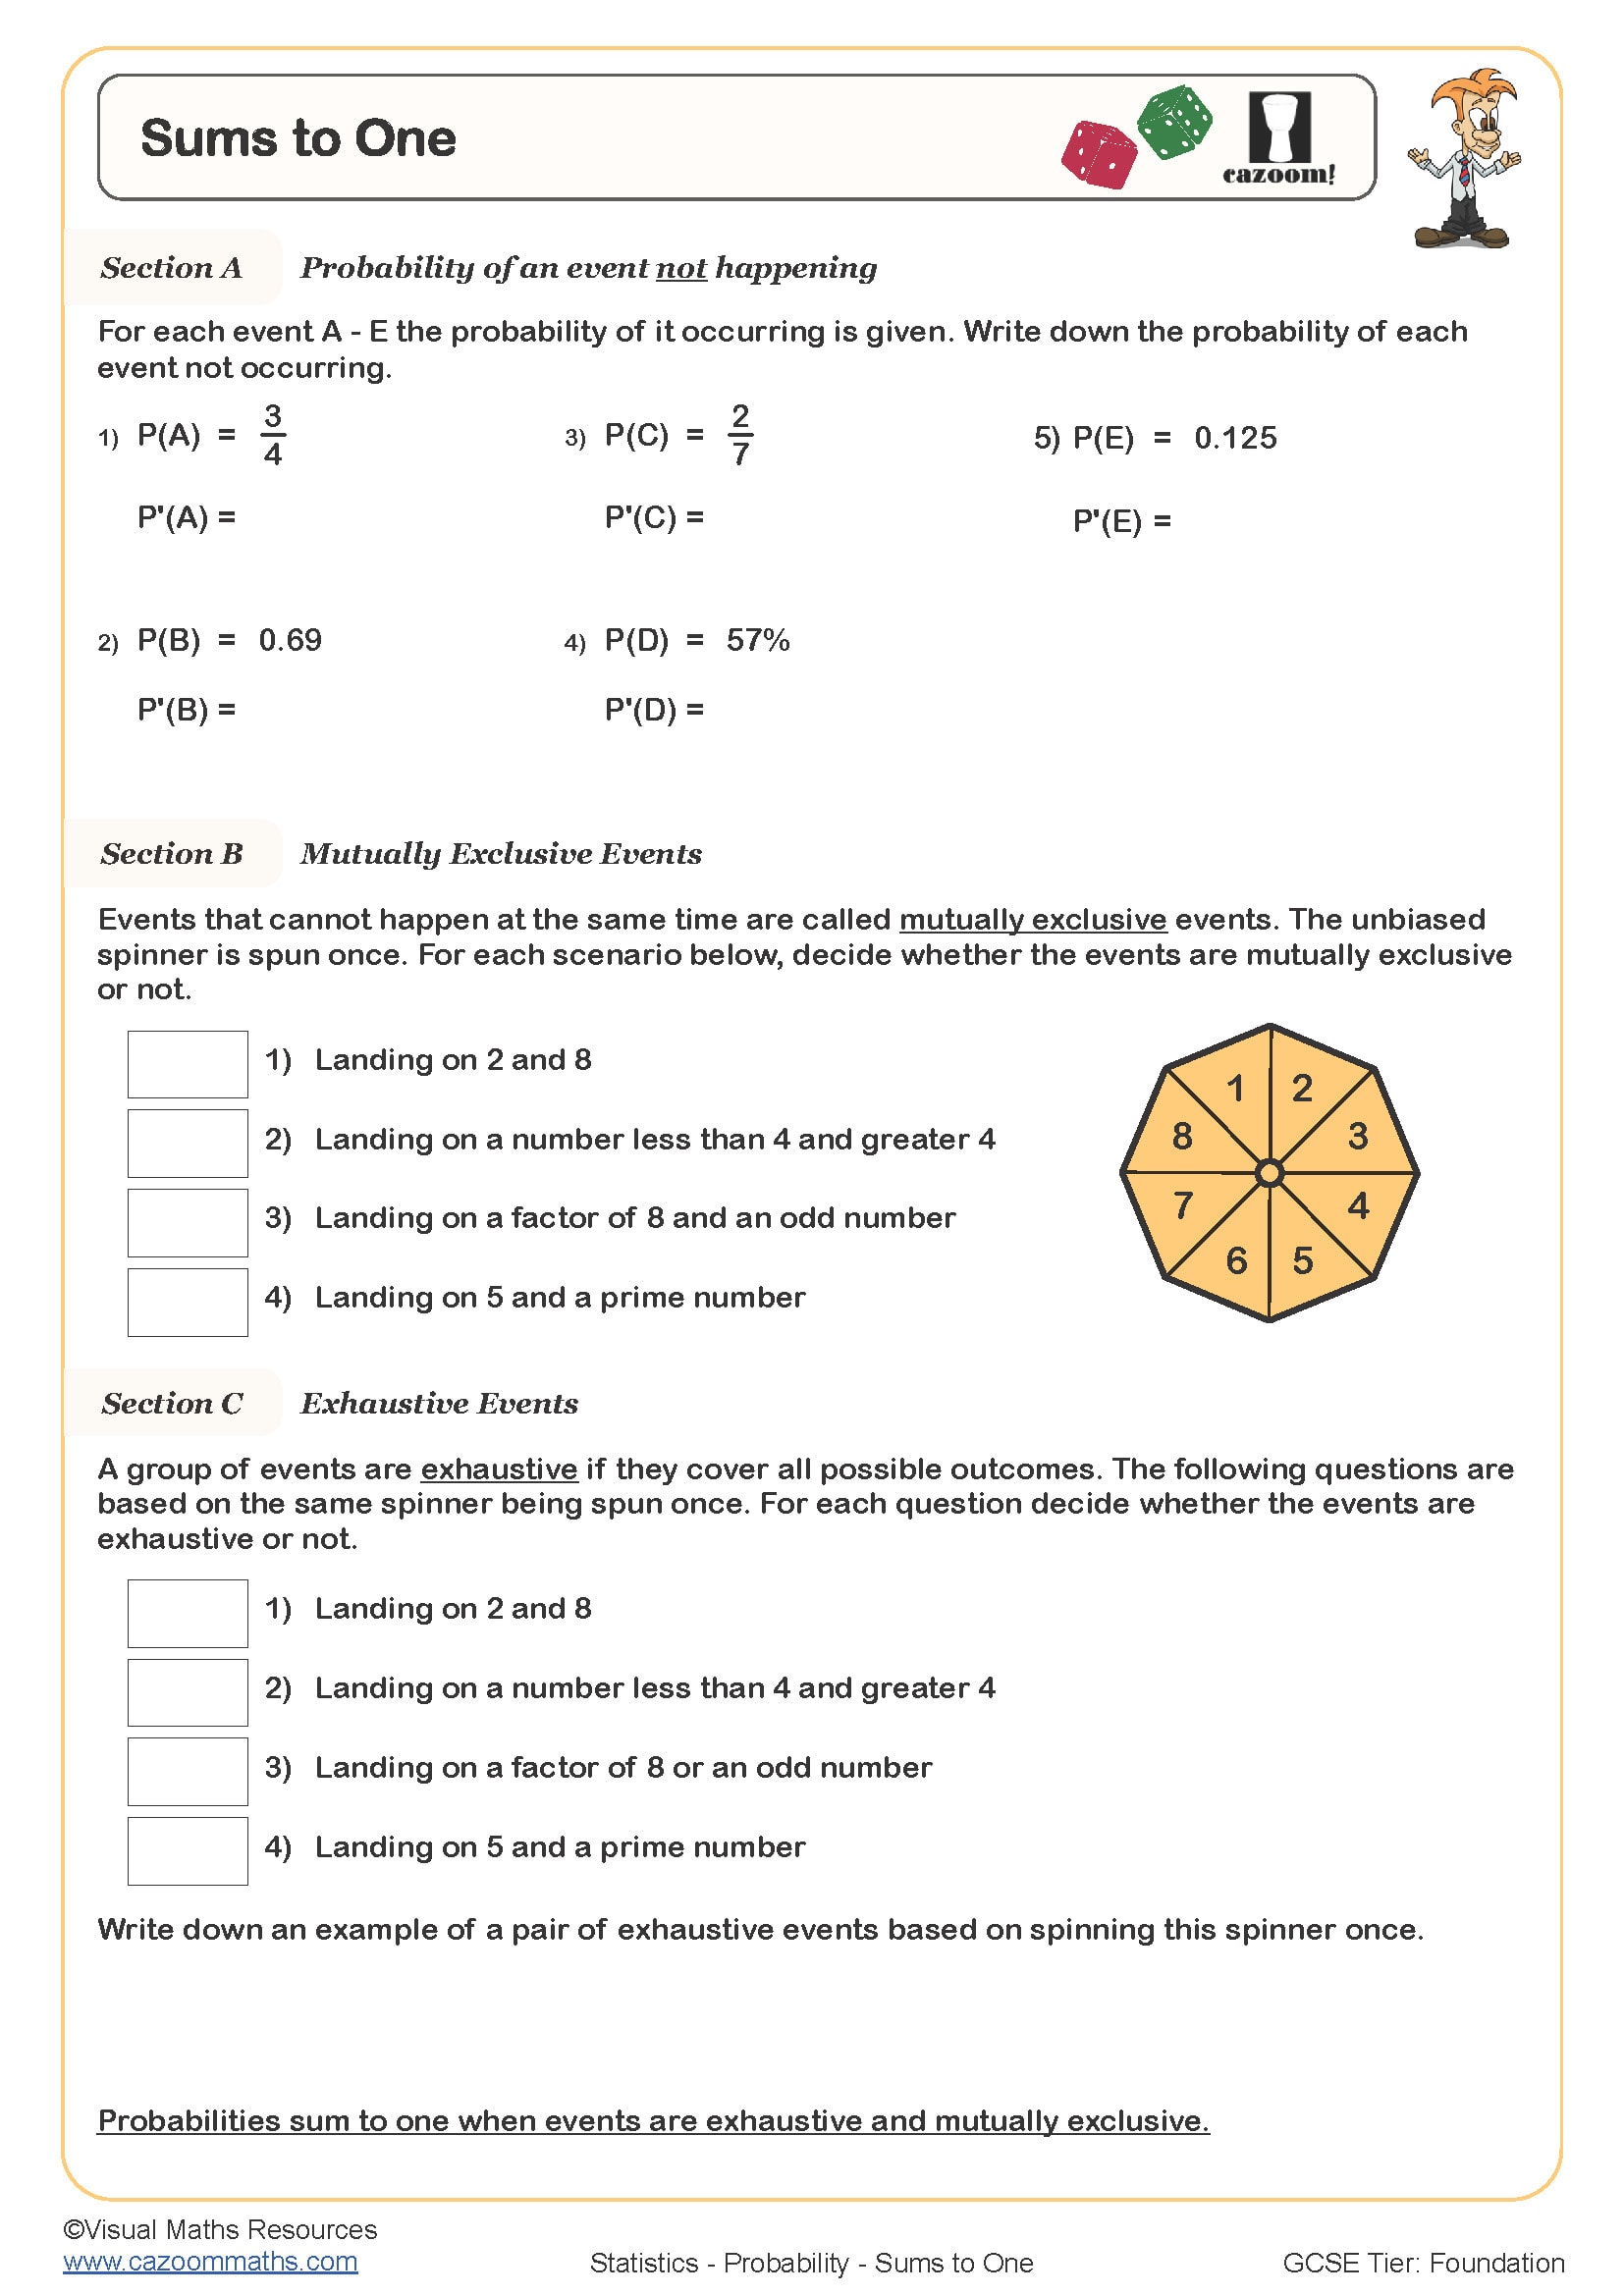
Sums to One
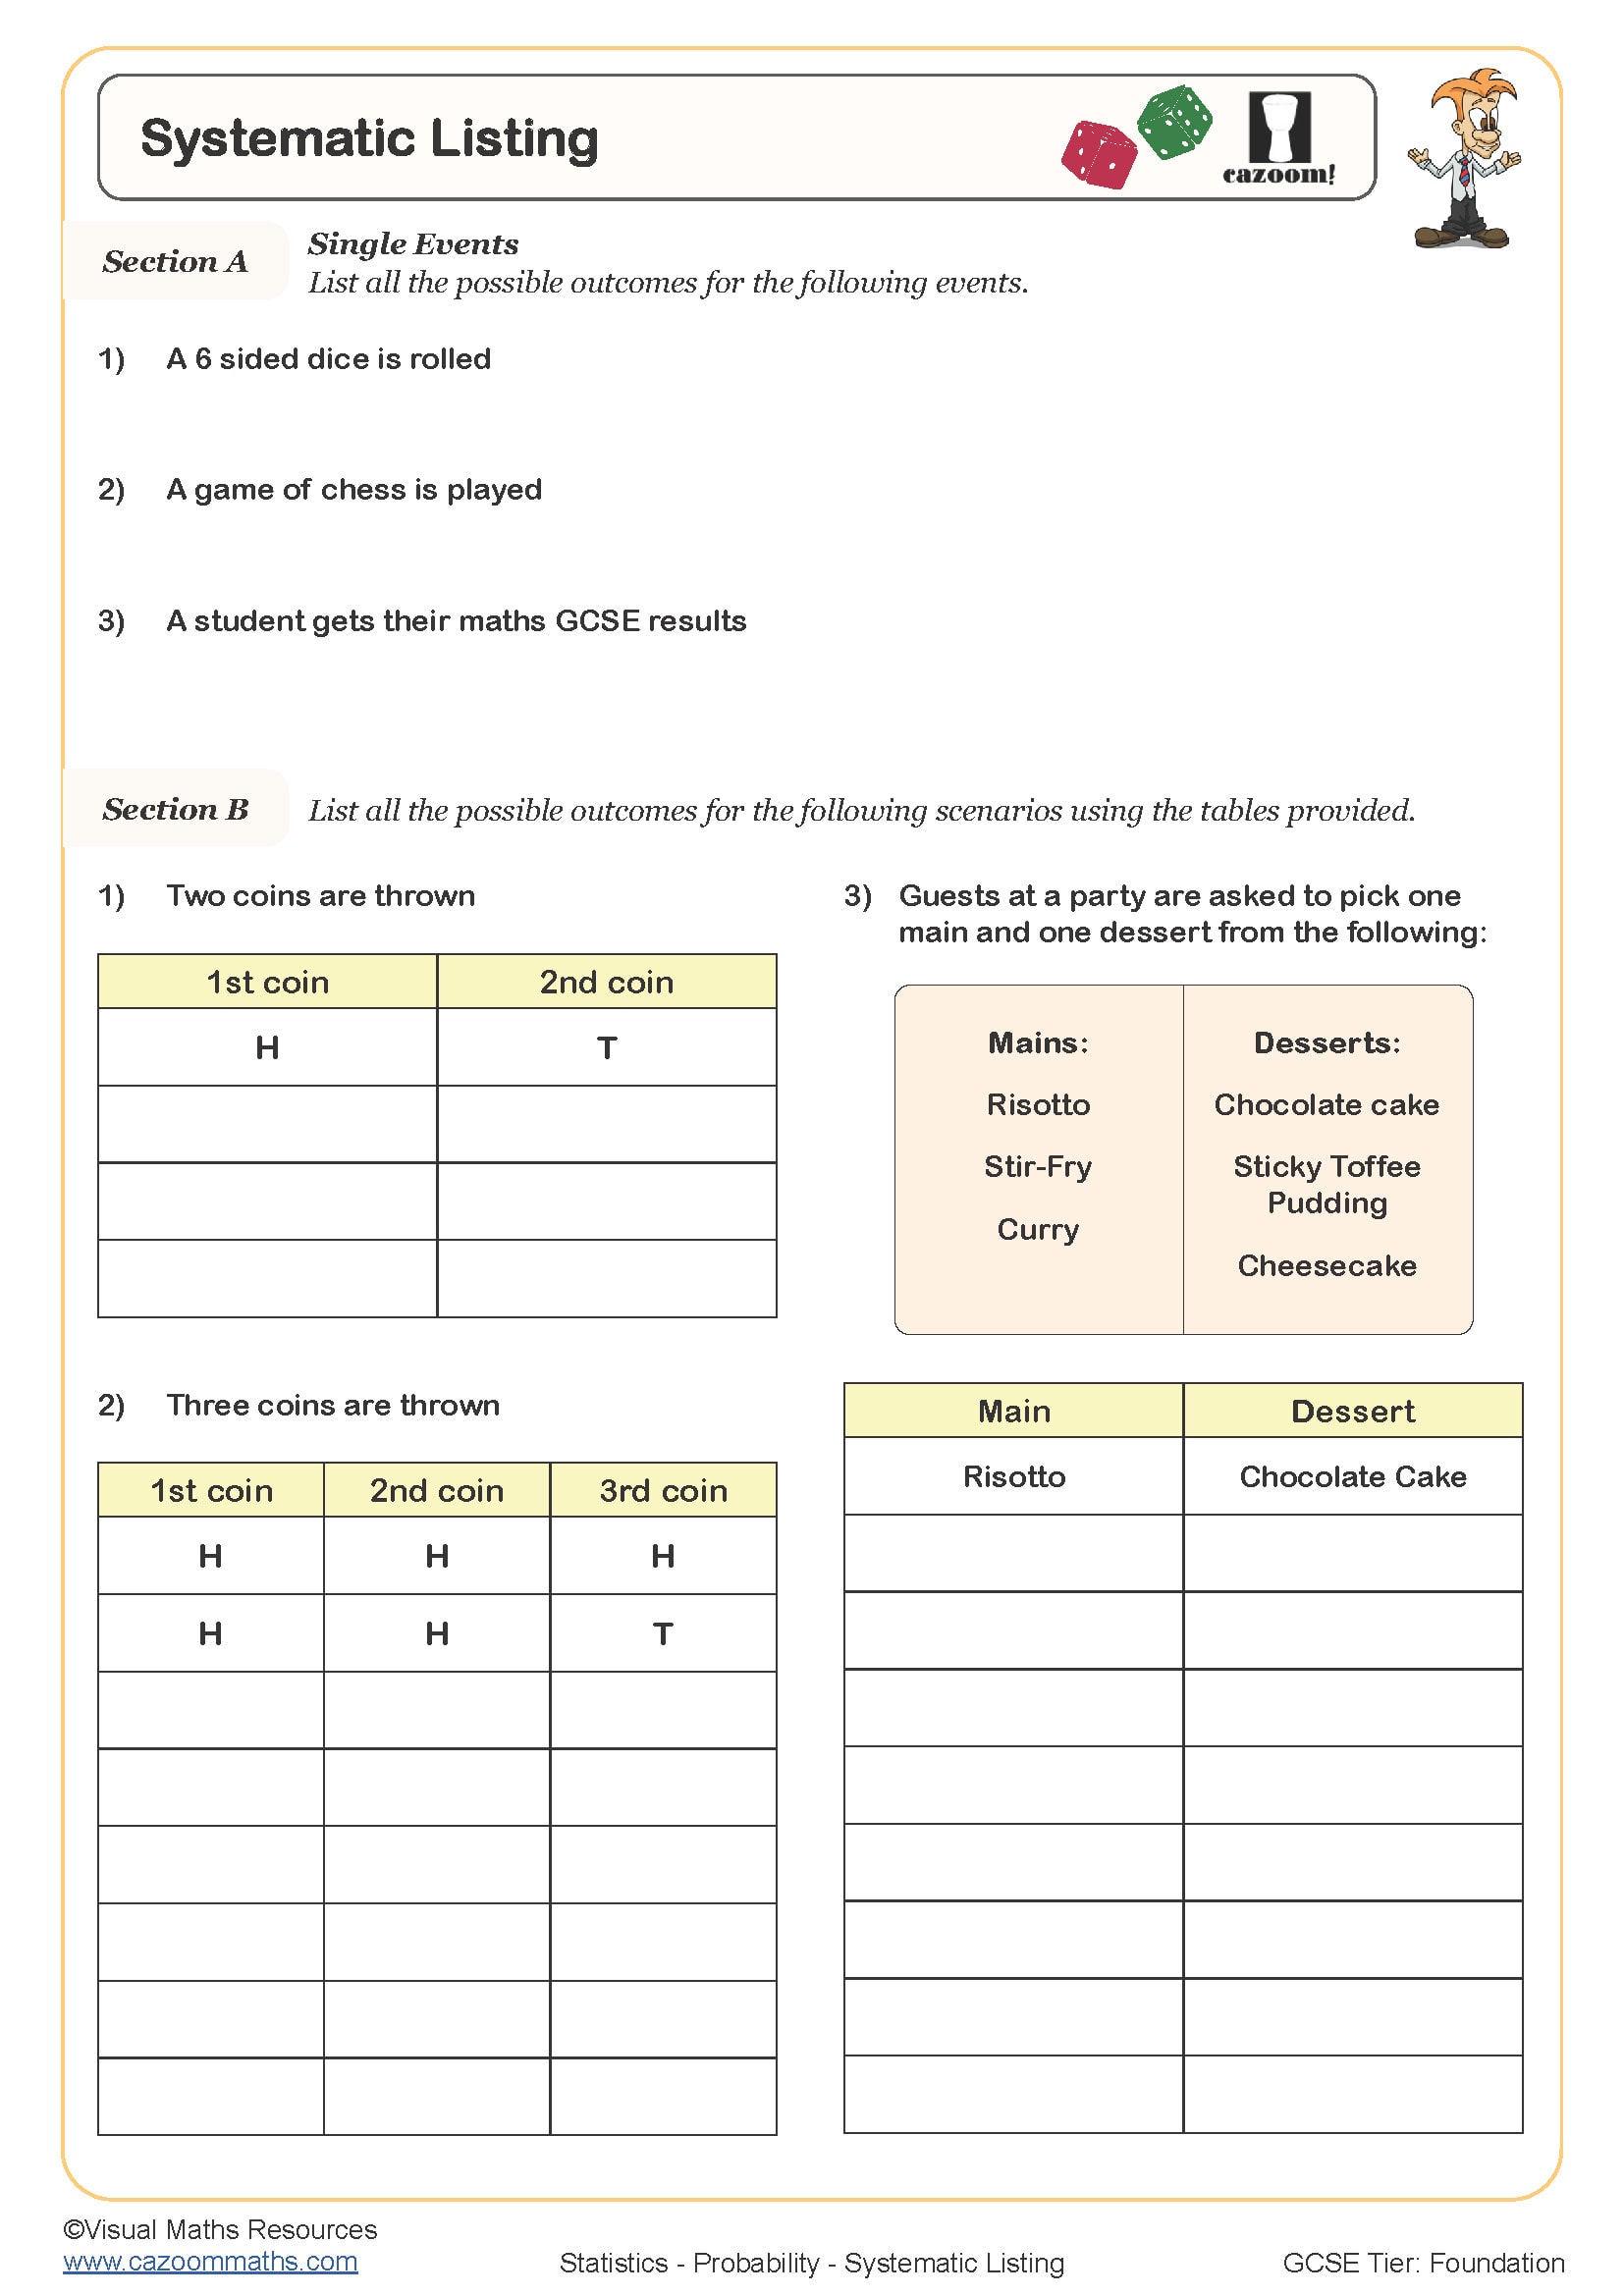
Systematic Listing
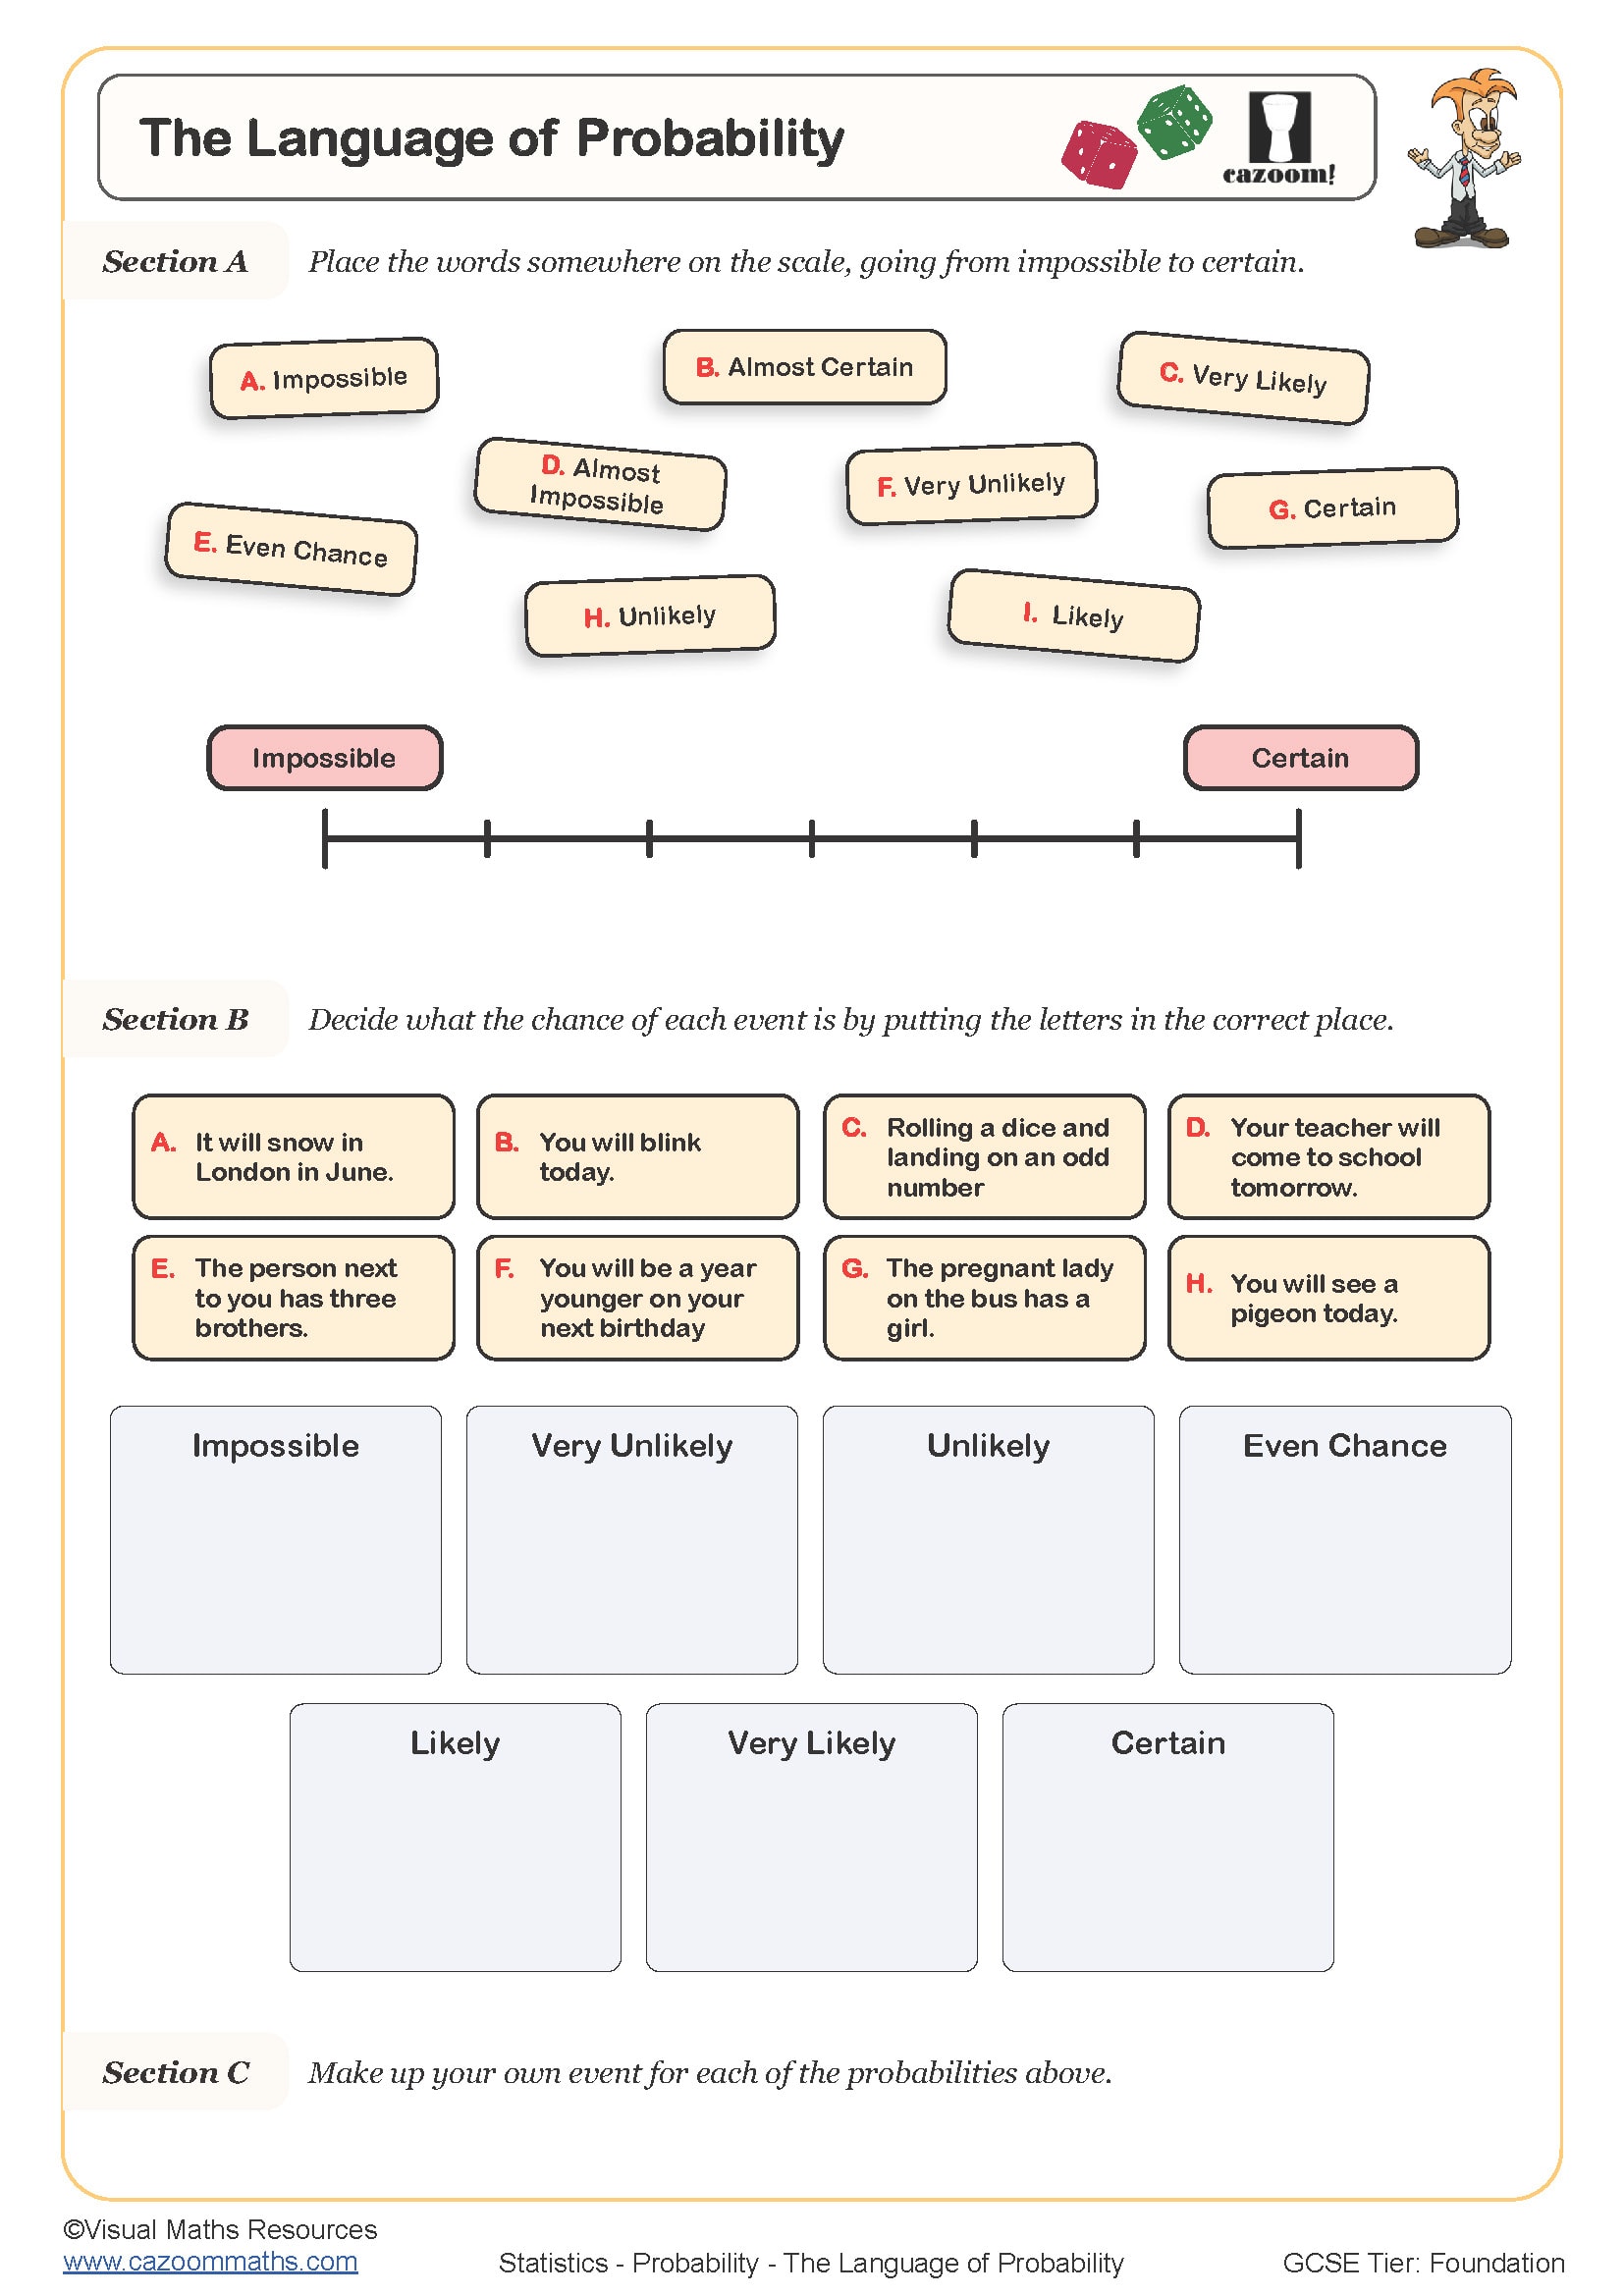
The Language of Probability
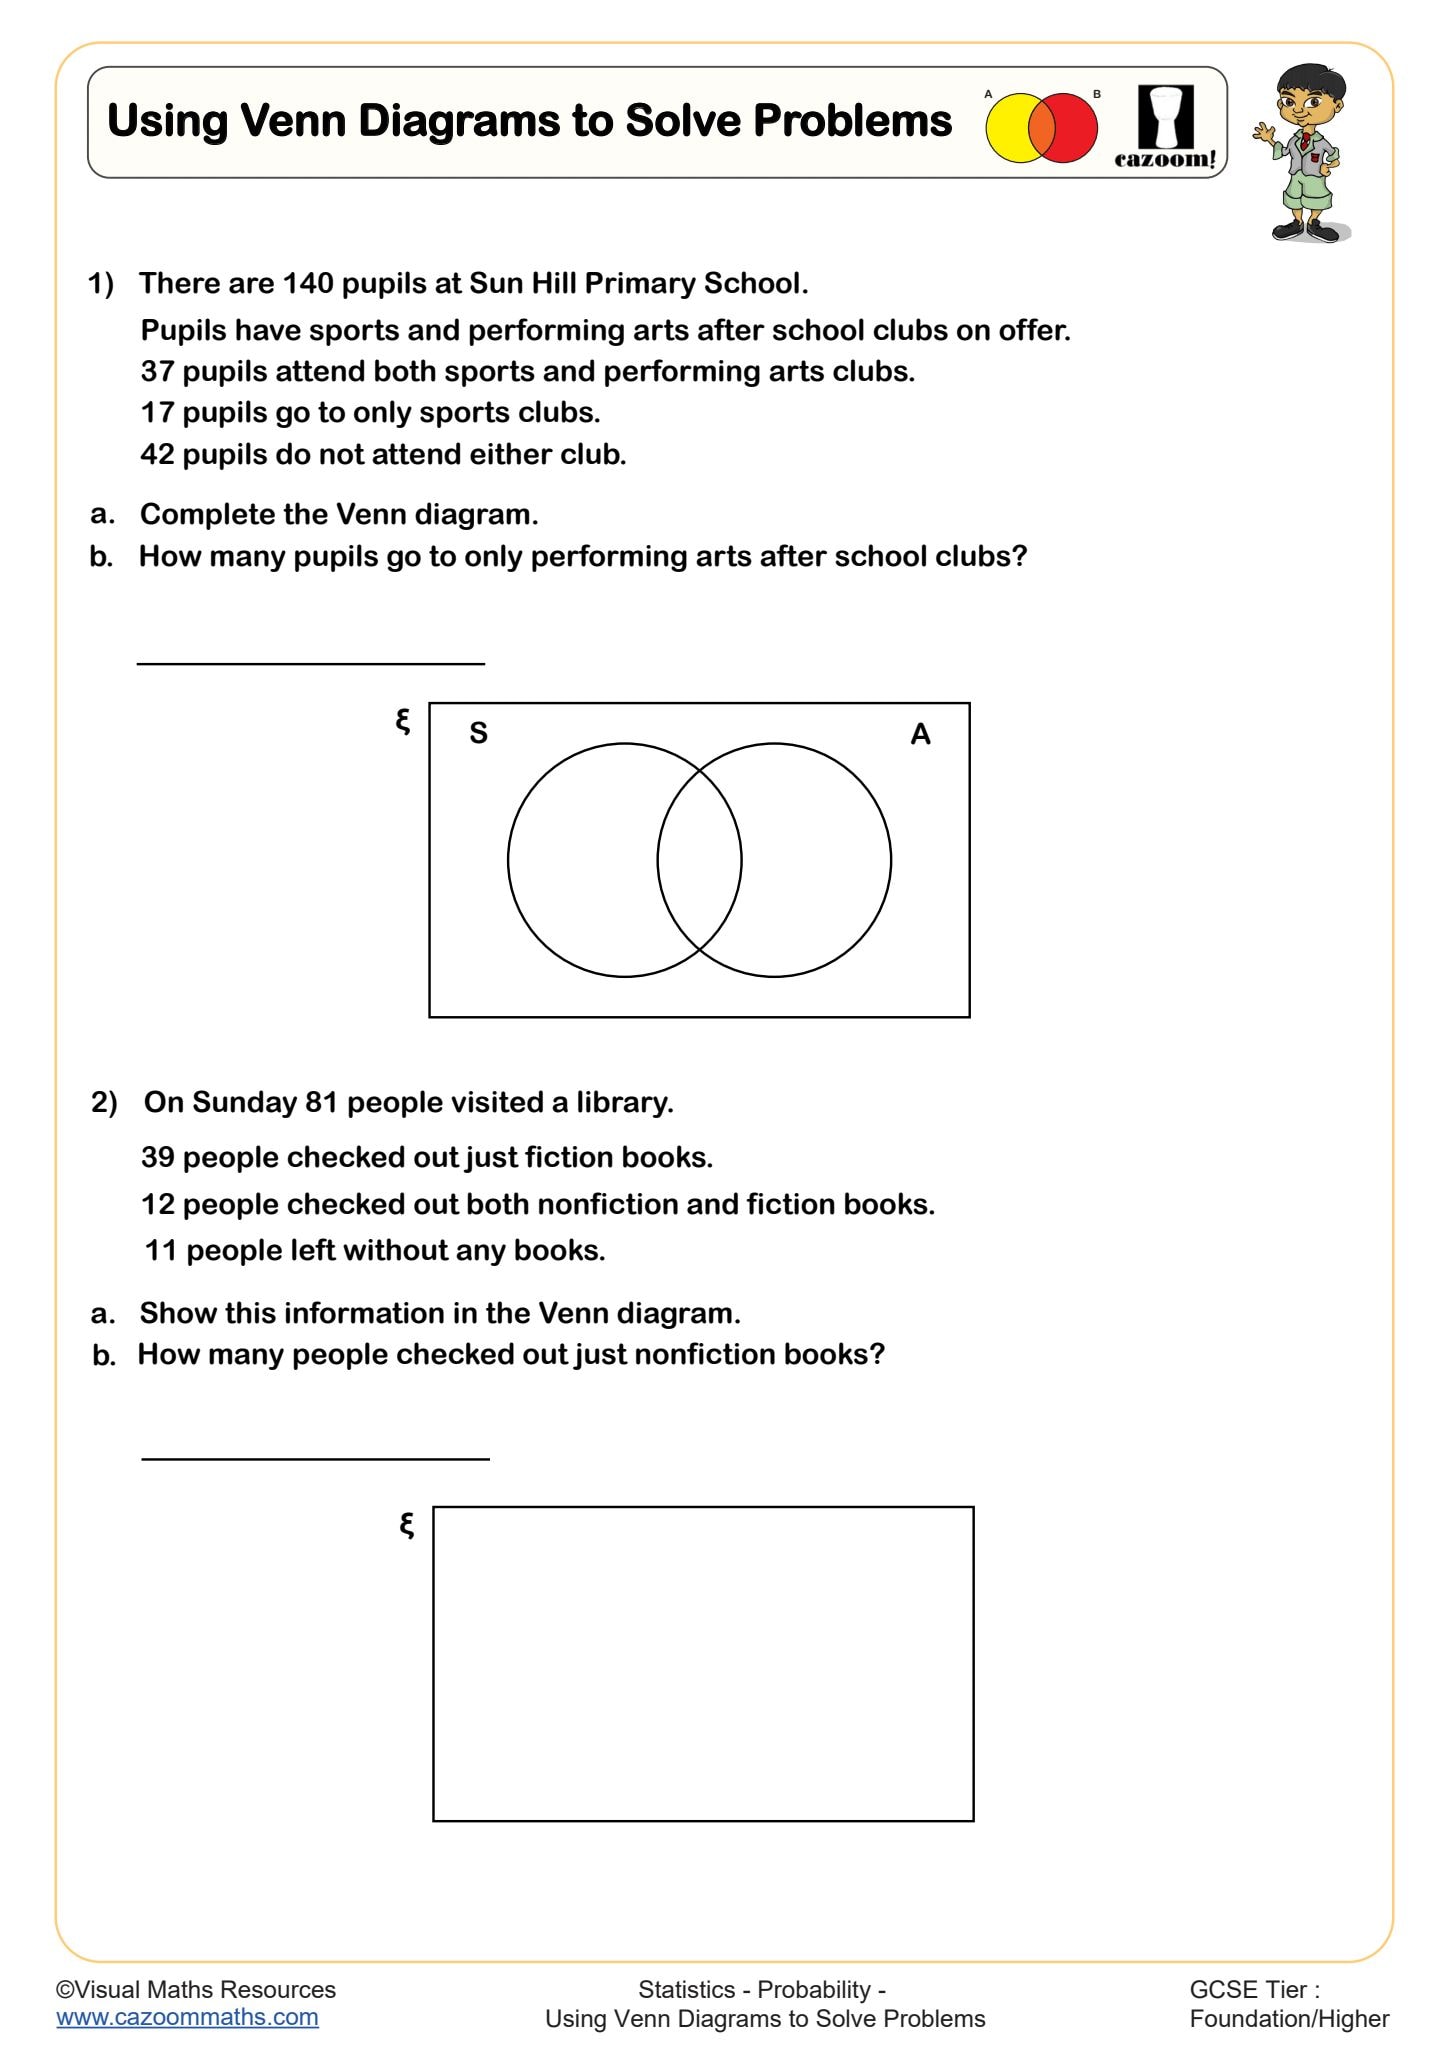
Using Venn Diagrams to Solve Problems
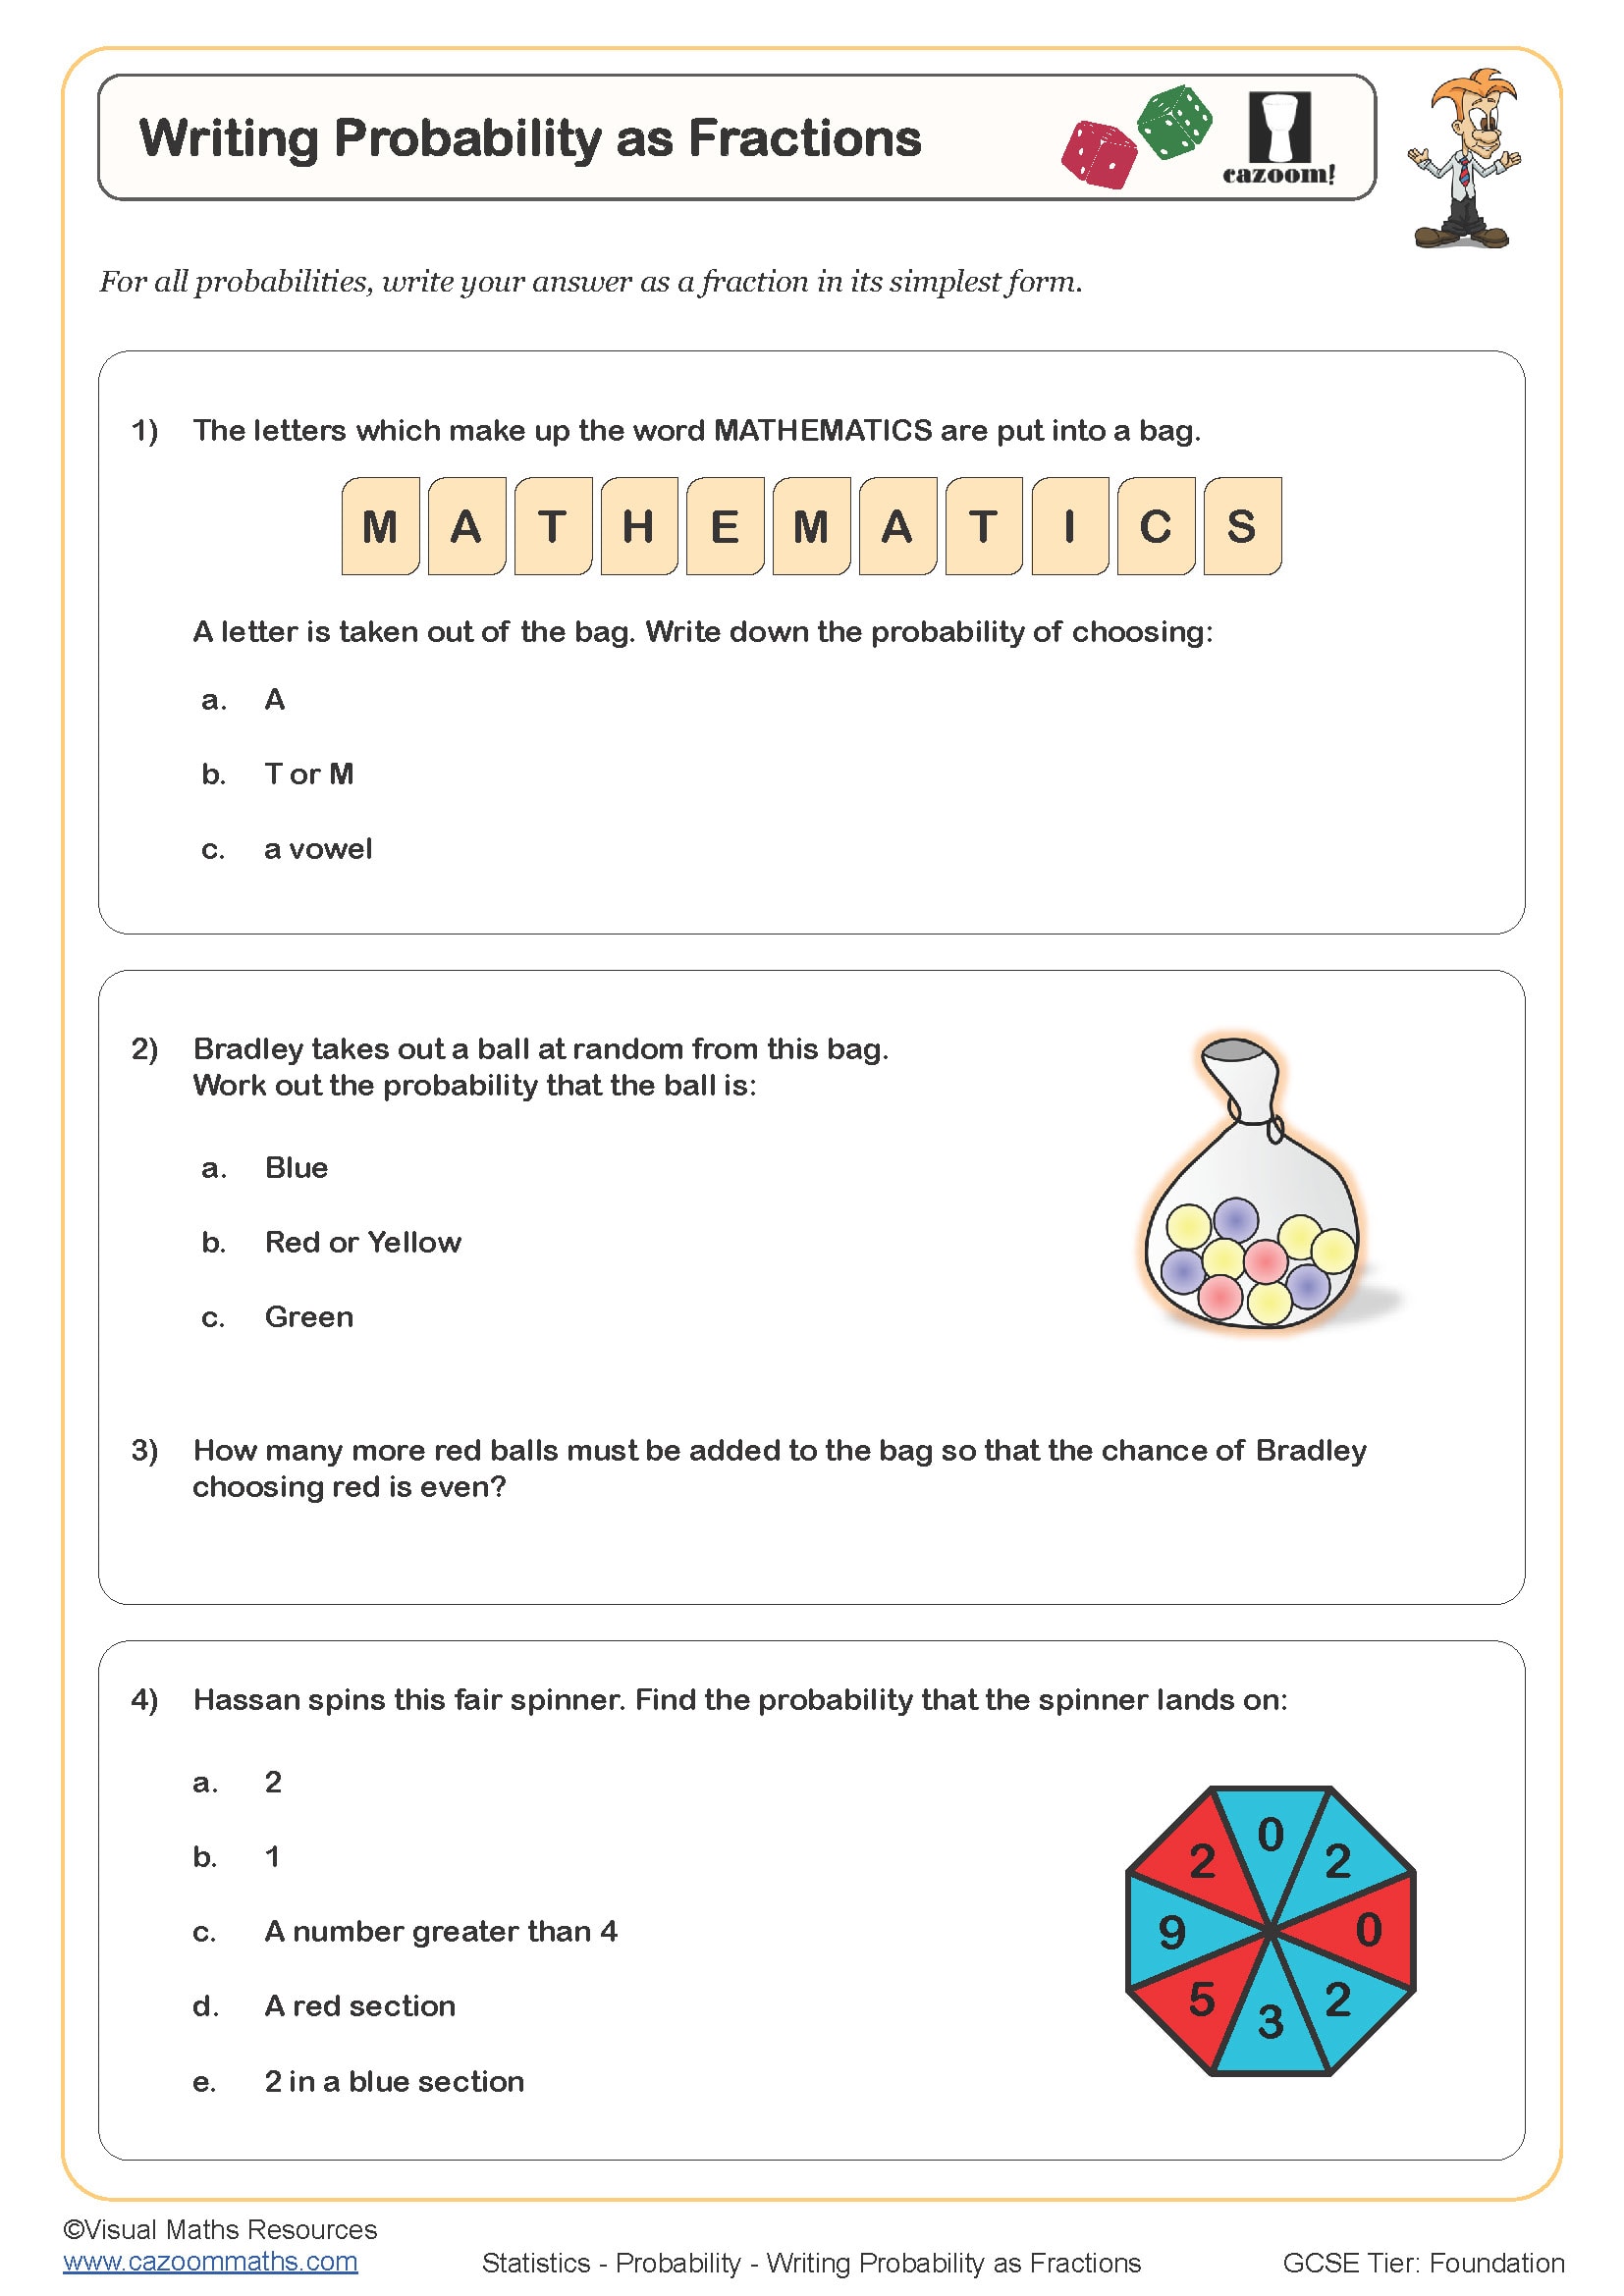
Writing Probabilty as Fractions
All worksheets are created by the team of experienced teachers at Cazoom Maths.
What do probability worksheets KS3 cover?
Probability worksheets for KS3 introduce students to calculating and expressing the likelihood of events, starting with simple outcomes from dice, spinners and coins in Year 7, then progressing to two-way tables, tree diagrams and combined events by Year 9. The National Curriculum expects students to understand probability notation (writing probabilities as fractions, decimals or percentages), work with sample spaces, and recognise that probabilities sum to one.
Students regularly lose marks on ks3 probability questions because they don't simplify fractions or because they add probabilities when they should multiply for independent events. Teachers often find that practical experiments—actually flipping coins or drawing cards—help students connect the abstract numbers to real outcomes, though the worksheets reinforce the theoretical framework needed for exam success where calculators and reasoning matter more than physical trials.
Which year groups use these probability worksheets?
These worksheets support Year 7, Year 8 and Year 9 students working through the KS3 programme of study. Year 7 typically focuses on probability language (impossible, unlikely, even chance, likely, certain), placing probabilities on a scale from 0 to 1, and calculating simple probabilities from equally likely outcomes such as rolling a standard die or picking a coloured counter from a bag.
By Year 8, students tackle more complex scenarios including listing systematic outcomes and using two-way tables to organise information about combined events. Year 9 work often introduces tree diagrams for dependent and independent events, expectation (predicting how many times an outcome occurs in repeated trials), and conditional probability. Teachers notice the jump between listing outcomes and actually calculating combined probabilities catches many students—they can draw a tree diagram but struggle to multiply along branches correctly.
How do probability clues help students solve problems?
Probability clues are statements like 'the probability of rain is 0.3' or 'picking a red card is twice as likely as picking a blue card'—information students must interpret to find unknown probabilities or complete sample spaces. This skill requires algebraic thinking because students often set up equations where probabilities must sum to one, then solve for missing values. Teachers see students who can calculate straightforward probabilities struggle when they need to reason backwards from given information.
Real-world applications appear constantly in weather forecasting, medical diagnosis and quality control. A factory might state that 2% of components are defective—engineers use this probability clue to predict how many faulty parts will appear in a batch of 5000, then plan inspections accordingly. Understanding how to extract and apply probability information from context prepares students for data science and risk assessment roles where decisions depend on interpreting likelihood statements correctly.
How should teachers use these probability worksheets?
The worksheets build skills through structured questions that increase in difficulty, starting with direct calculation then moving to multi-step problems requiring reasoning and justification. Answer sheets allow students to self-mark during independent practice or let teachers quickly identify which concepts need revisiting—particularly useful since probability misconceptions often hide until students explain their thinking aloud.
Many teachers use these sheets for targeted intervention with students who find probability abstract, assigning specific question types (like 'listing outcomes' or 'tree diagrams') rather than whole worksheets. They work well as homework after introducing a new concept because students can attempt problems without time pressure, then discuss errors in the following lesson. Paired work often reveals misunderstandings—when one student explains why two events are independent whilst another disagrees, the discussion usually clarifies the concept better than teacher explanation alone.