Year 8 Statistics Worksheets
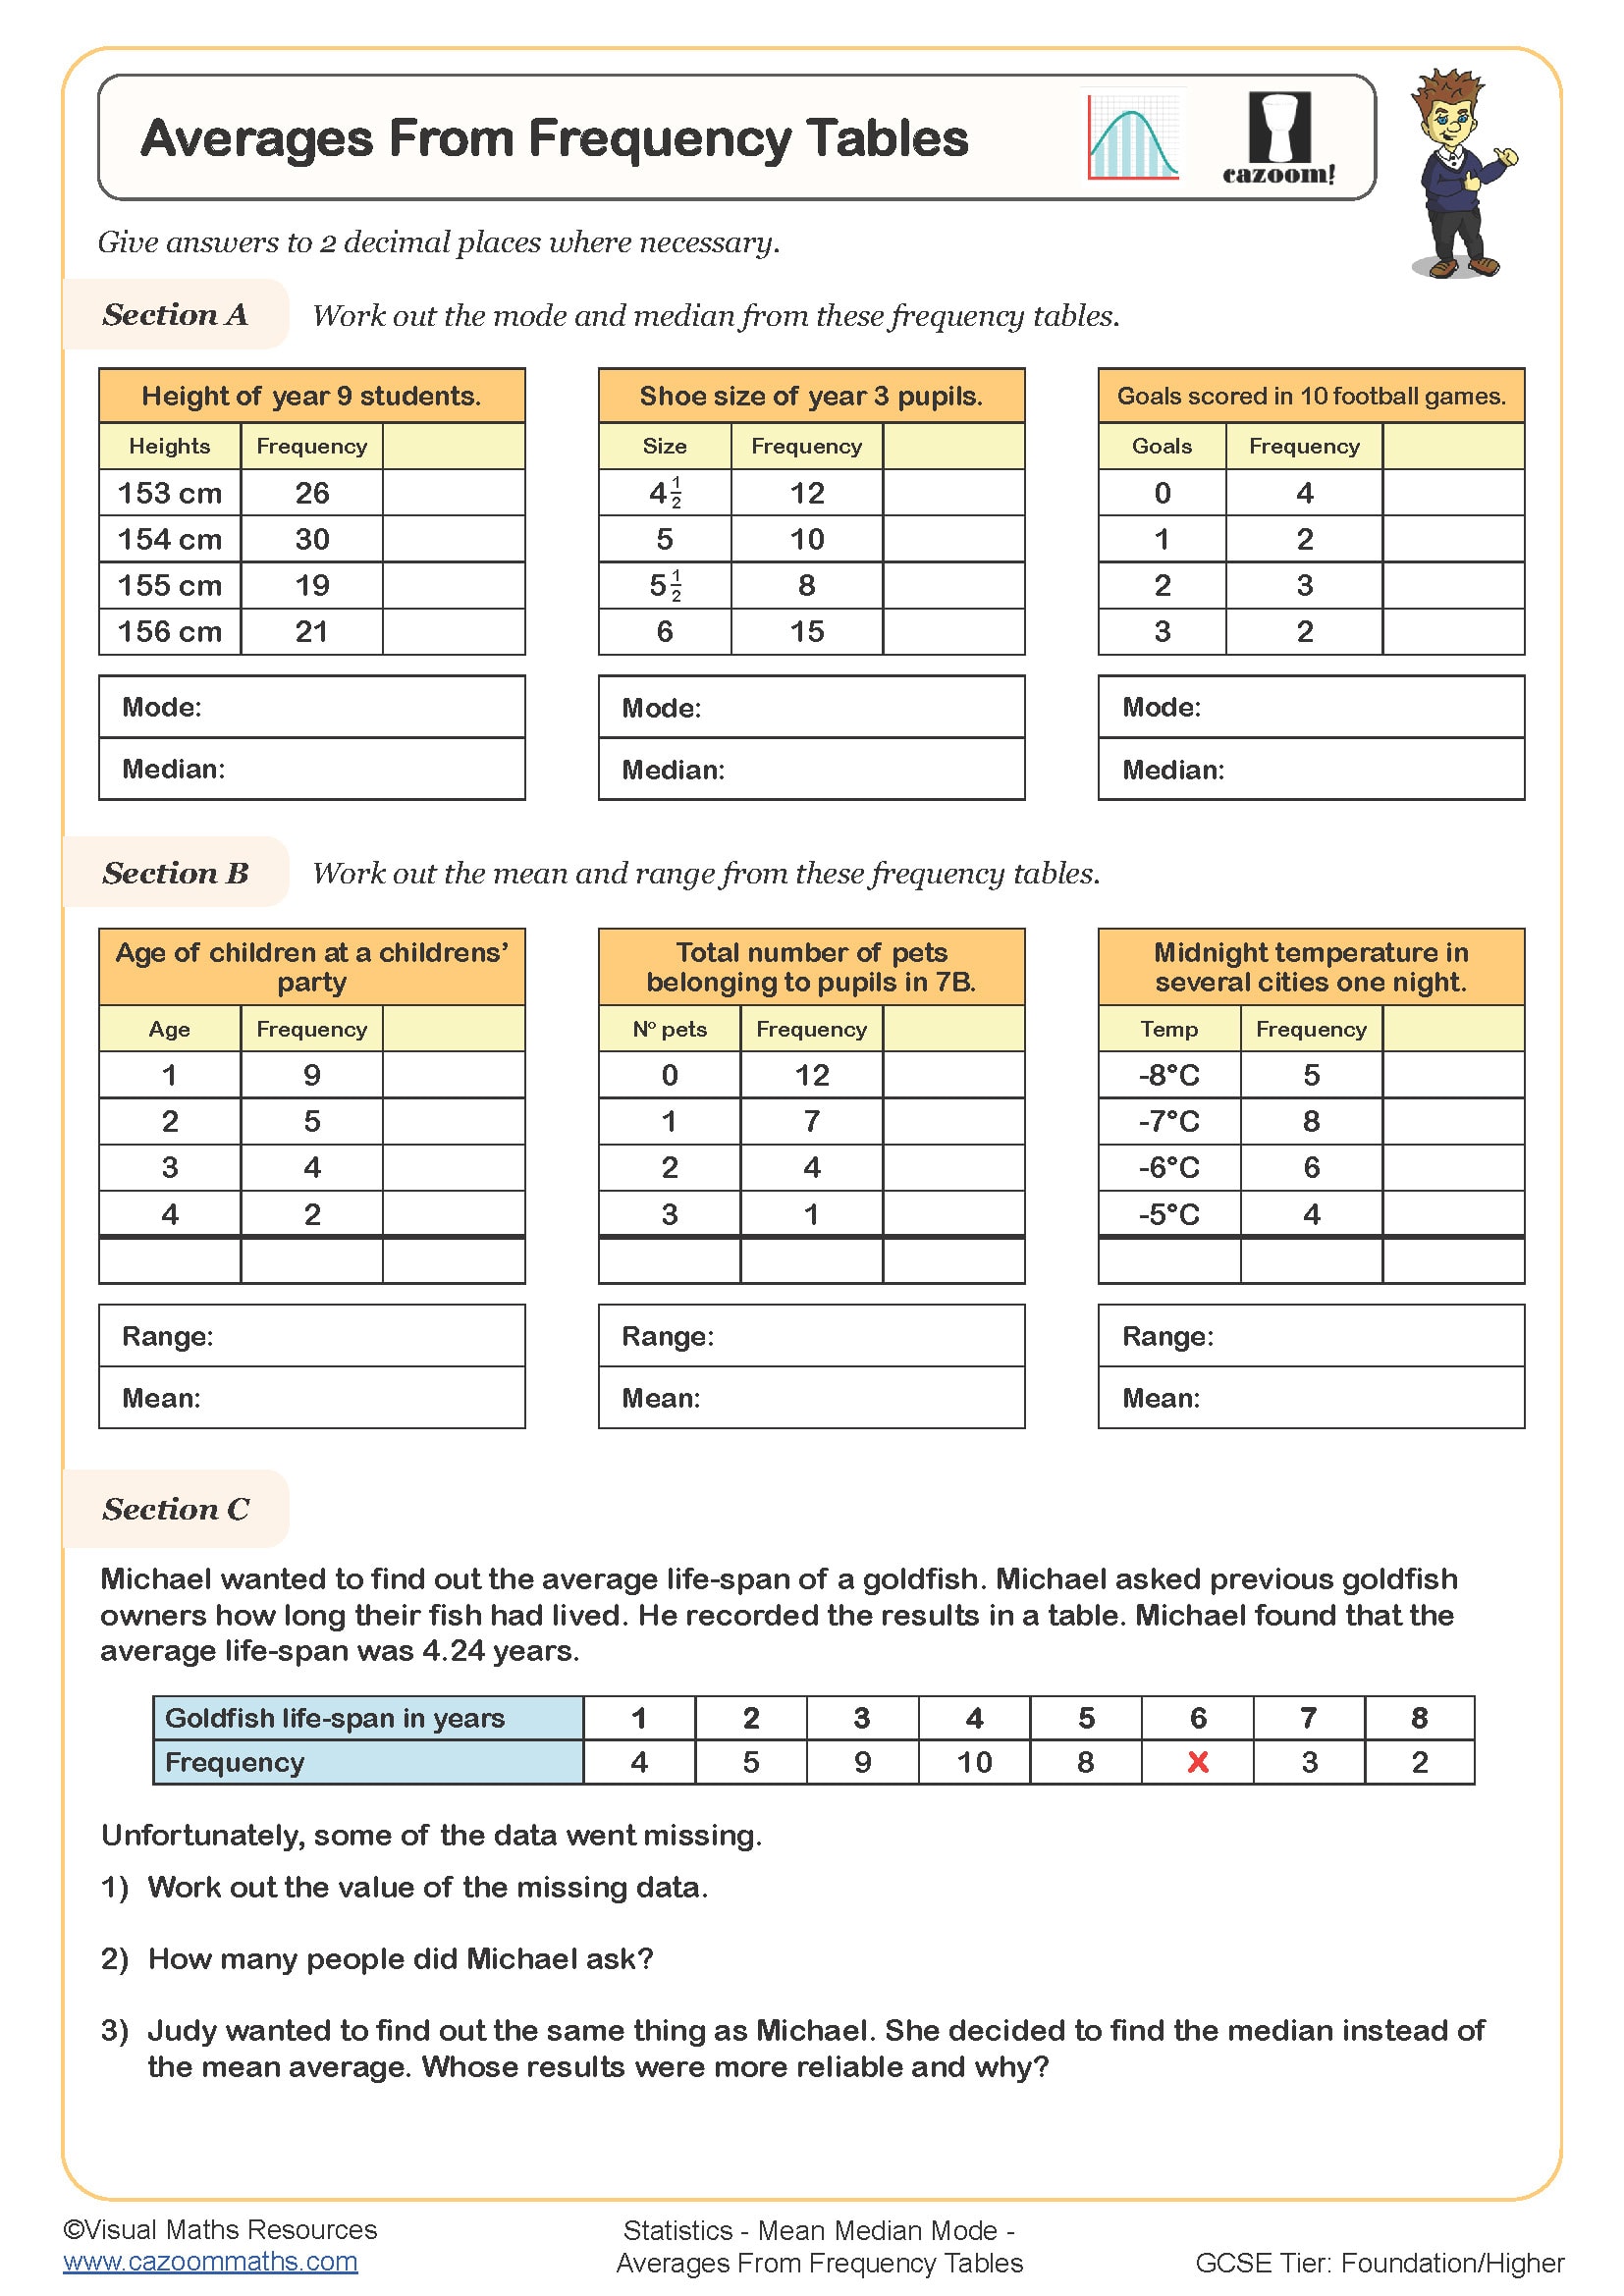
Averages from Frequency Tables
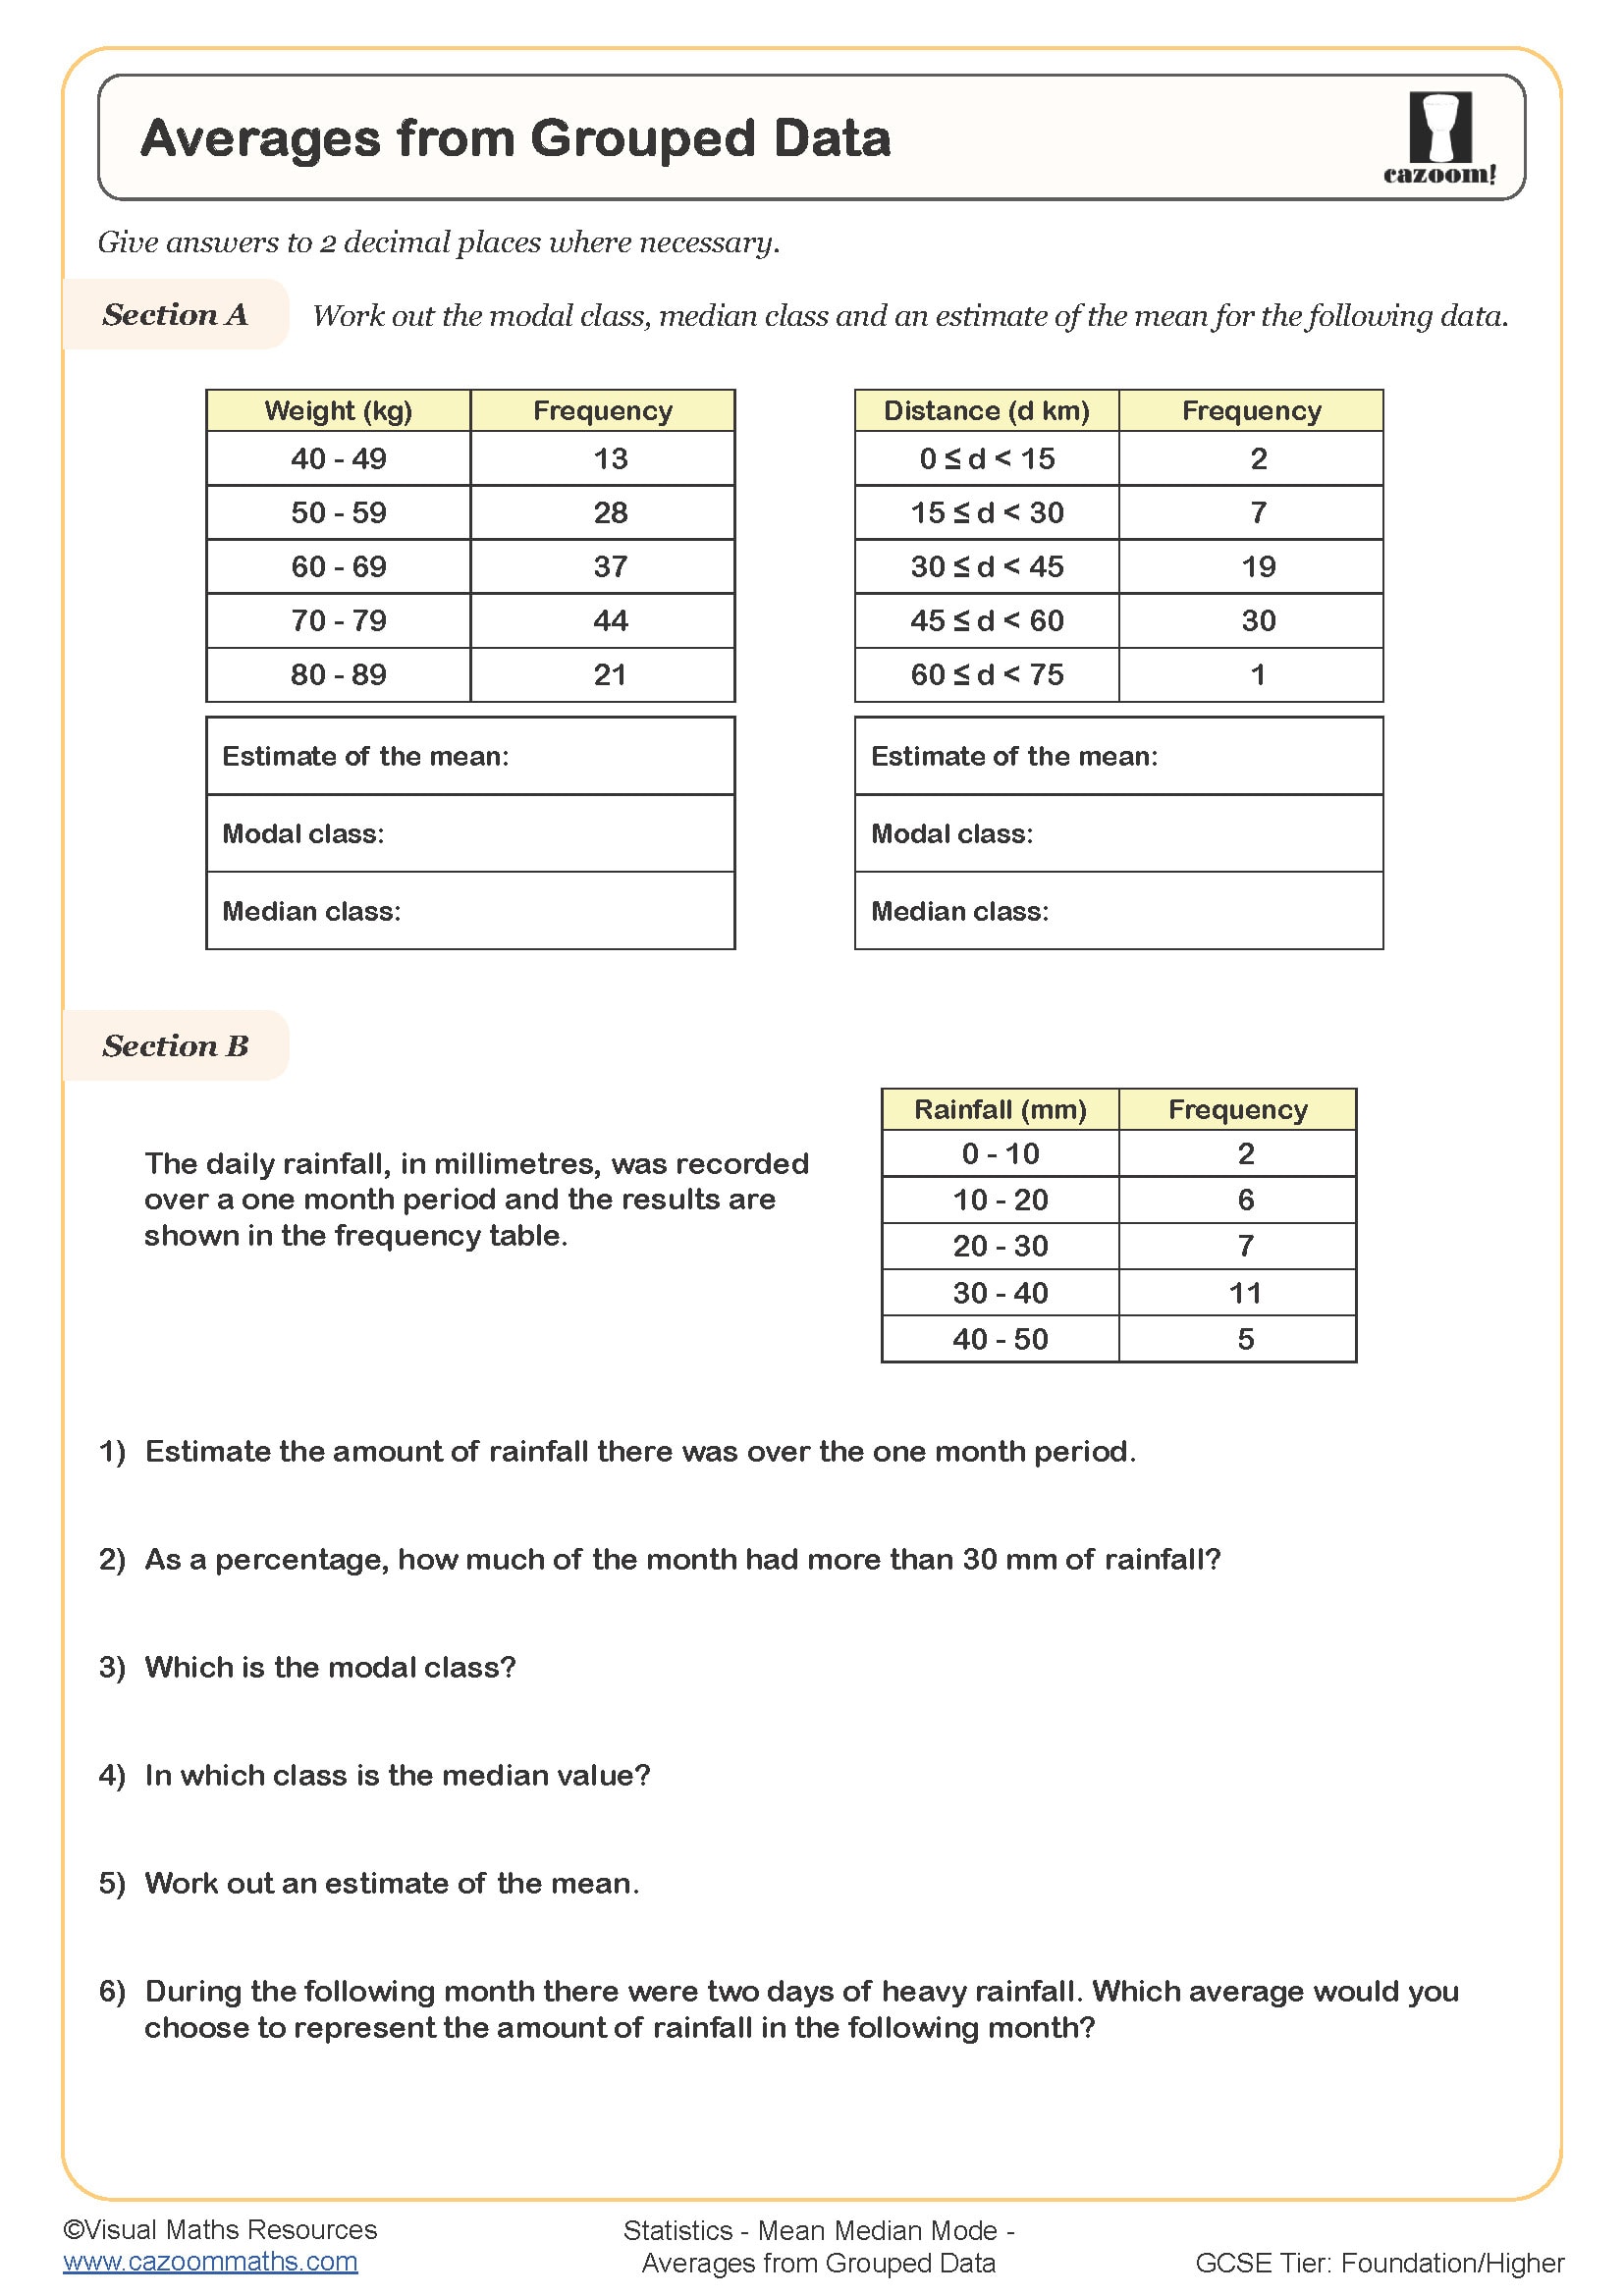
Averages from Grouped Data
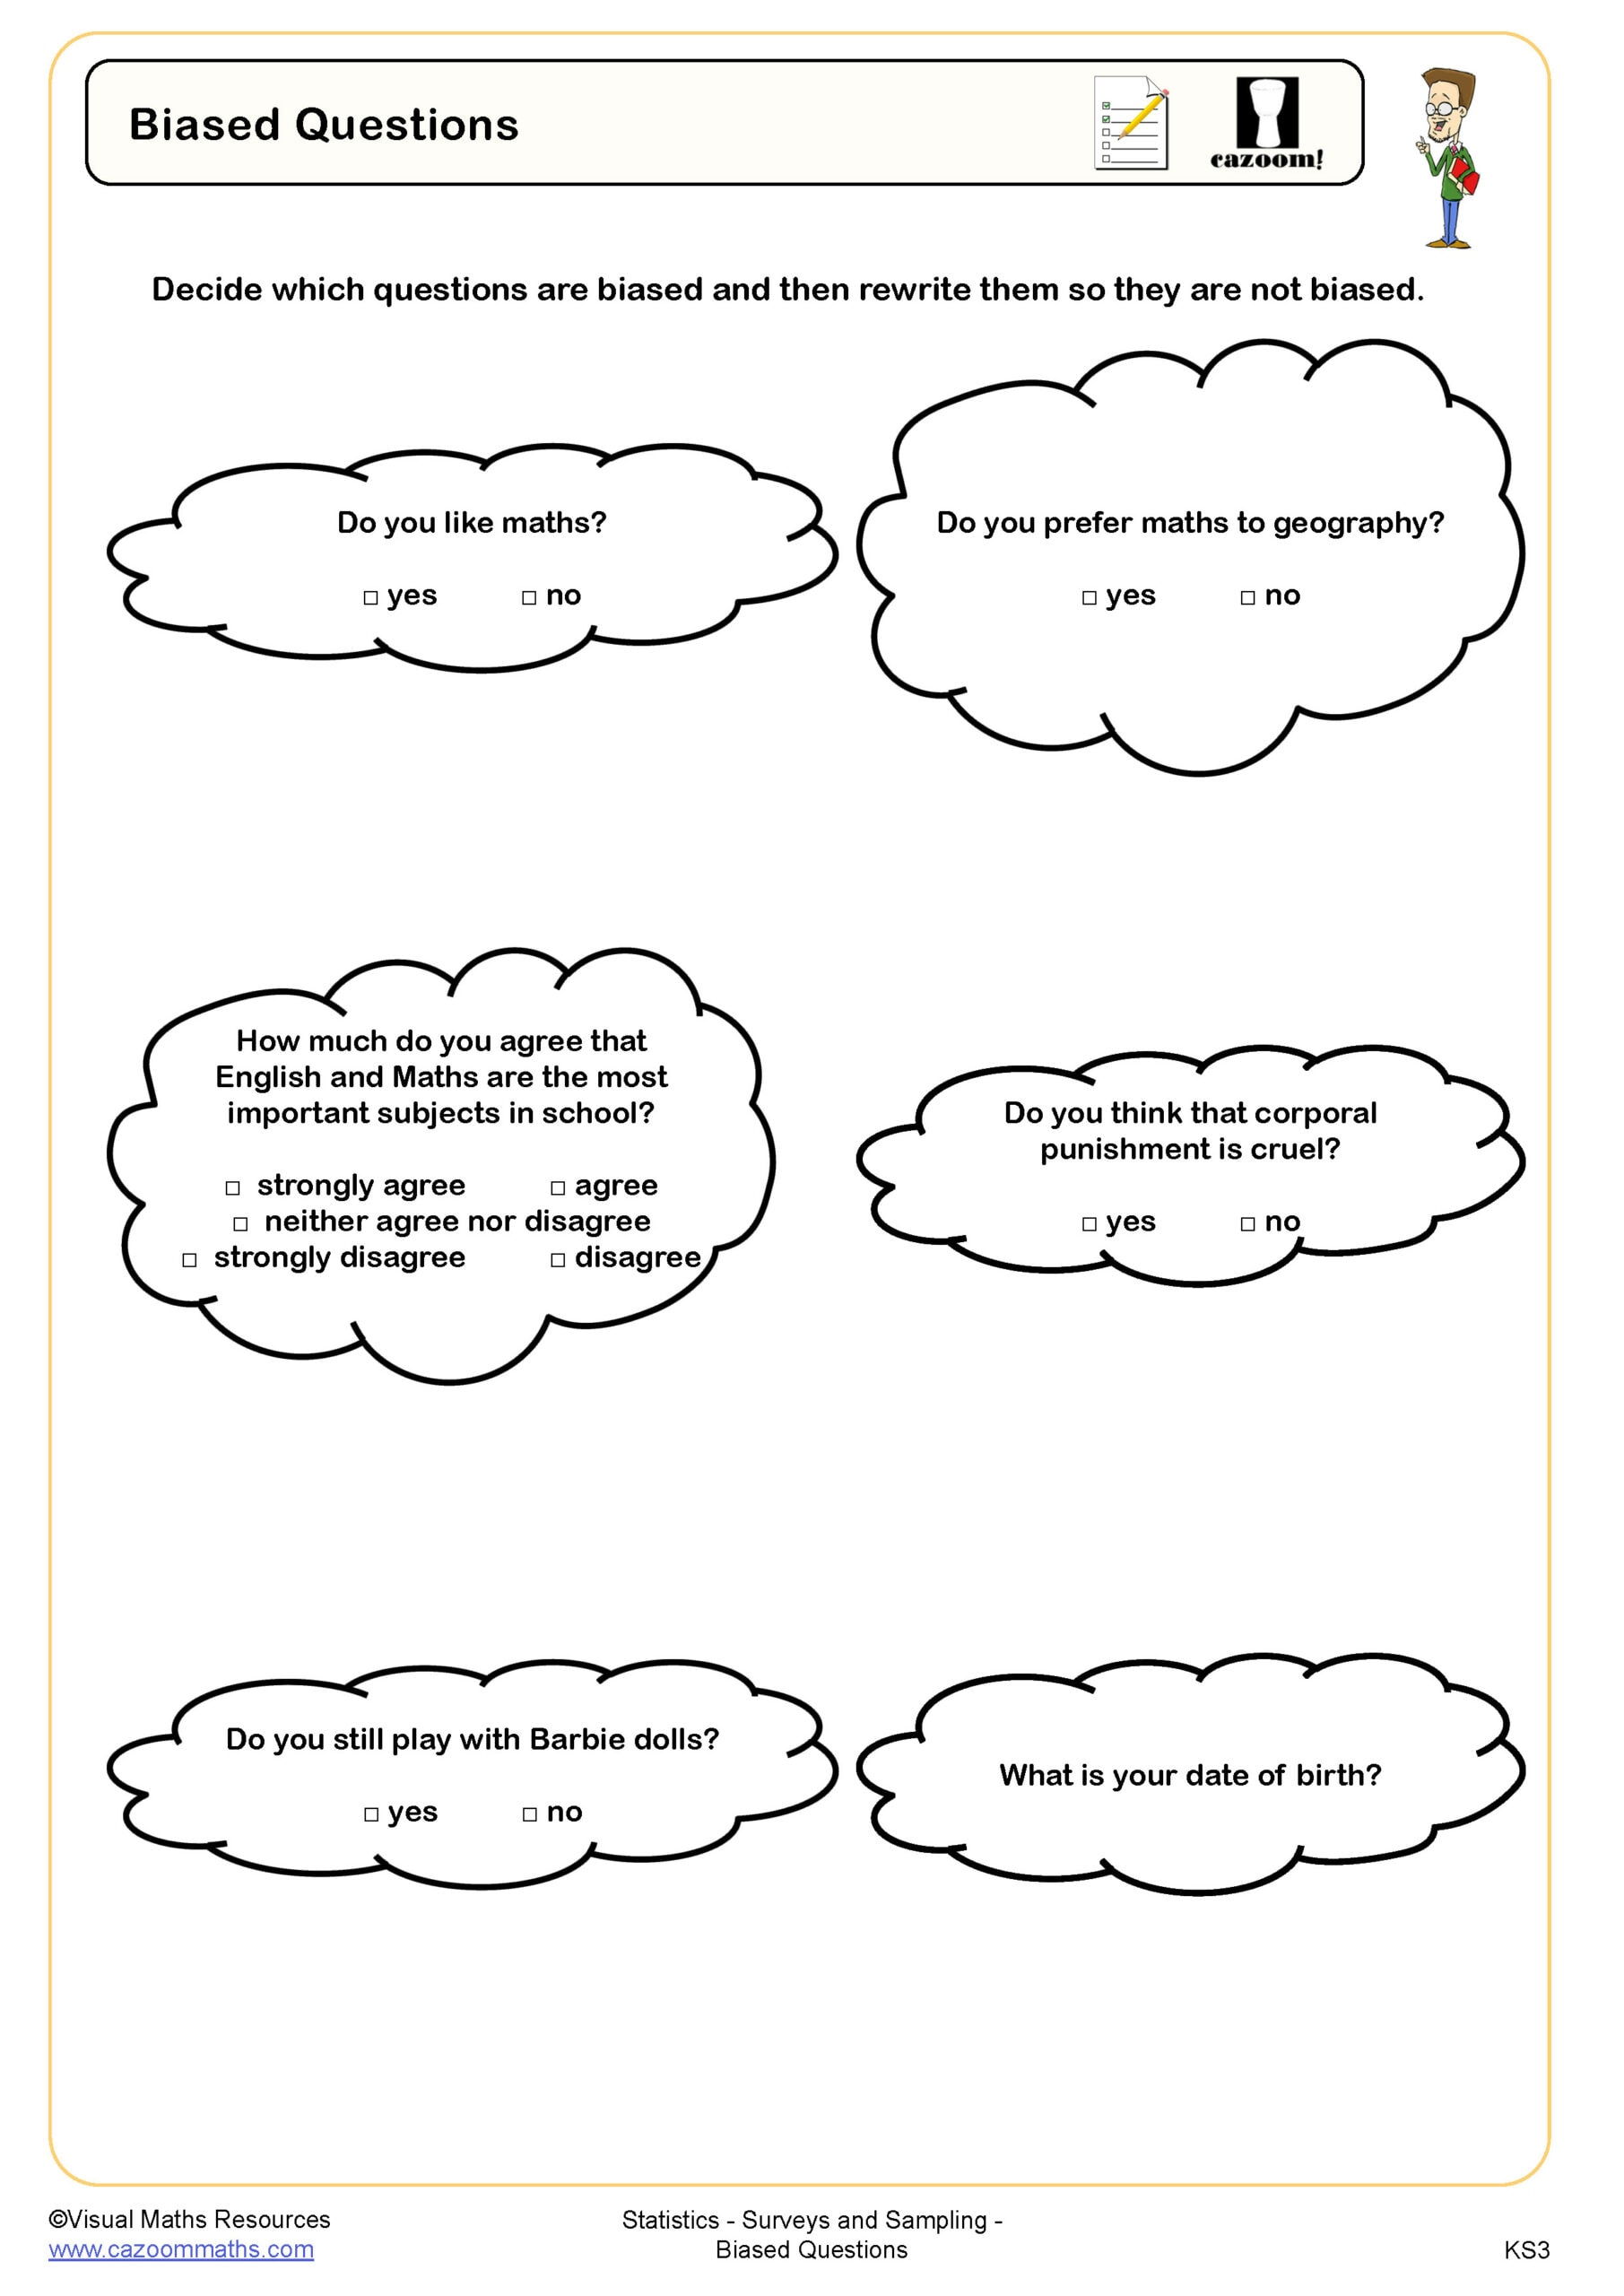
Biased Questions
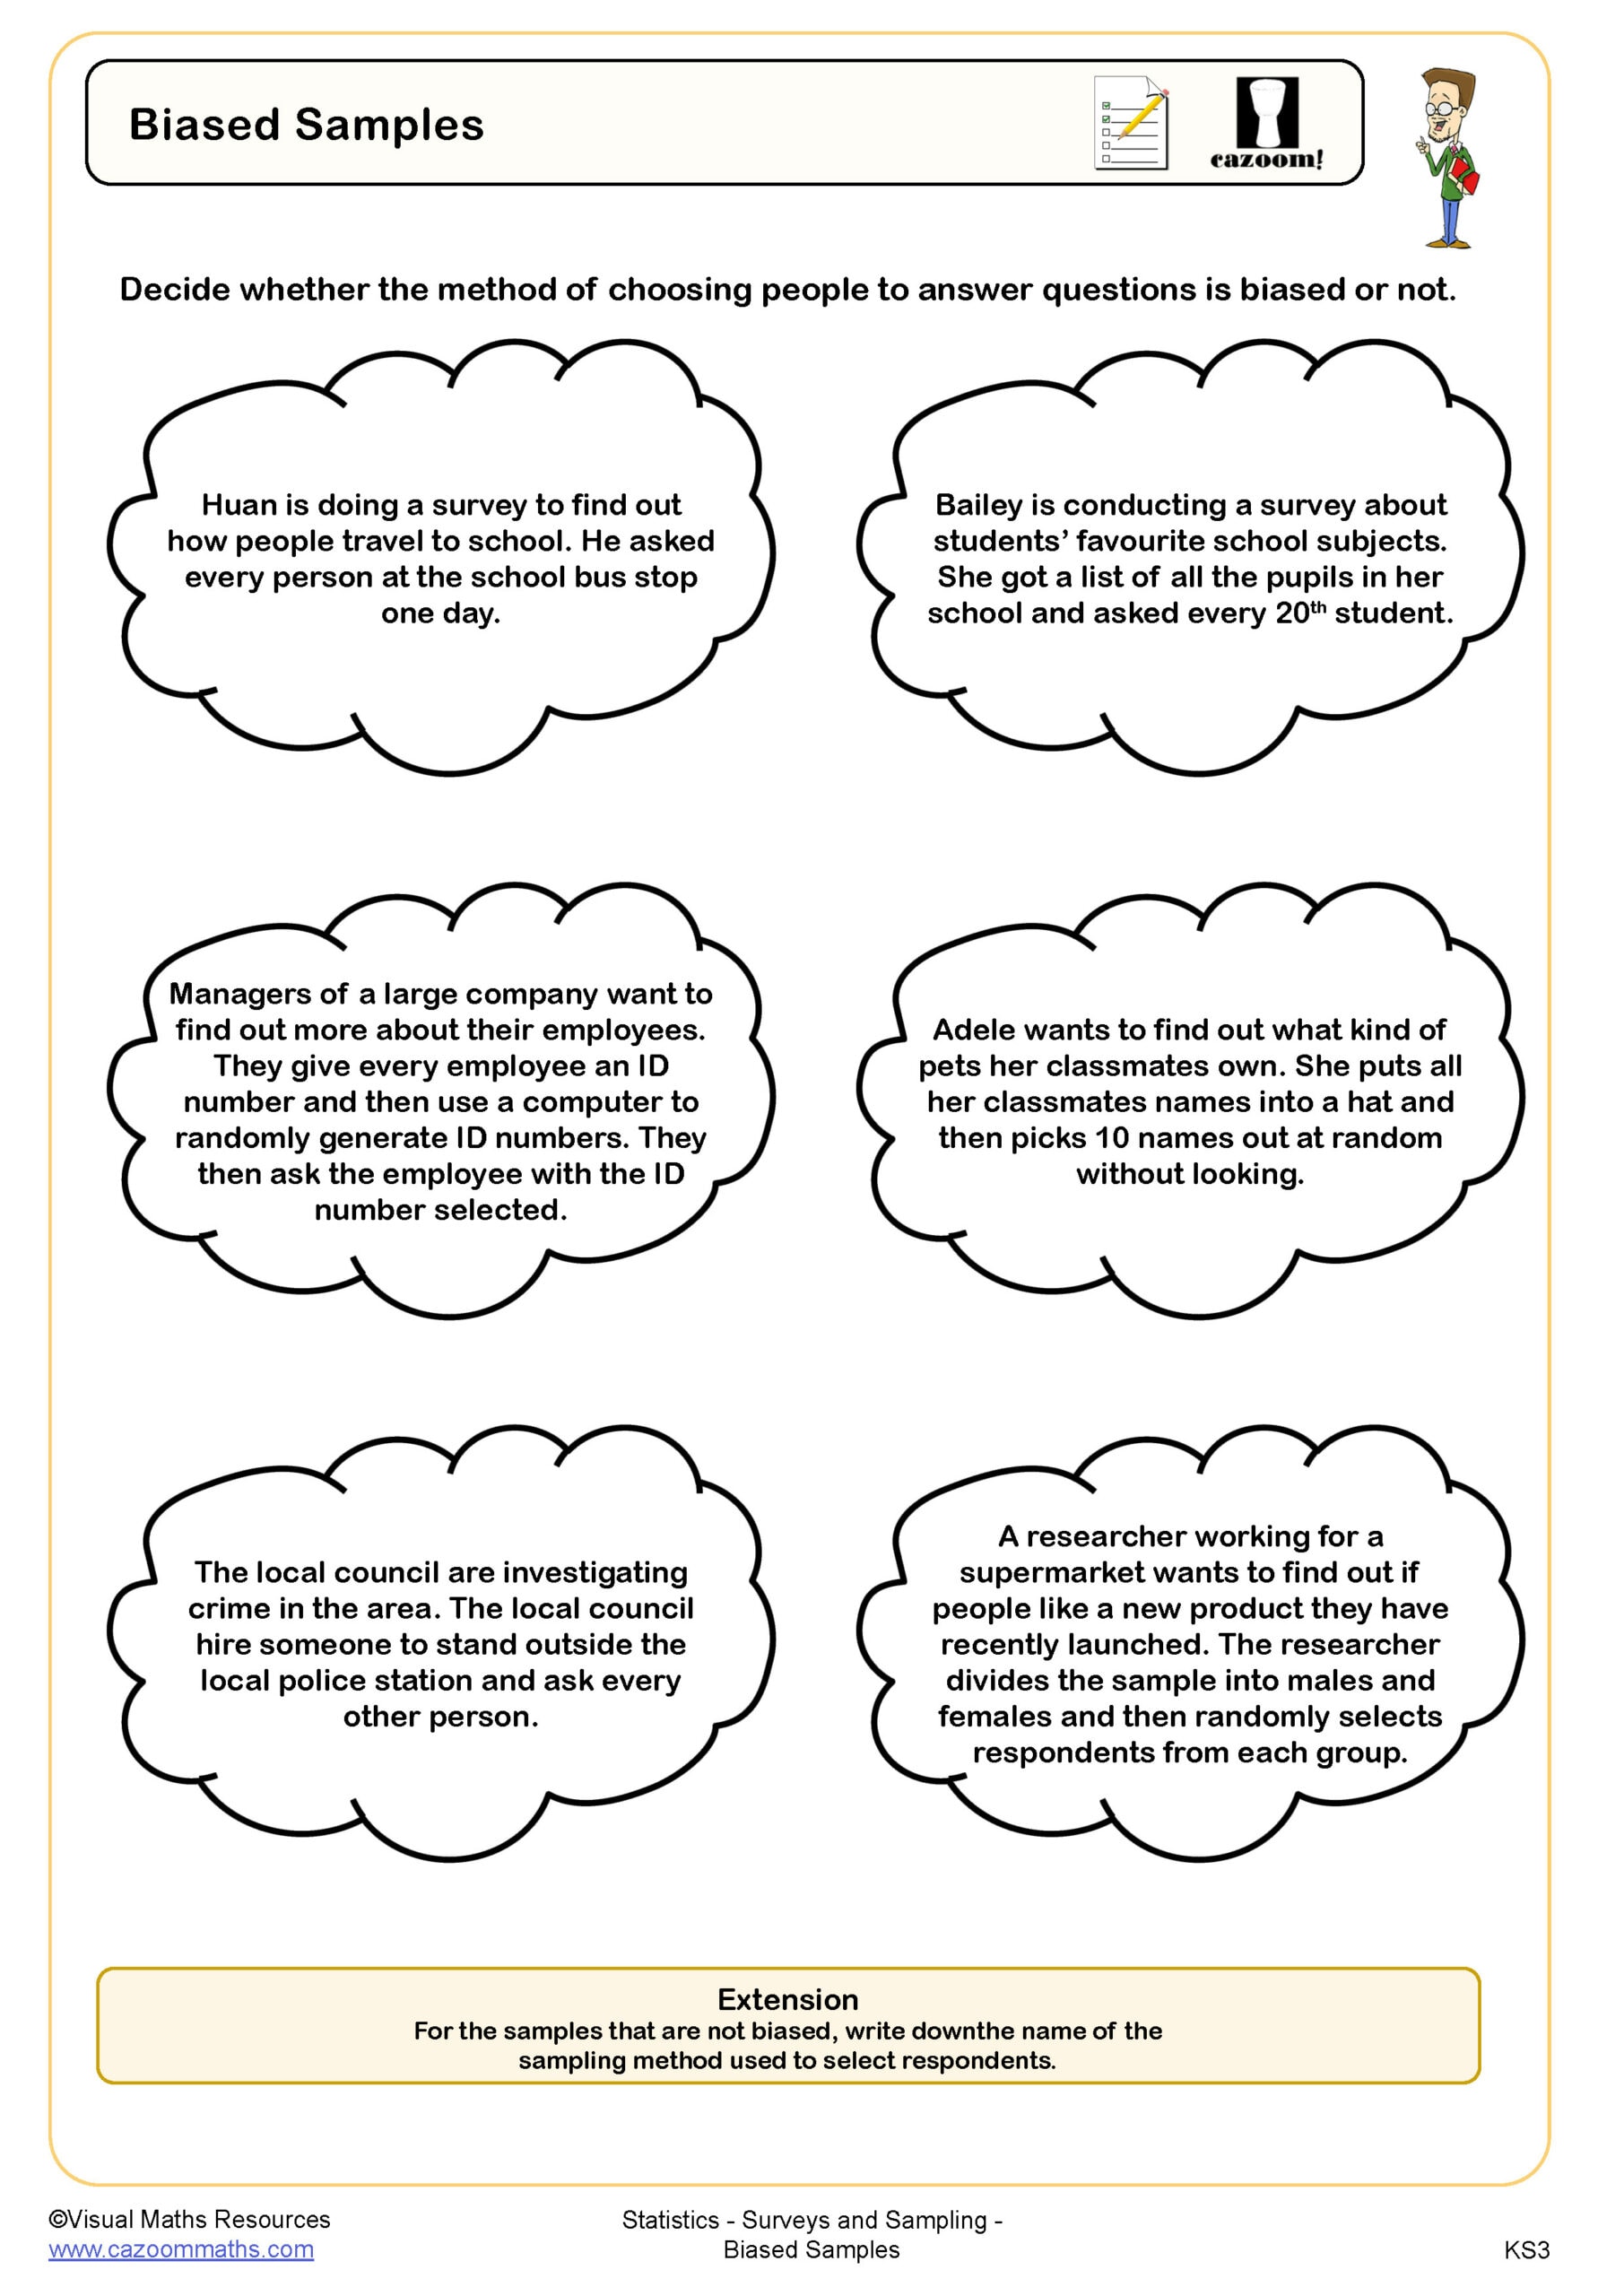
Biased Samples
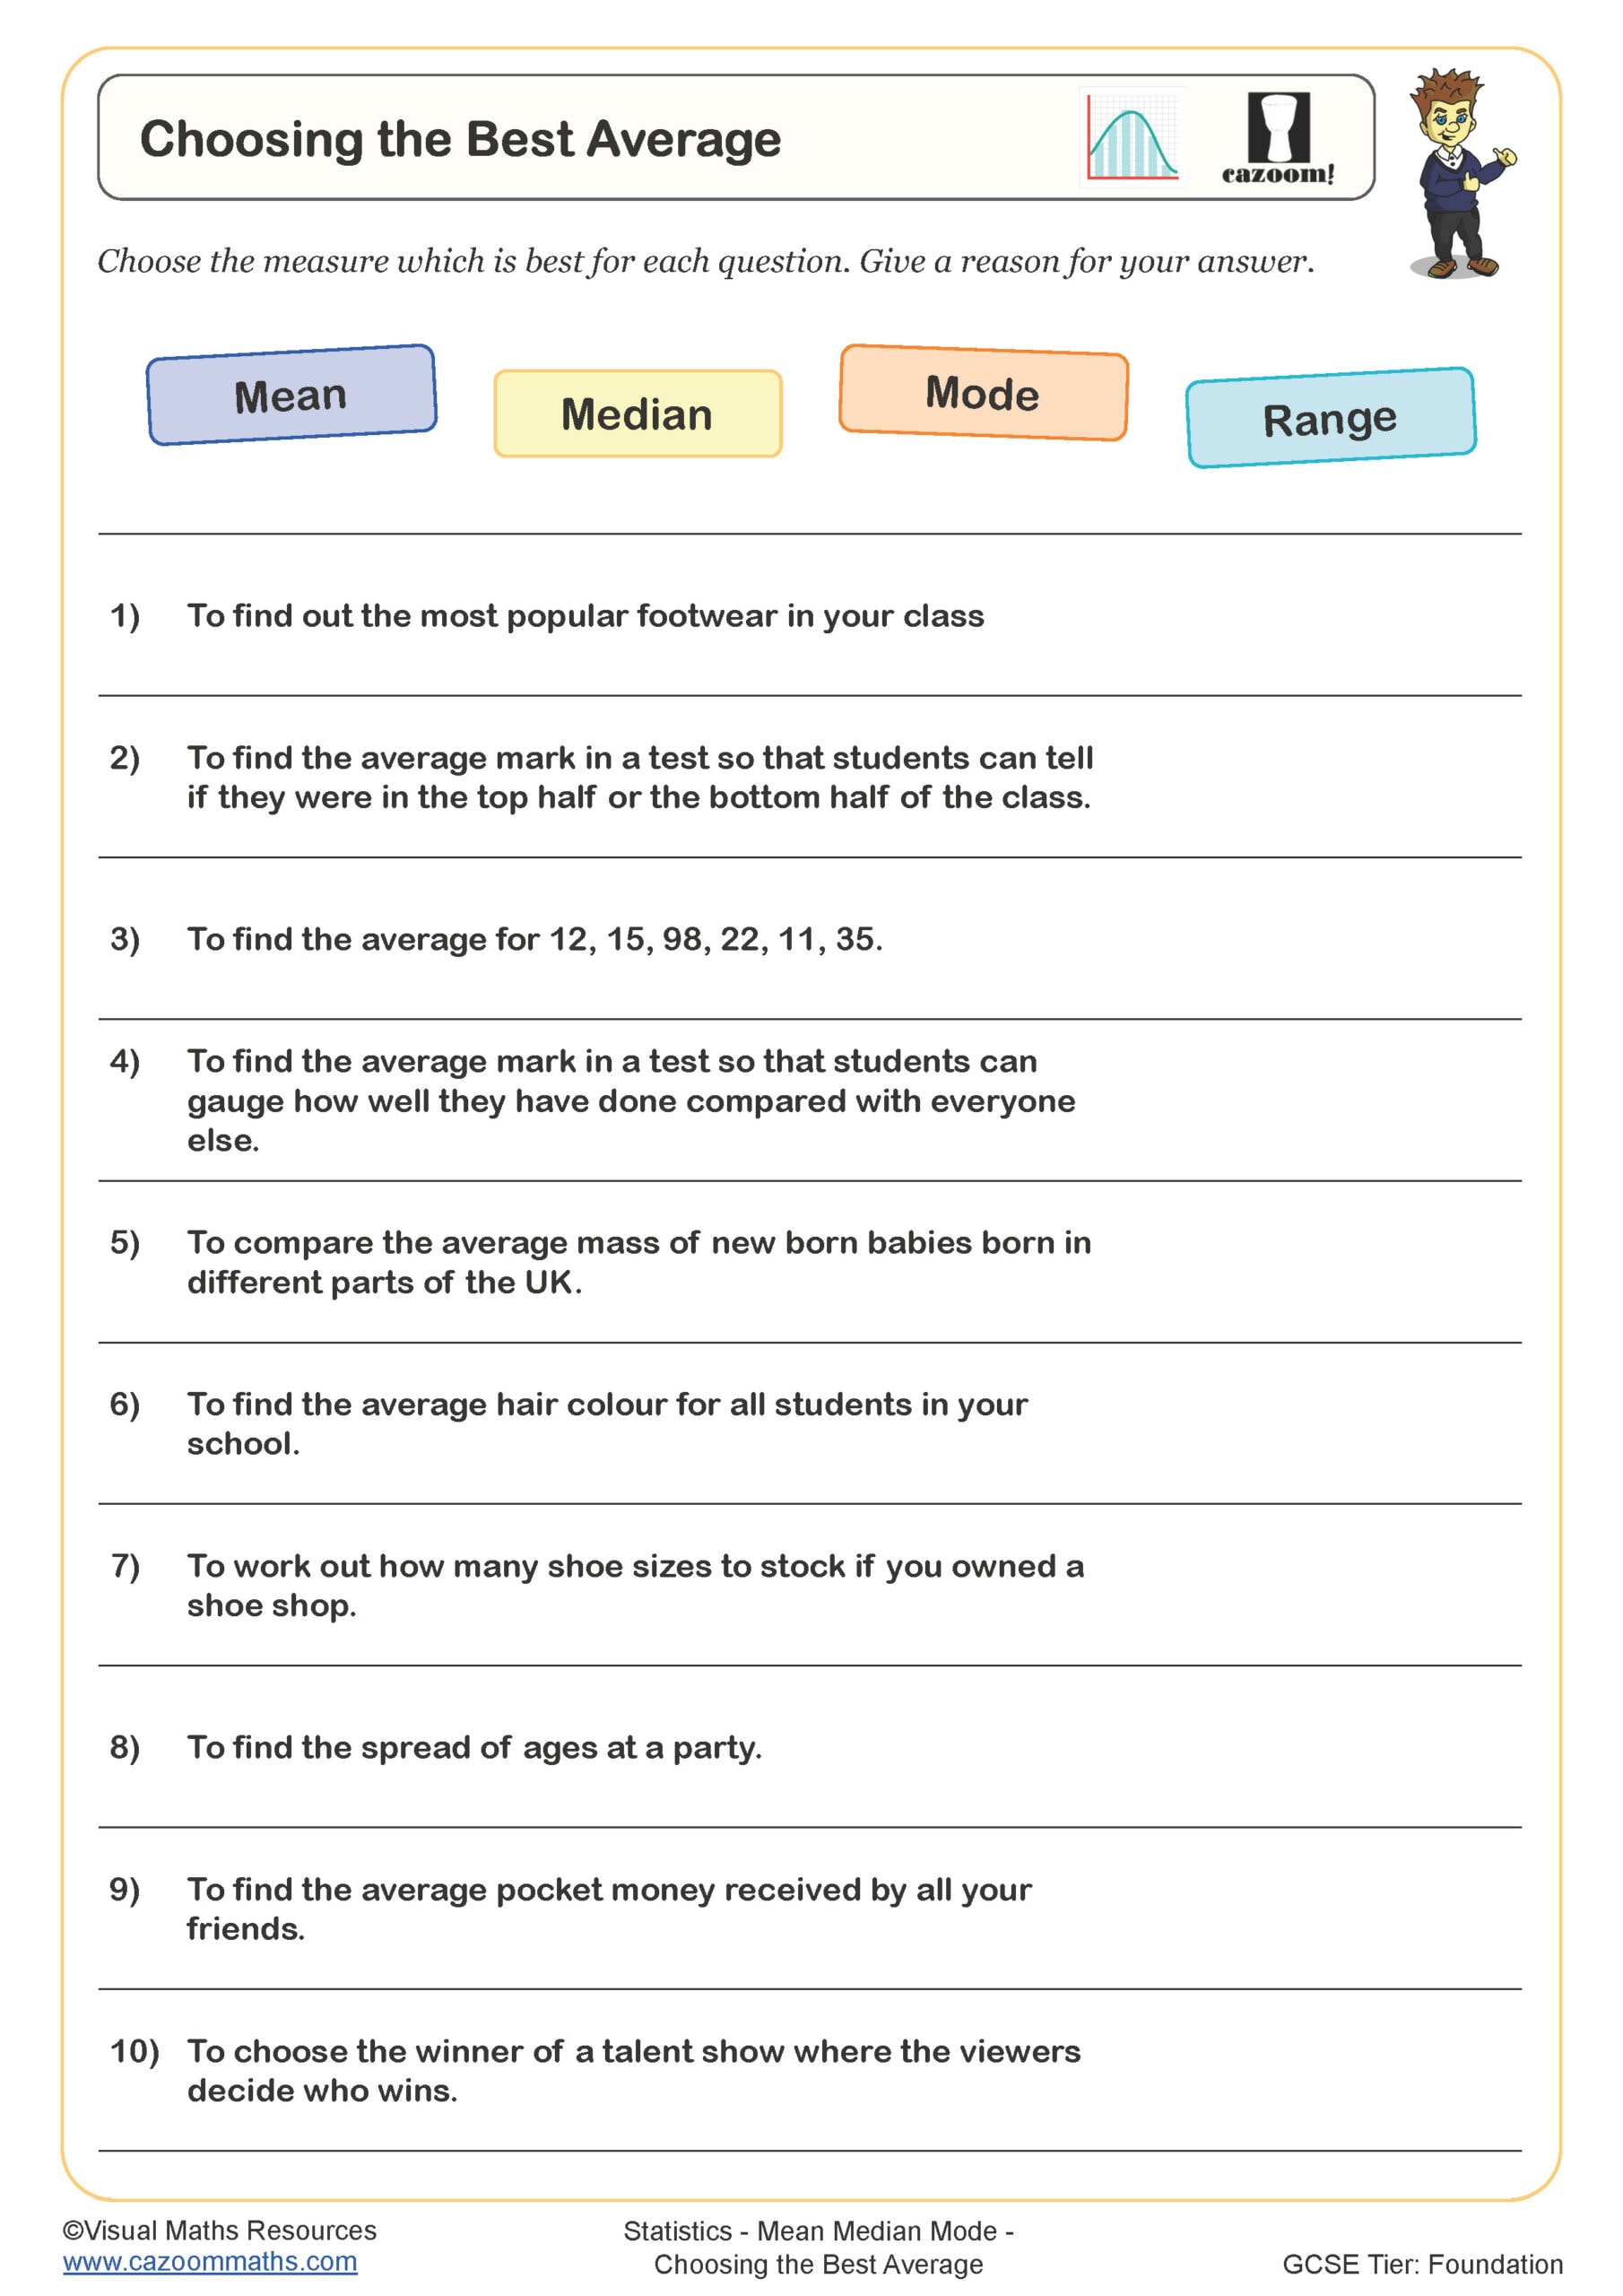
Choosing the Best Average
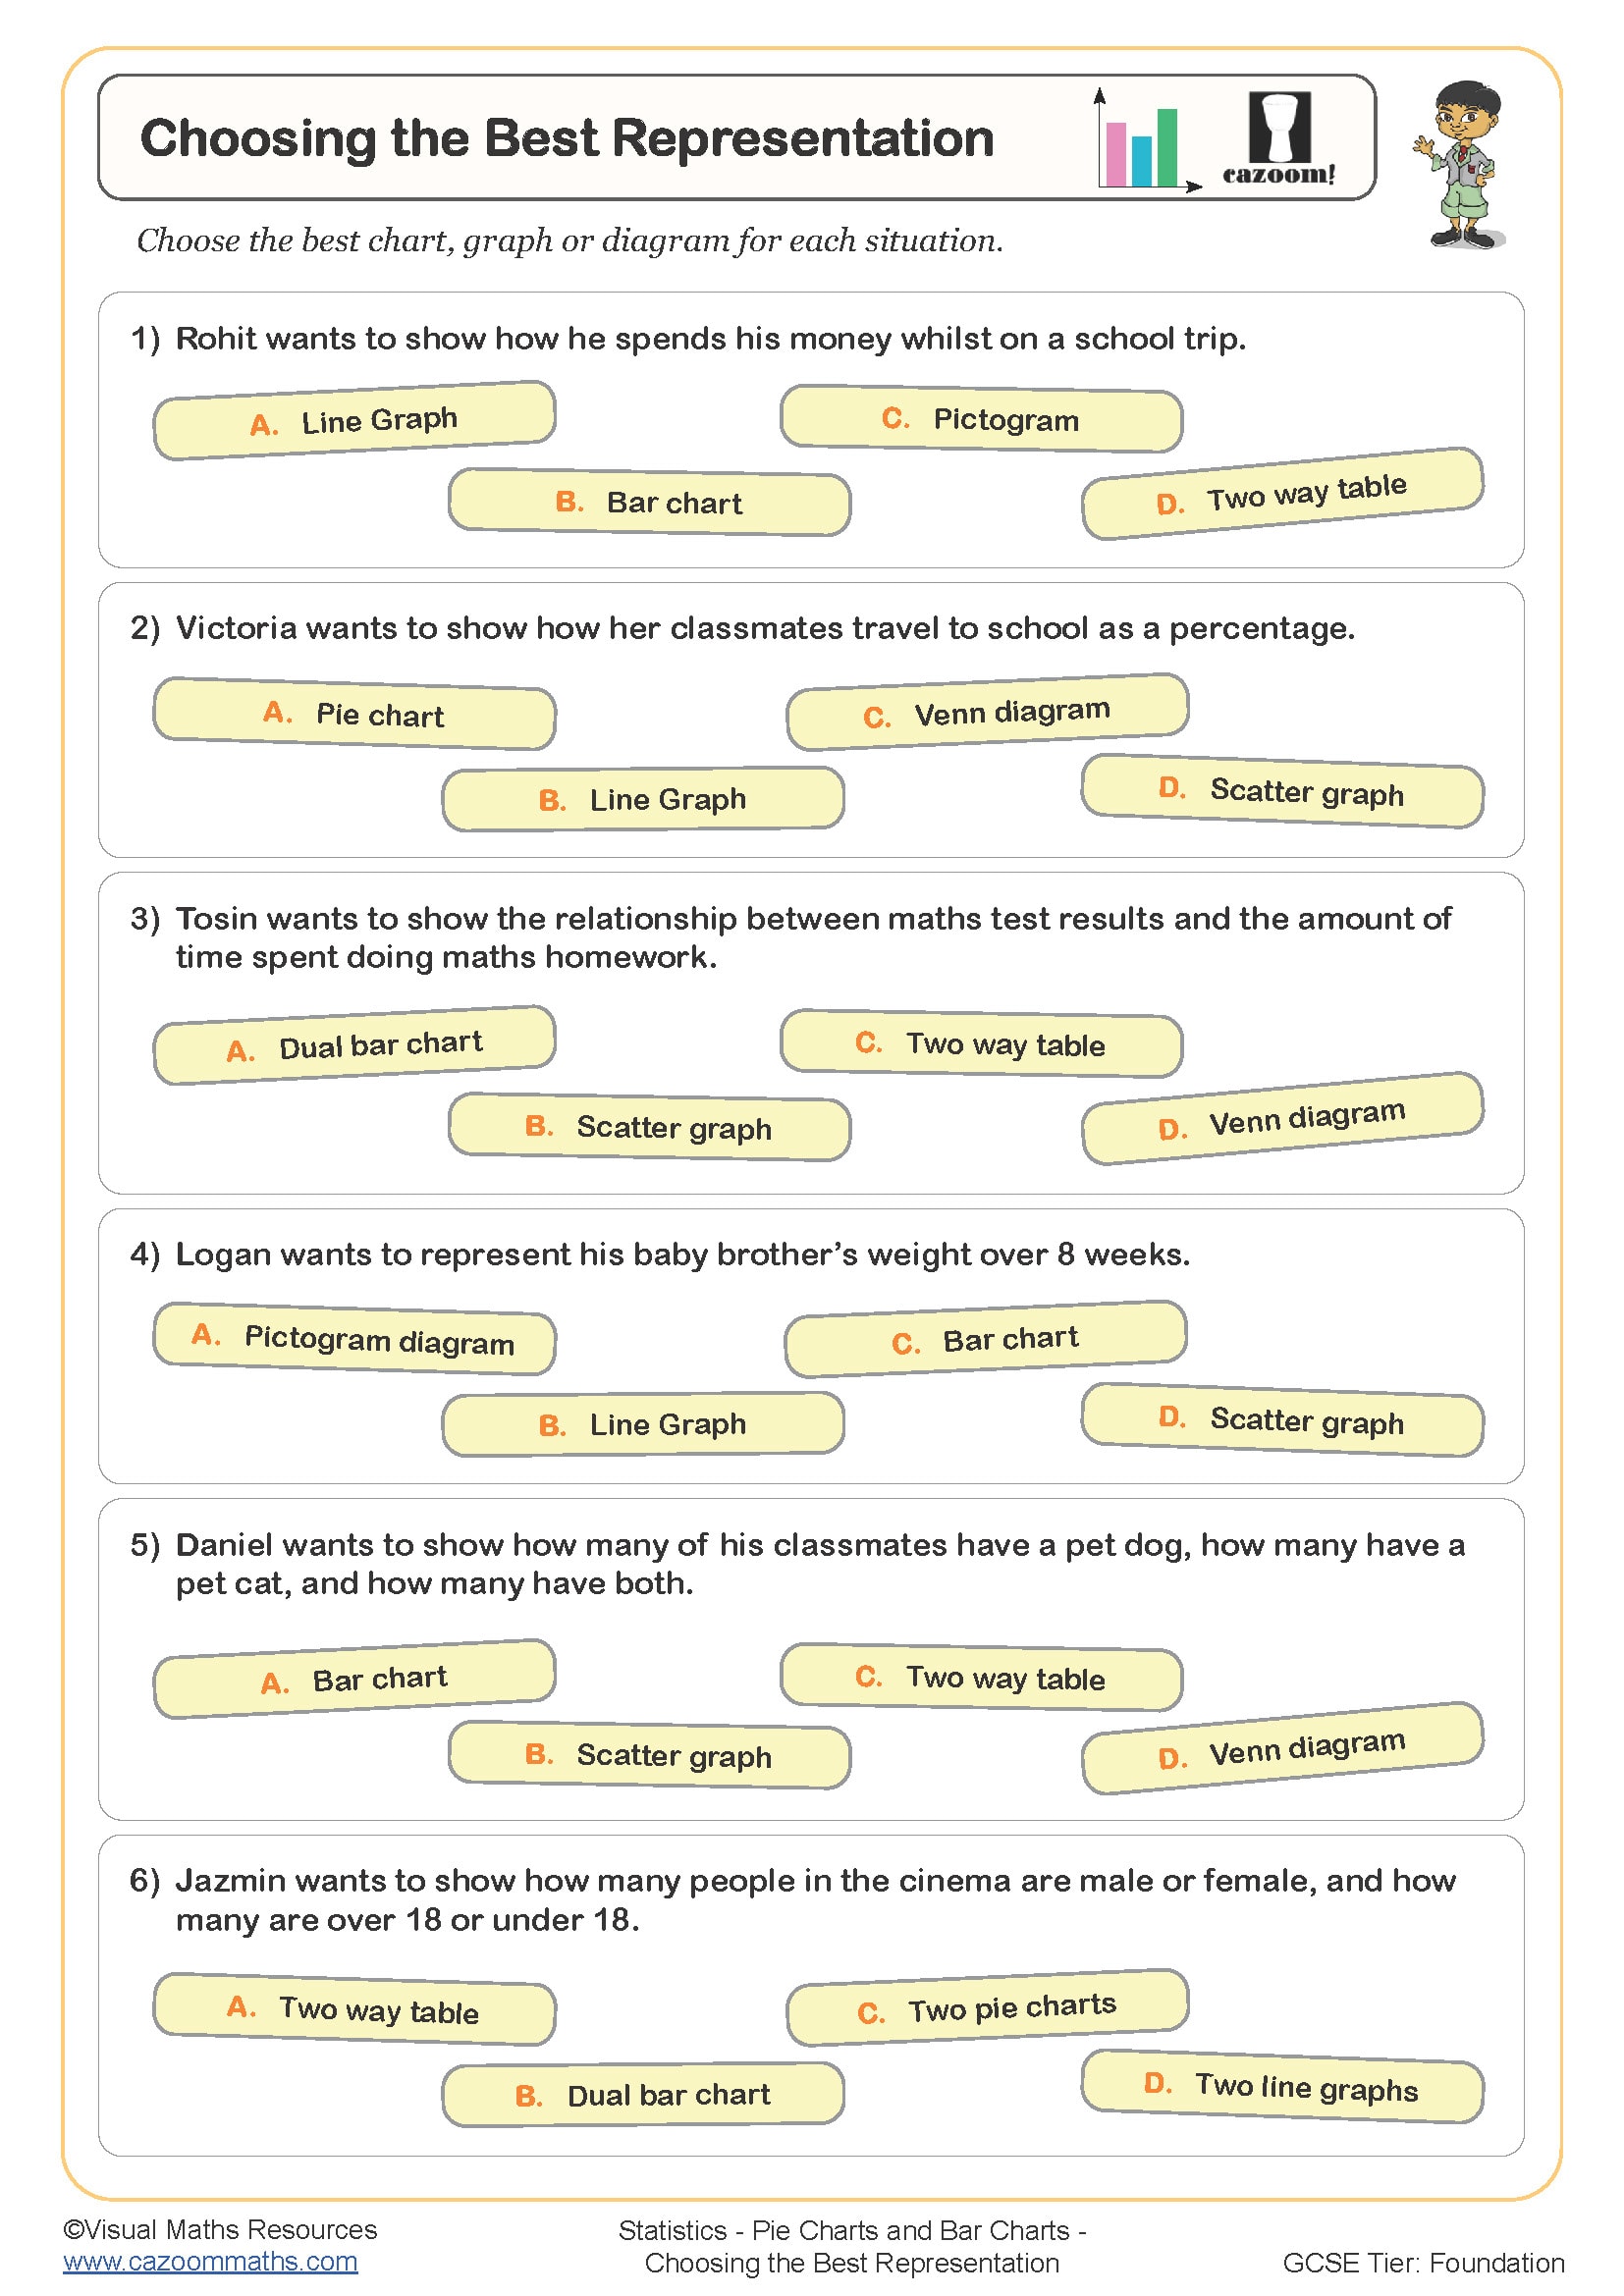
Choosing the Best Representation
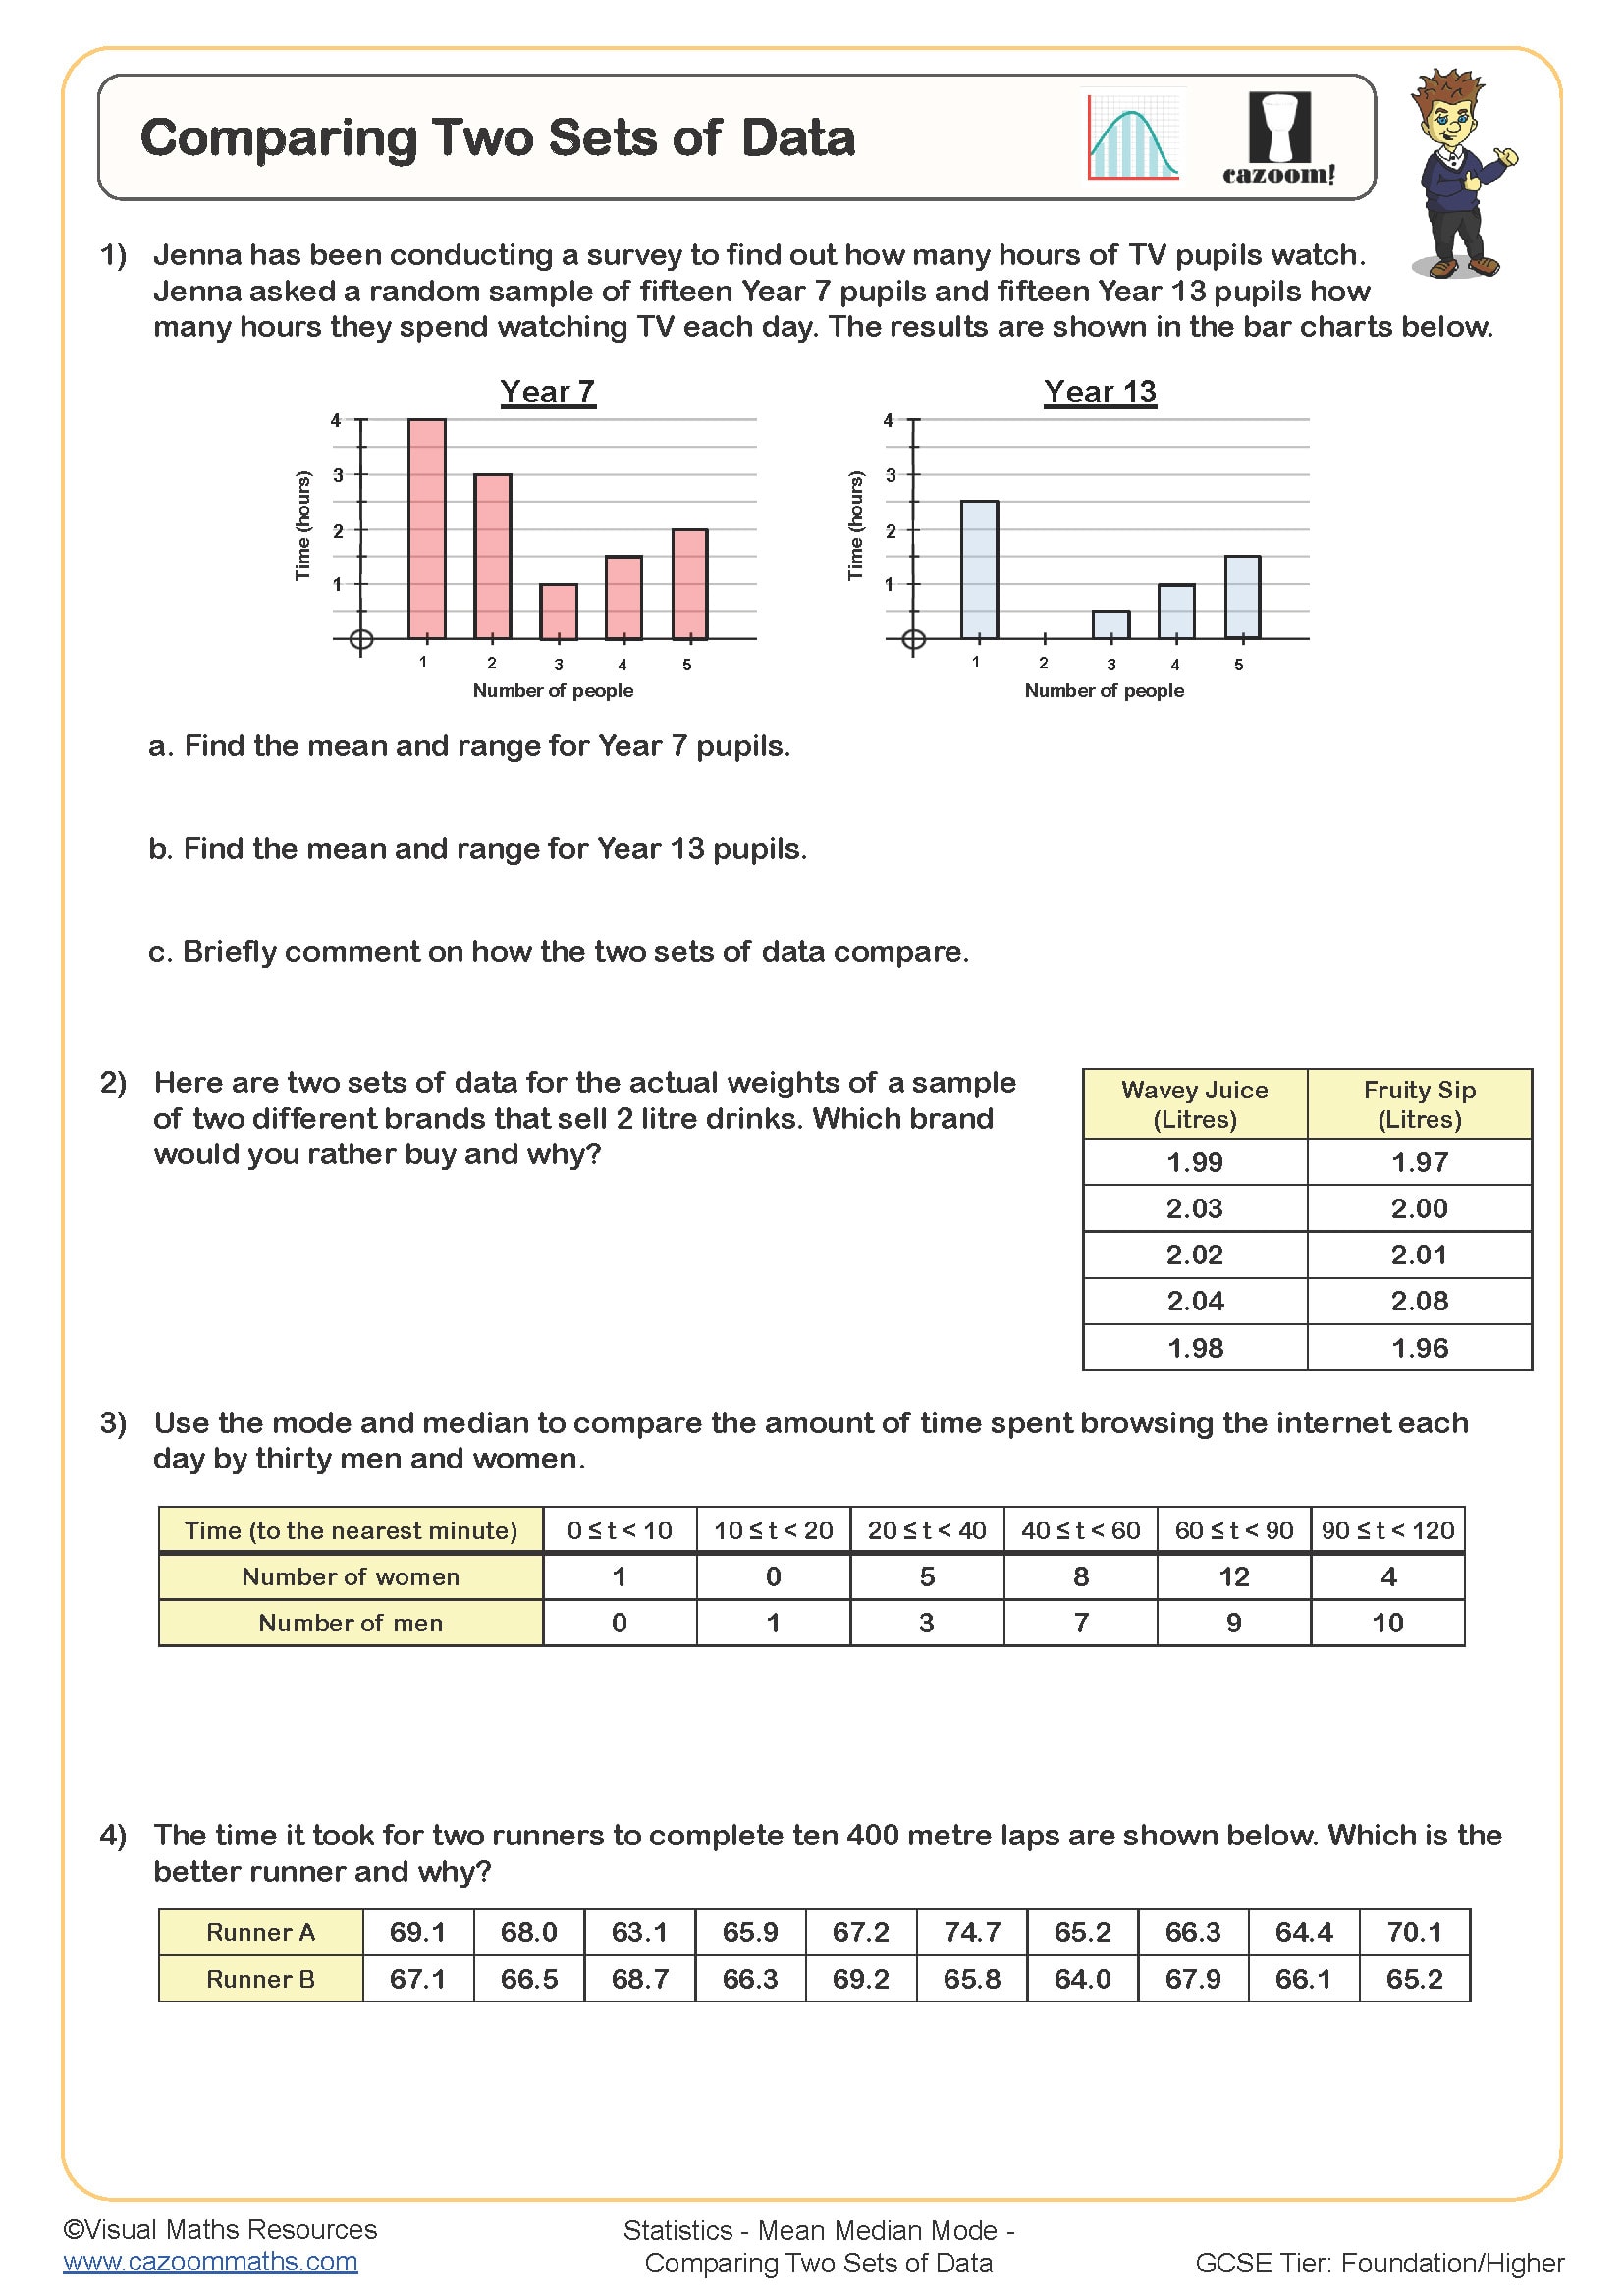
Comparing Two Sets of Data
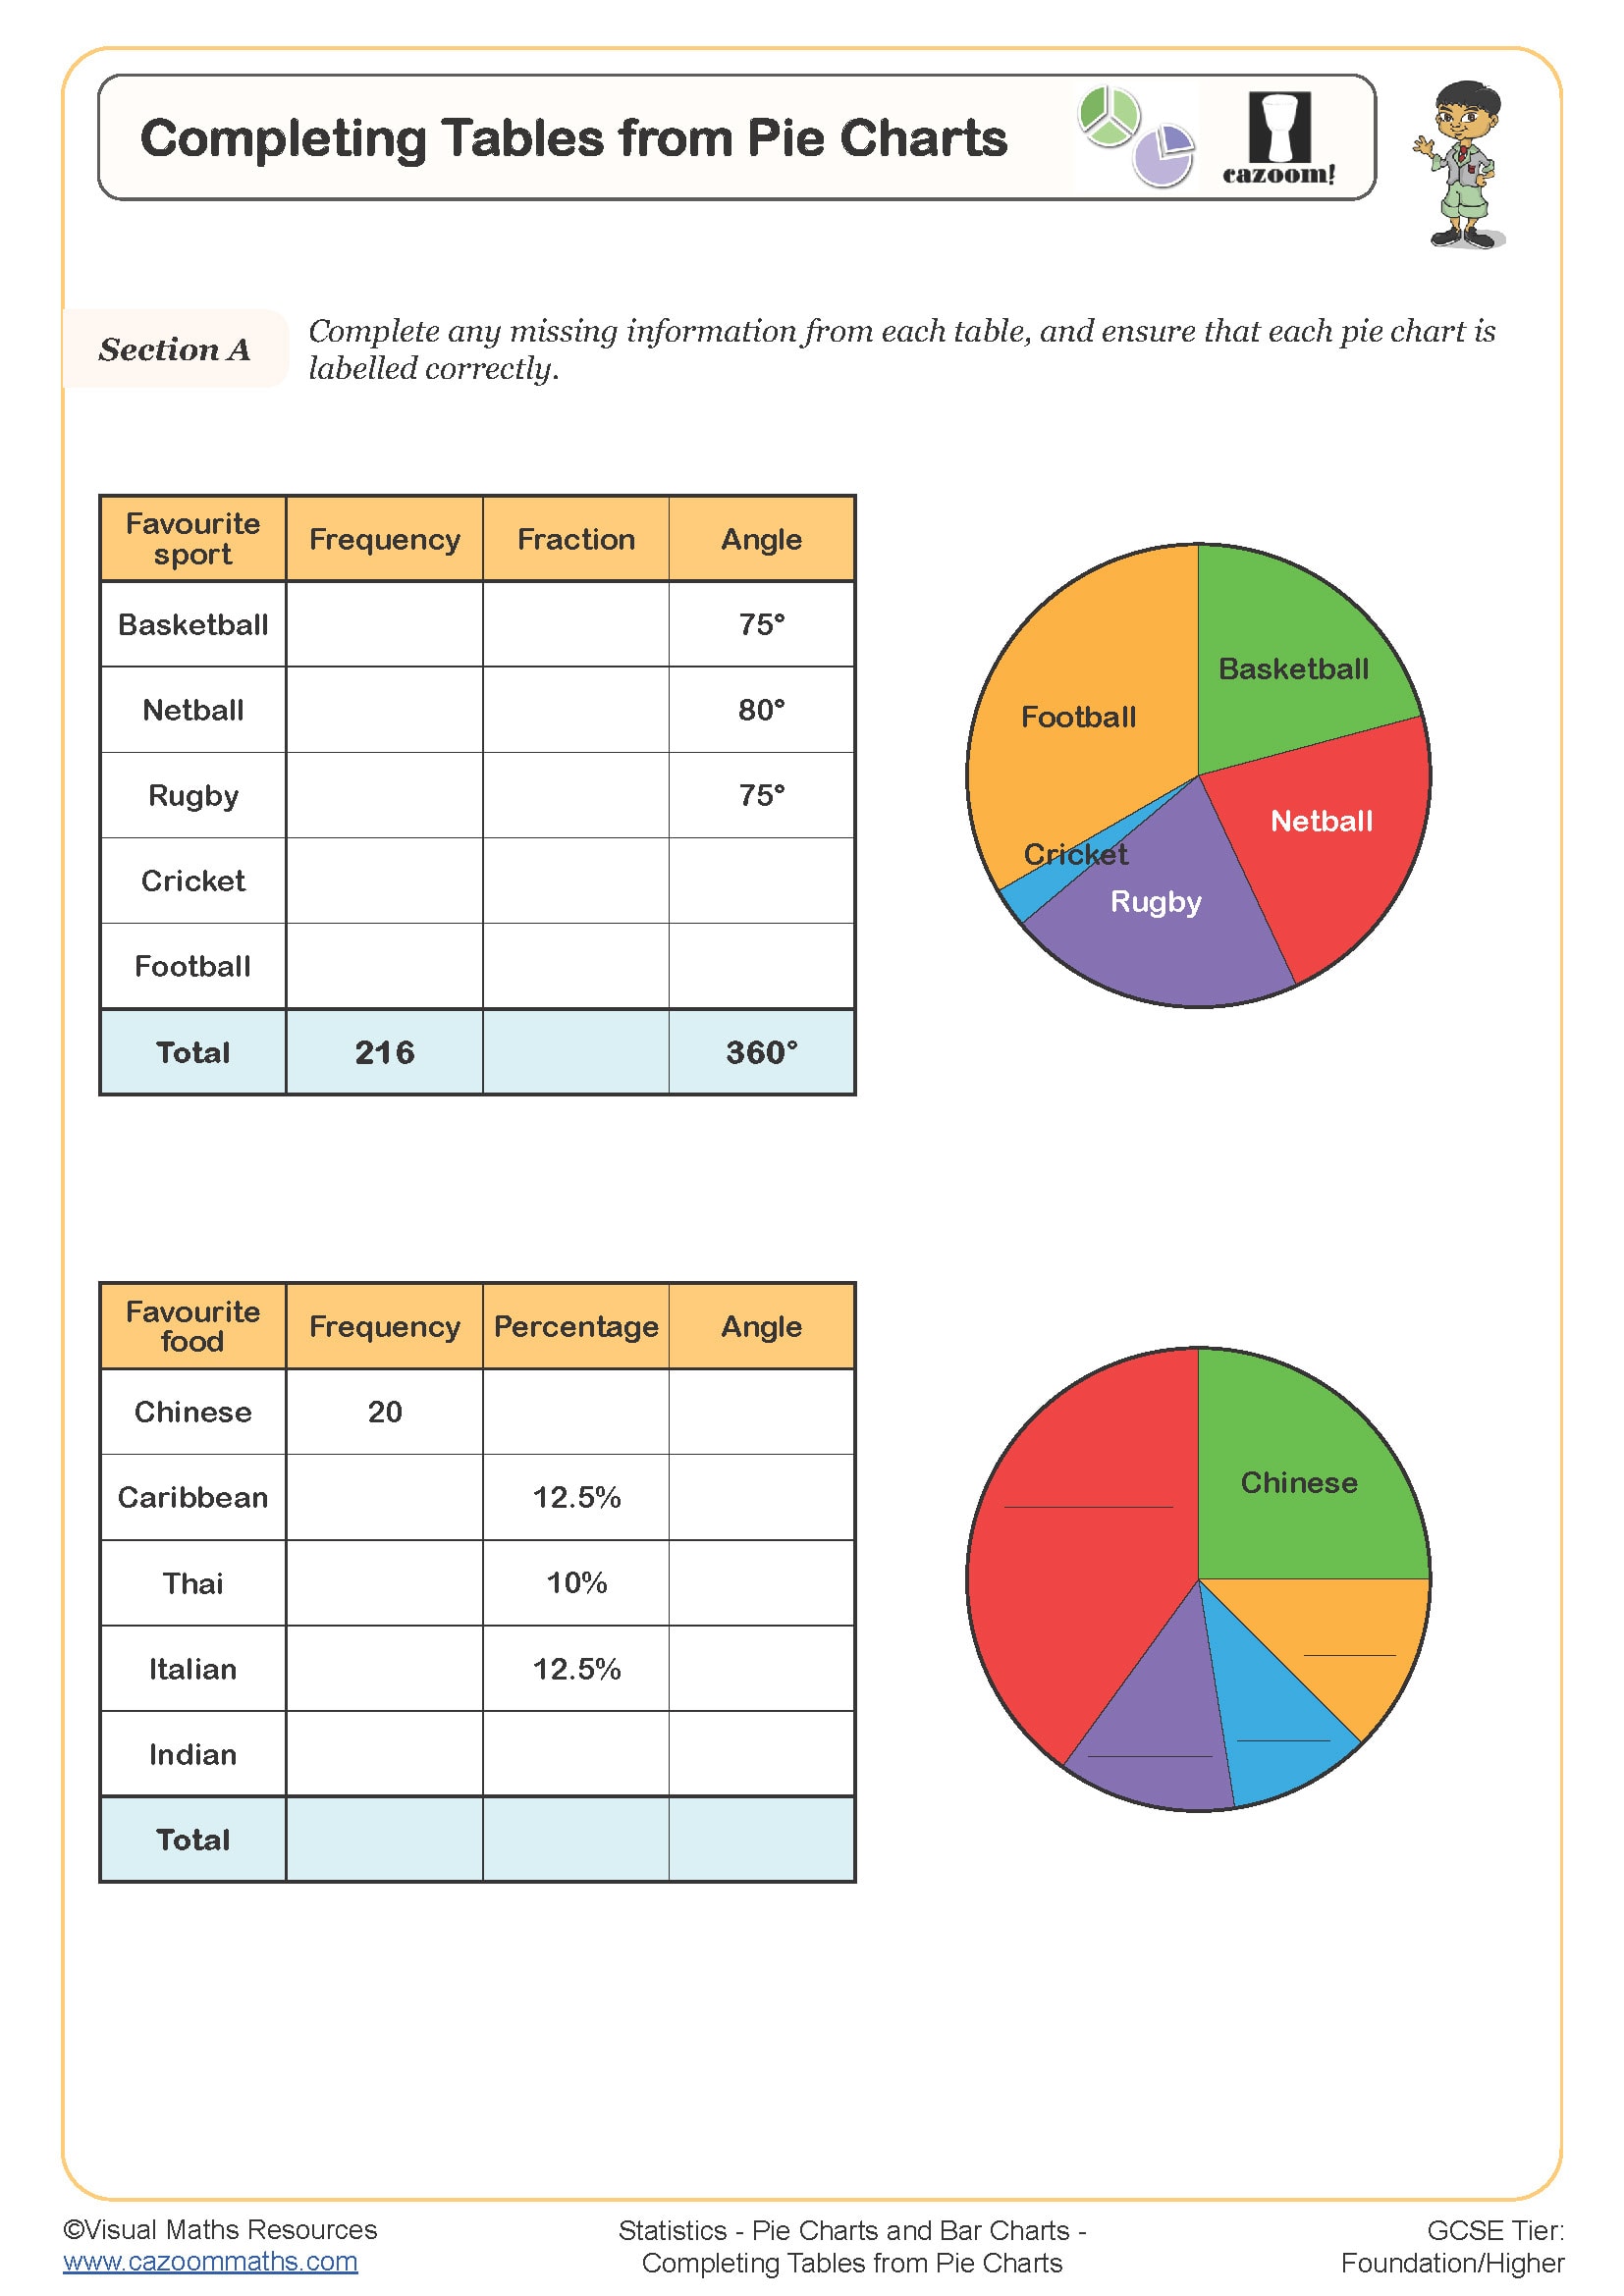
Completing Tables from Pie Charts
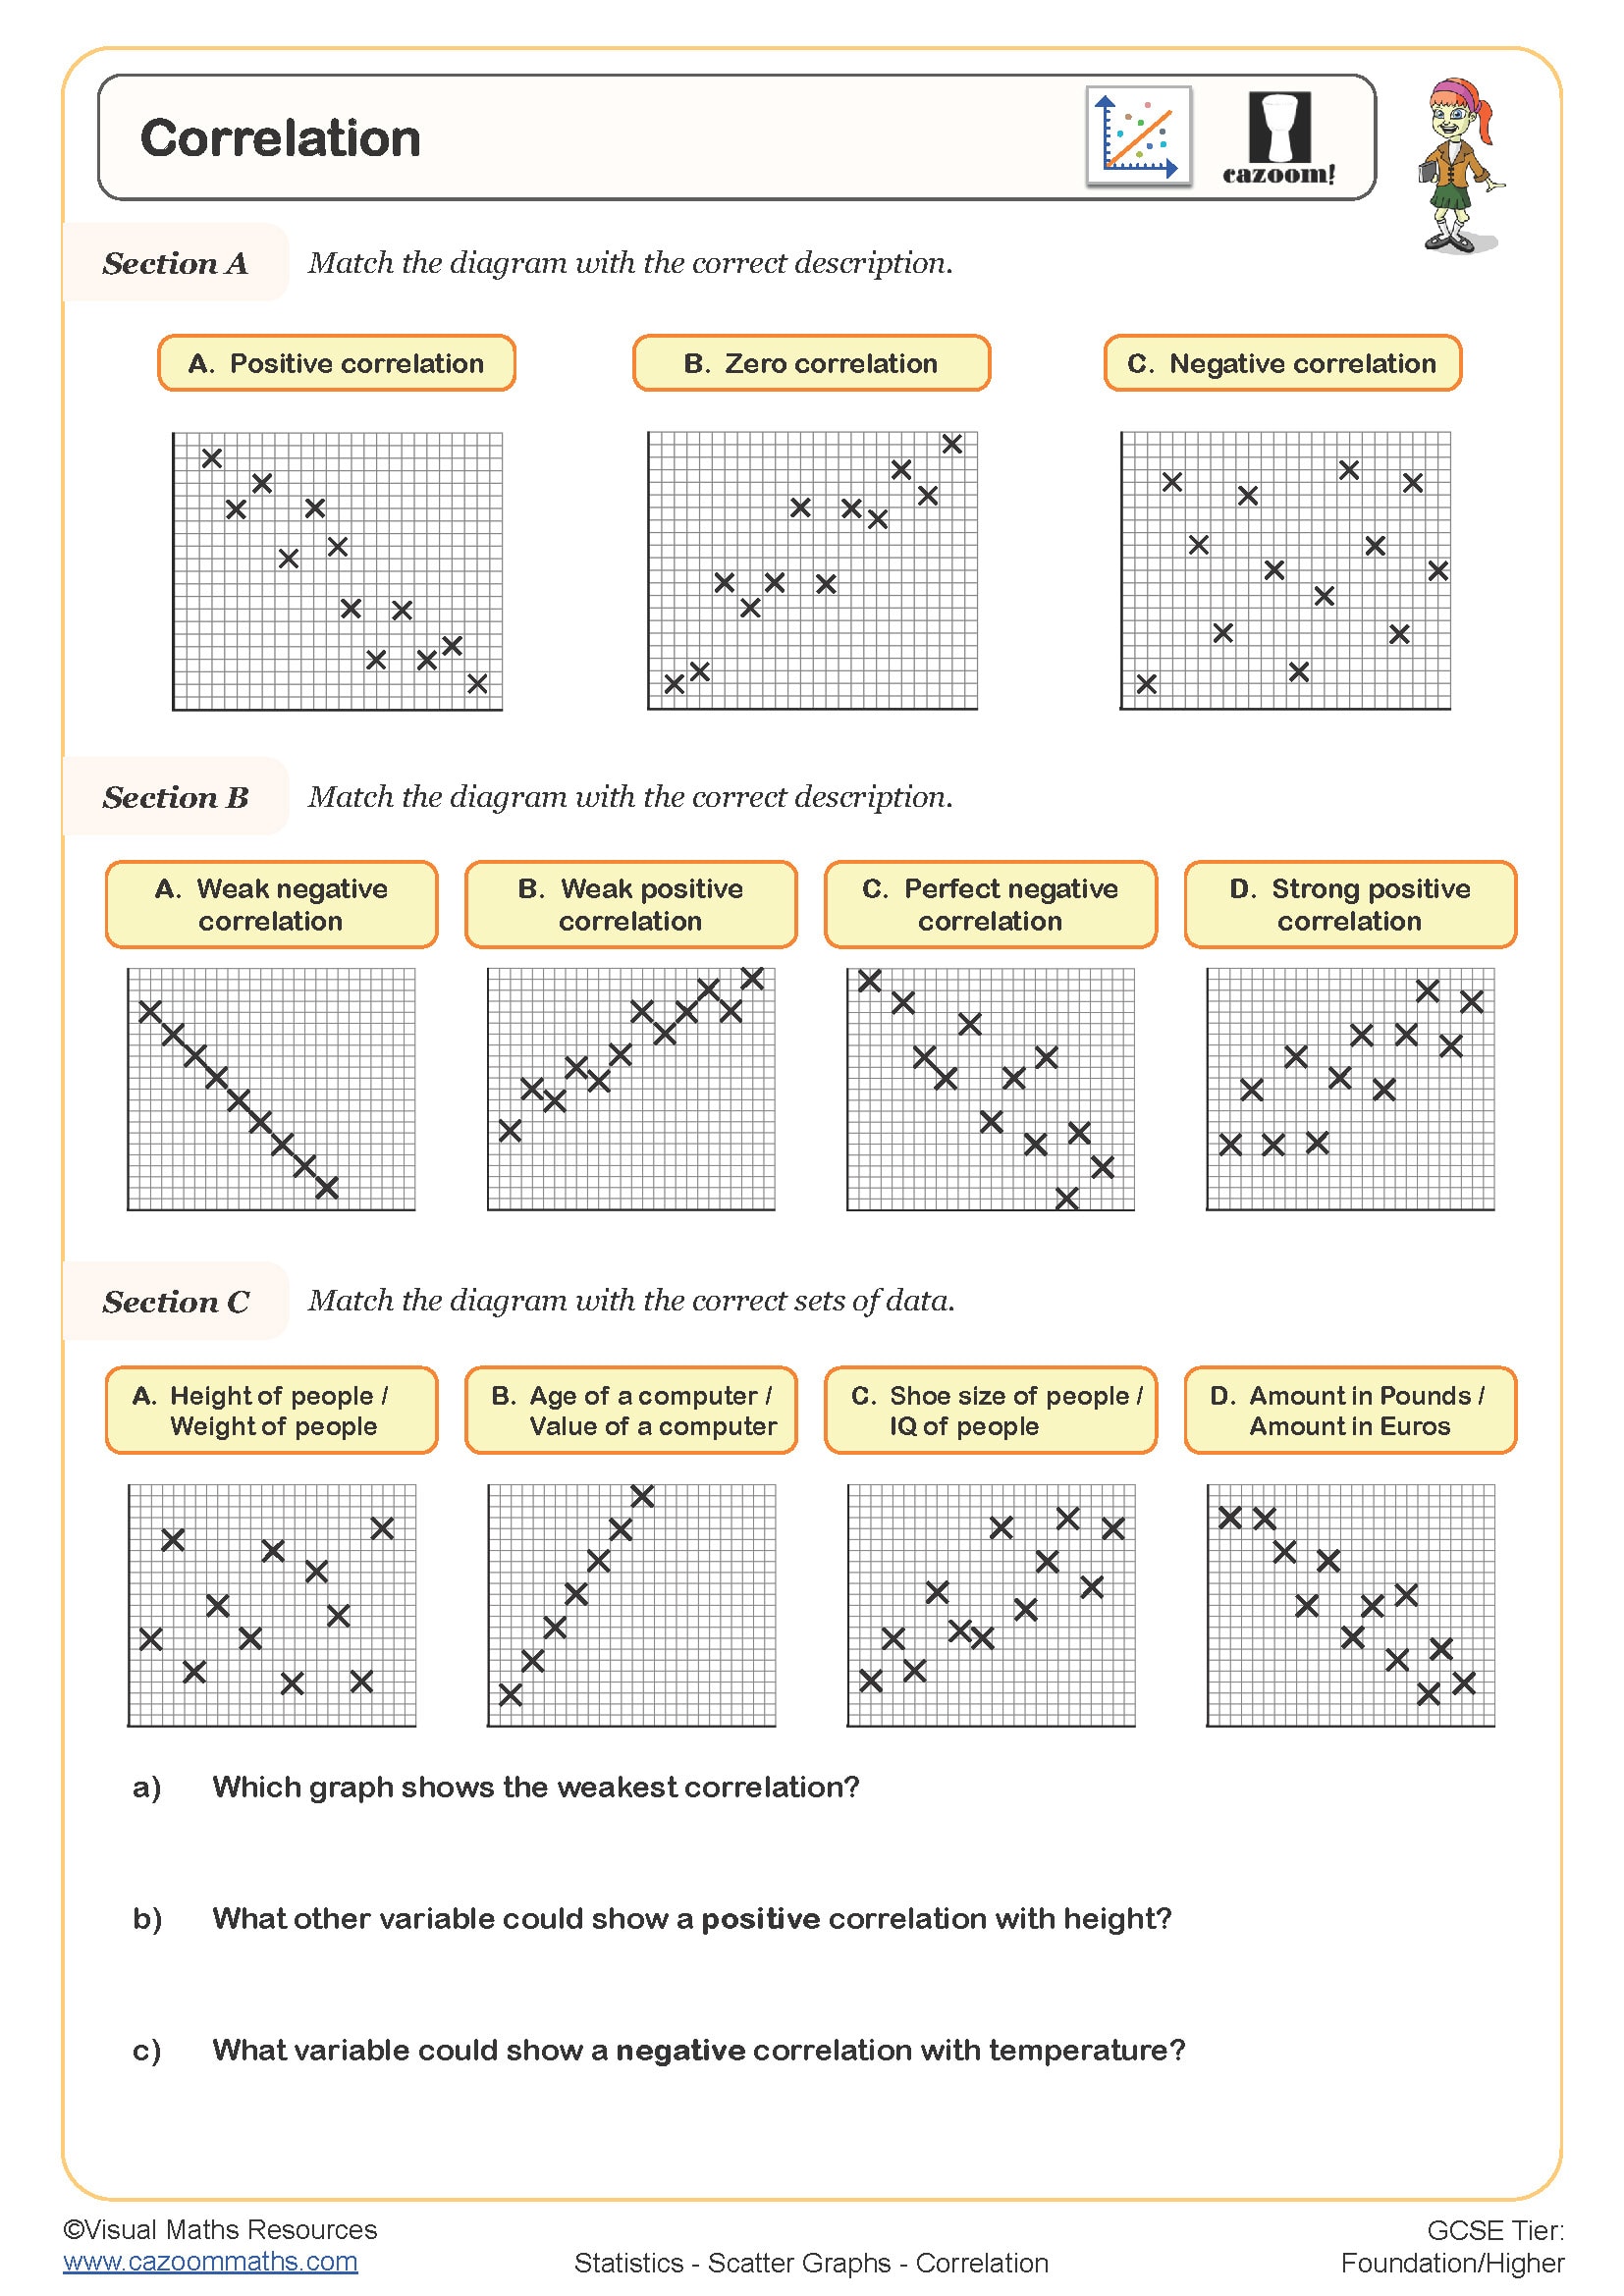
Correlation
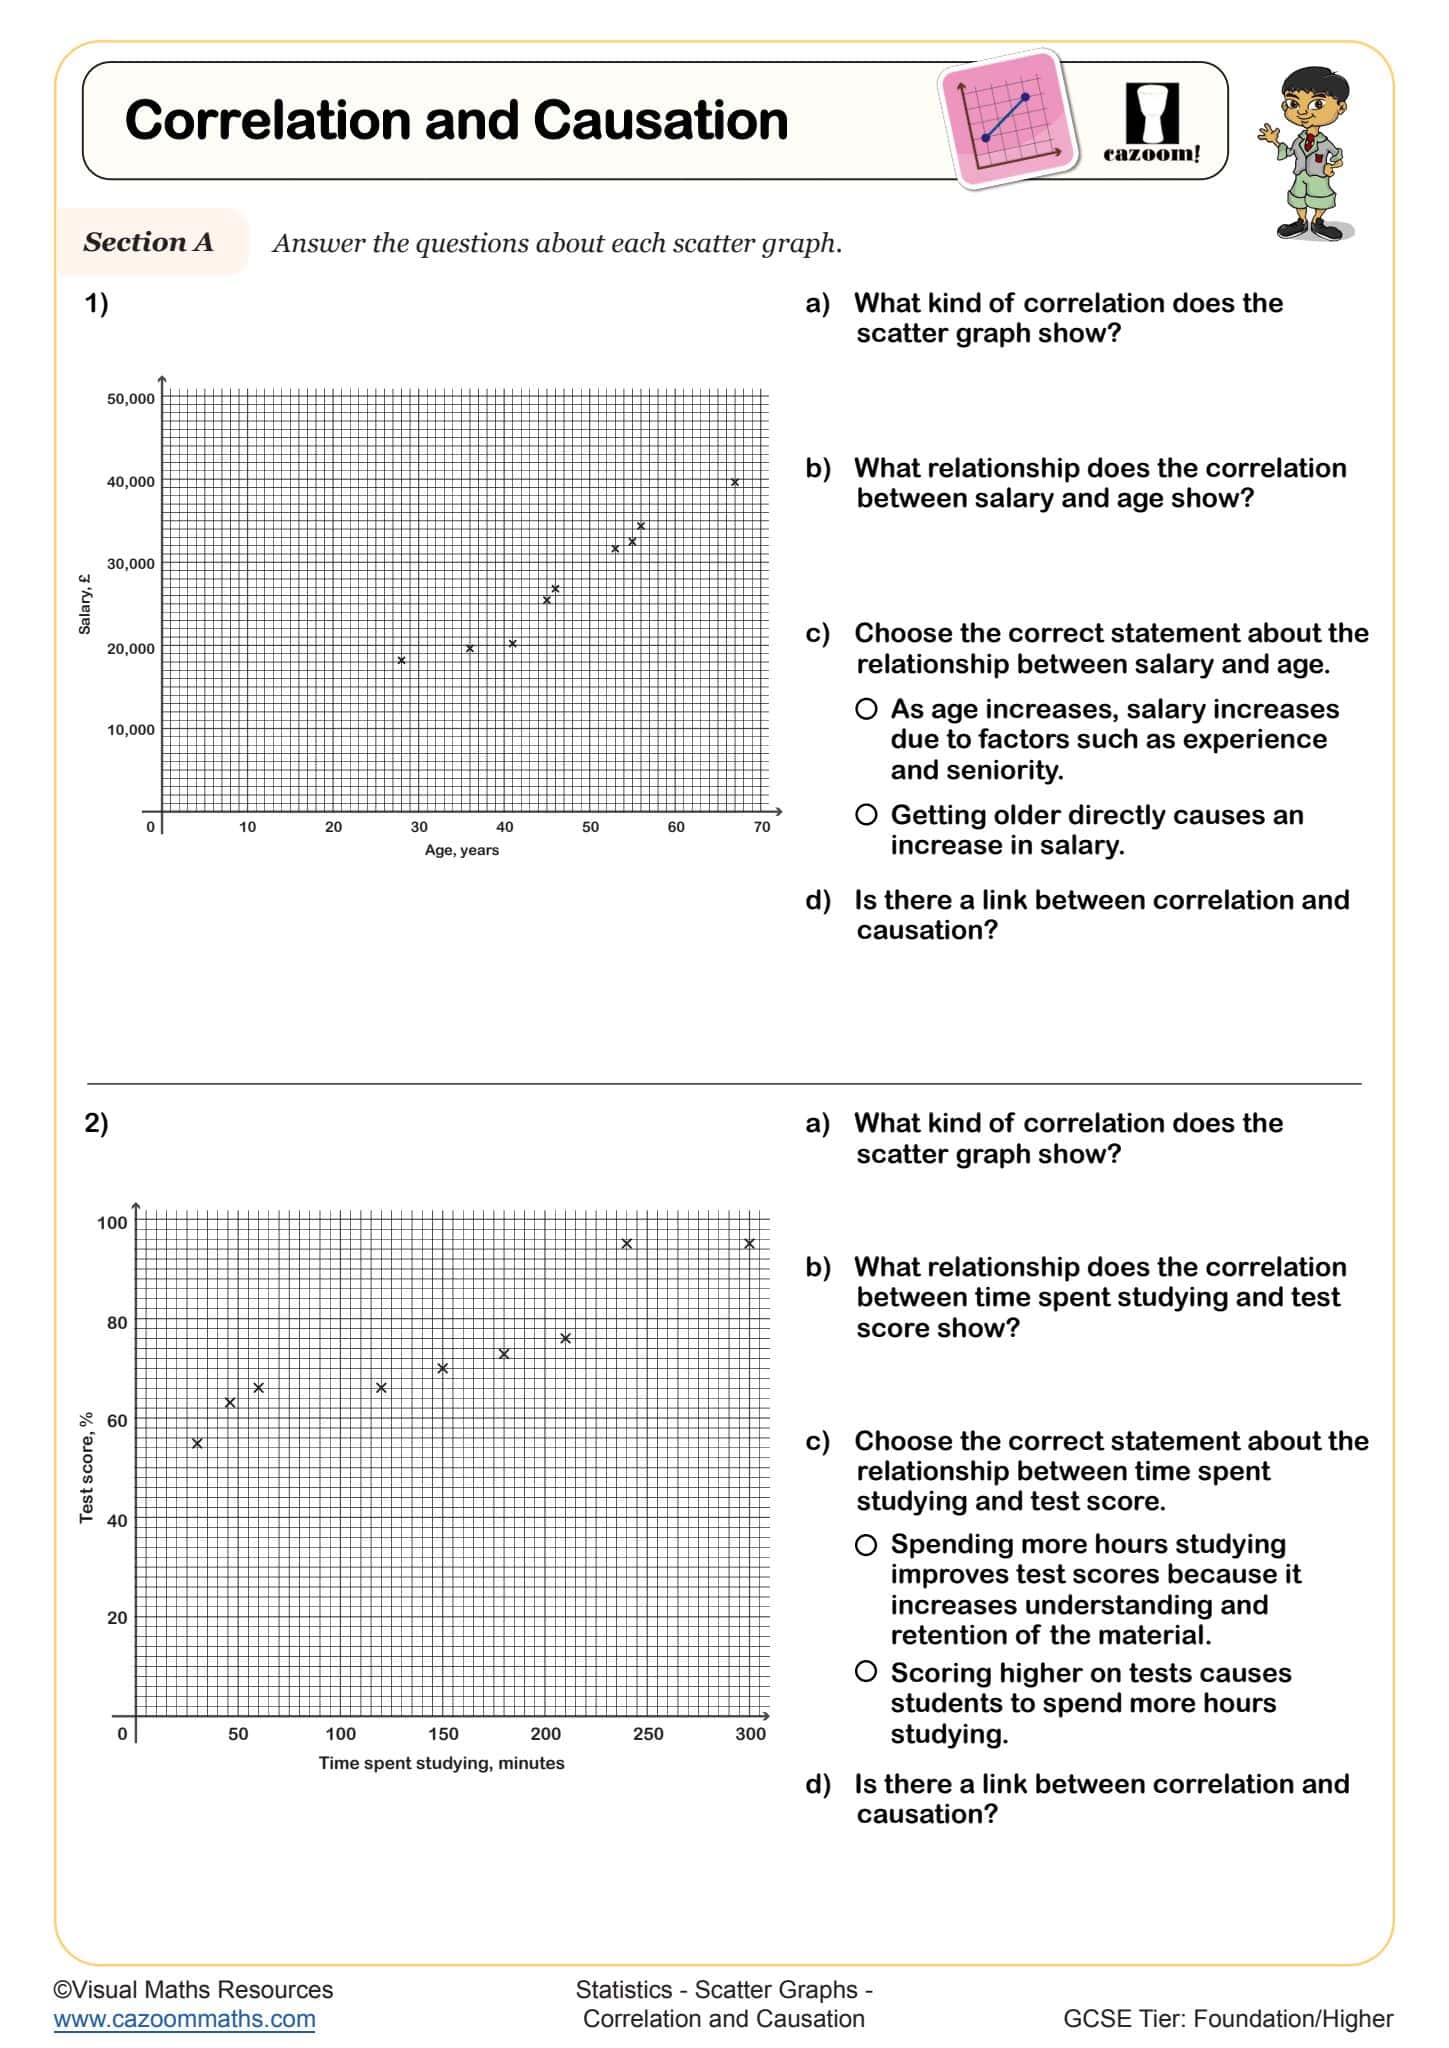
Correlation and Causation
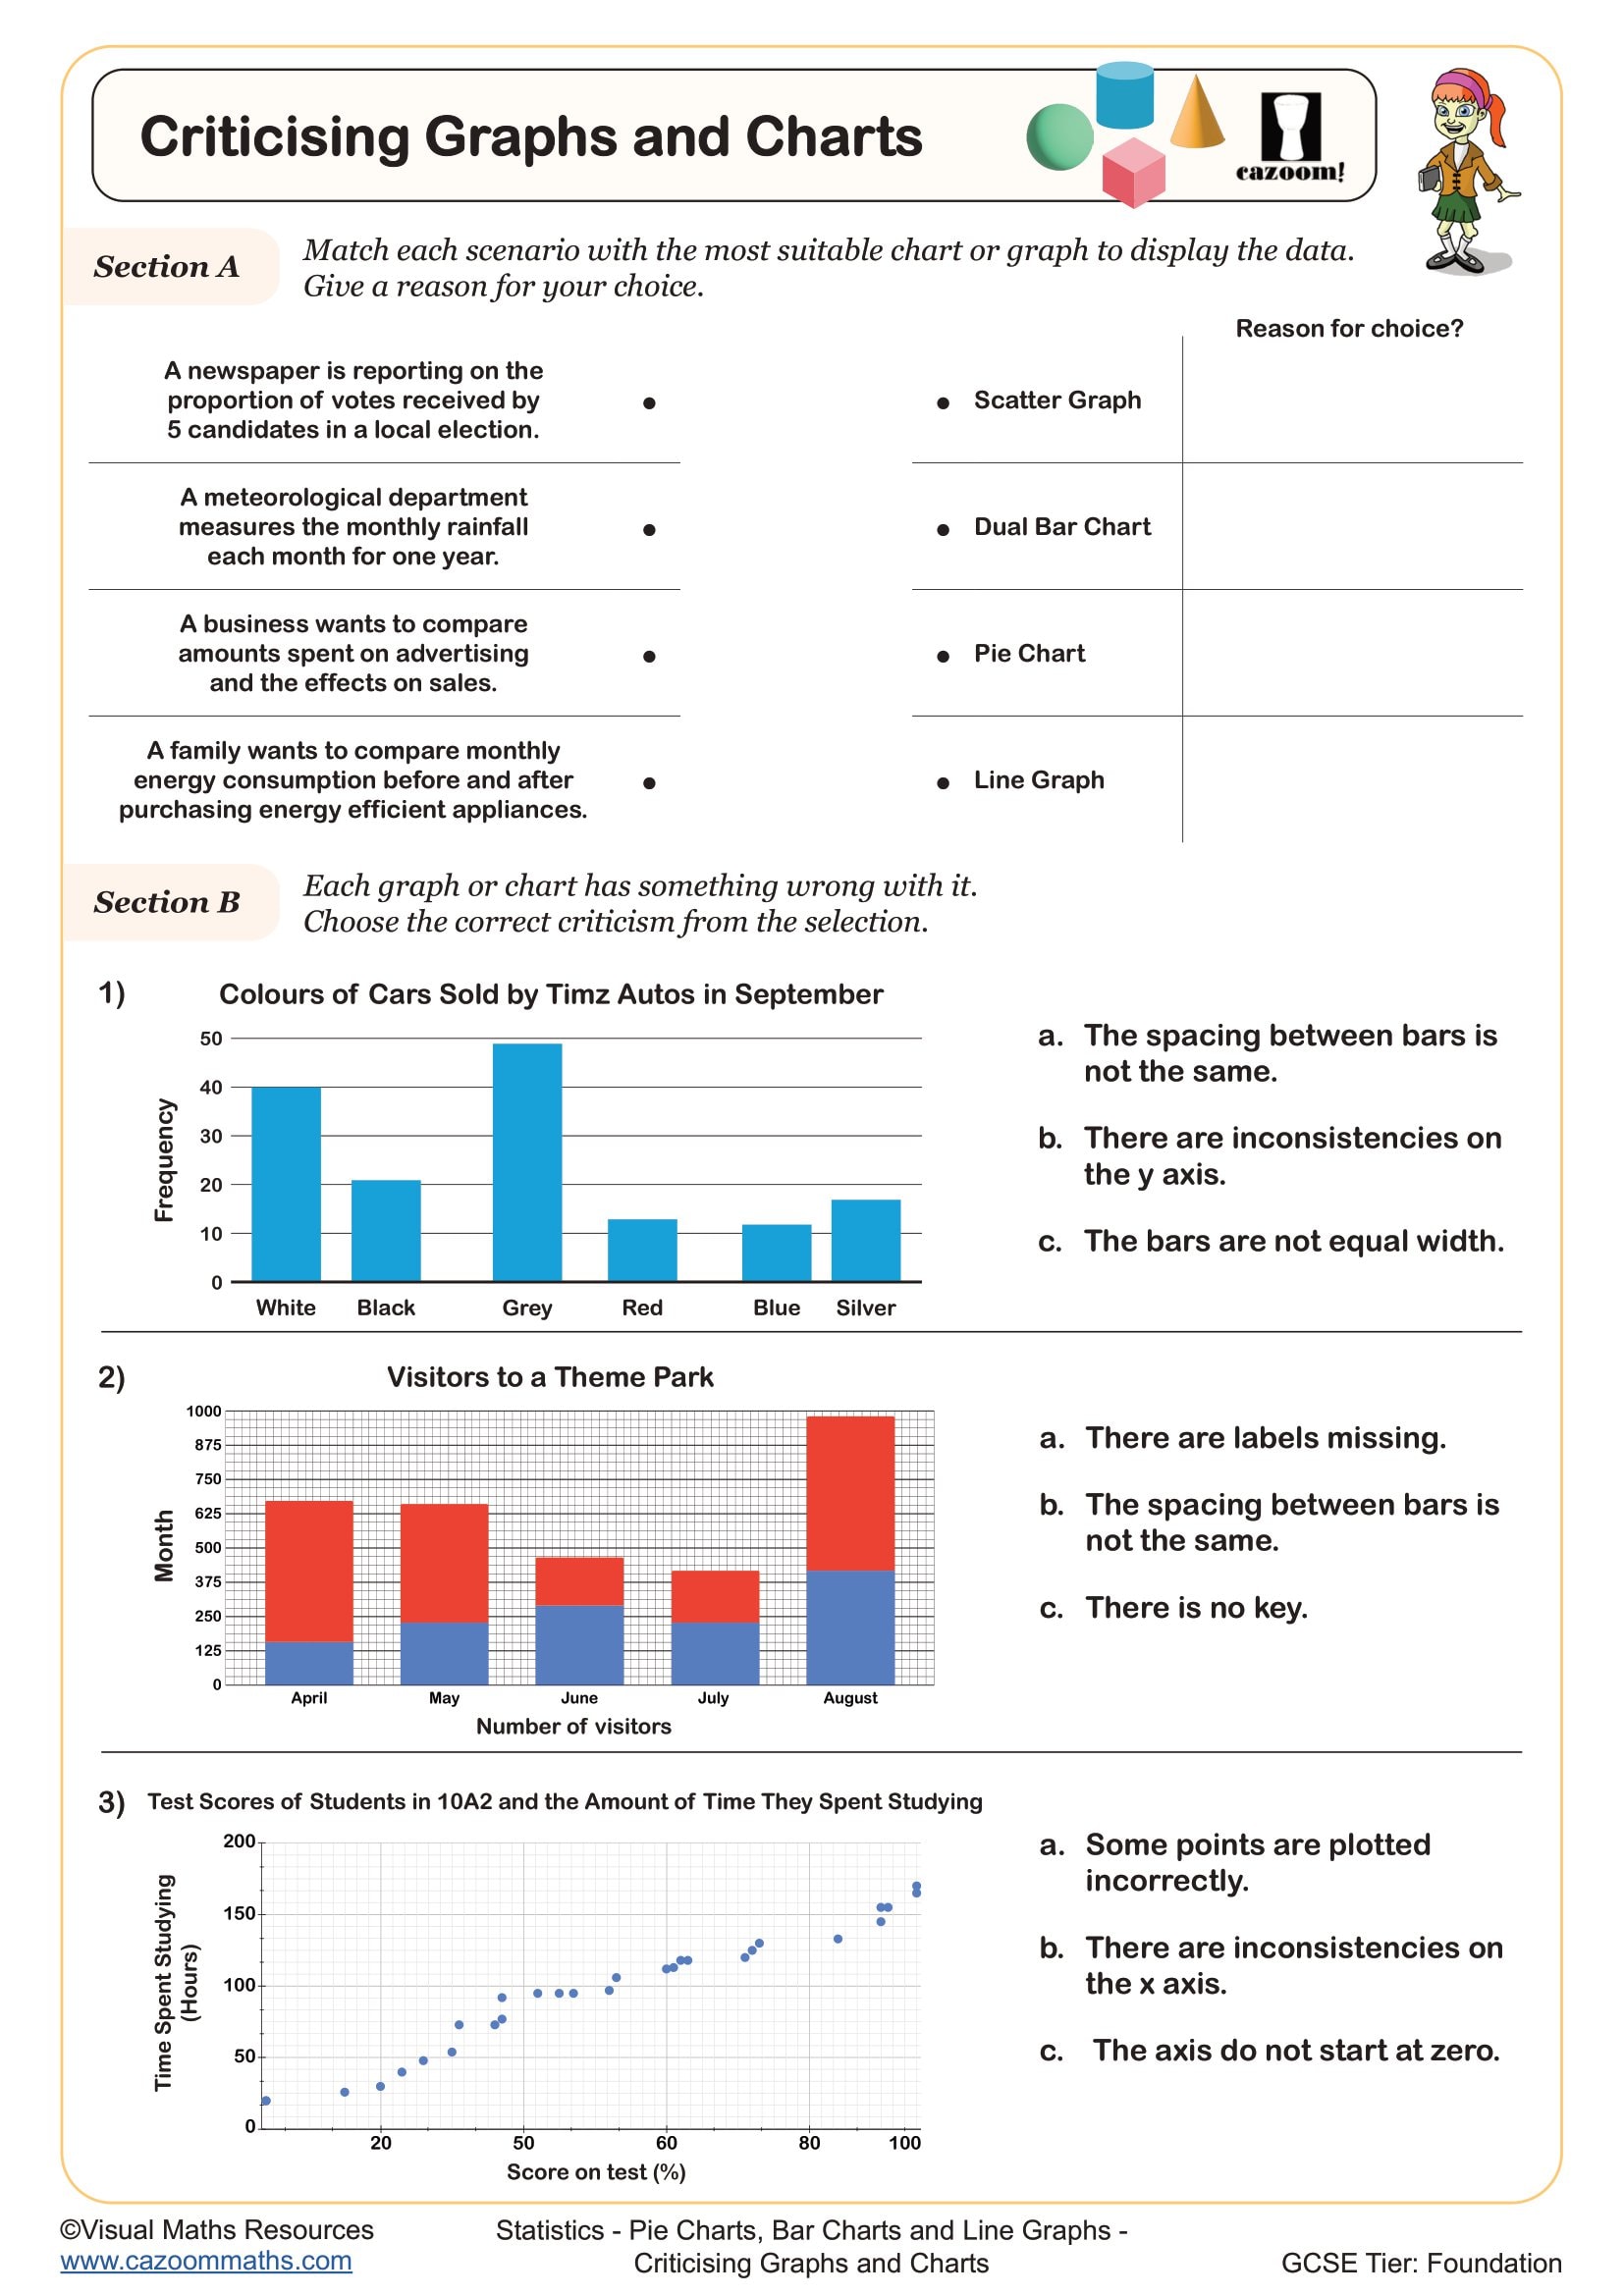
Criticising Graphs and Charts
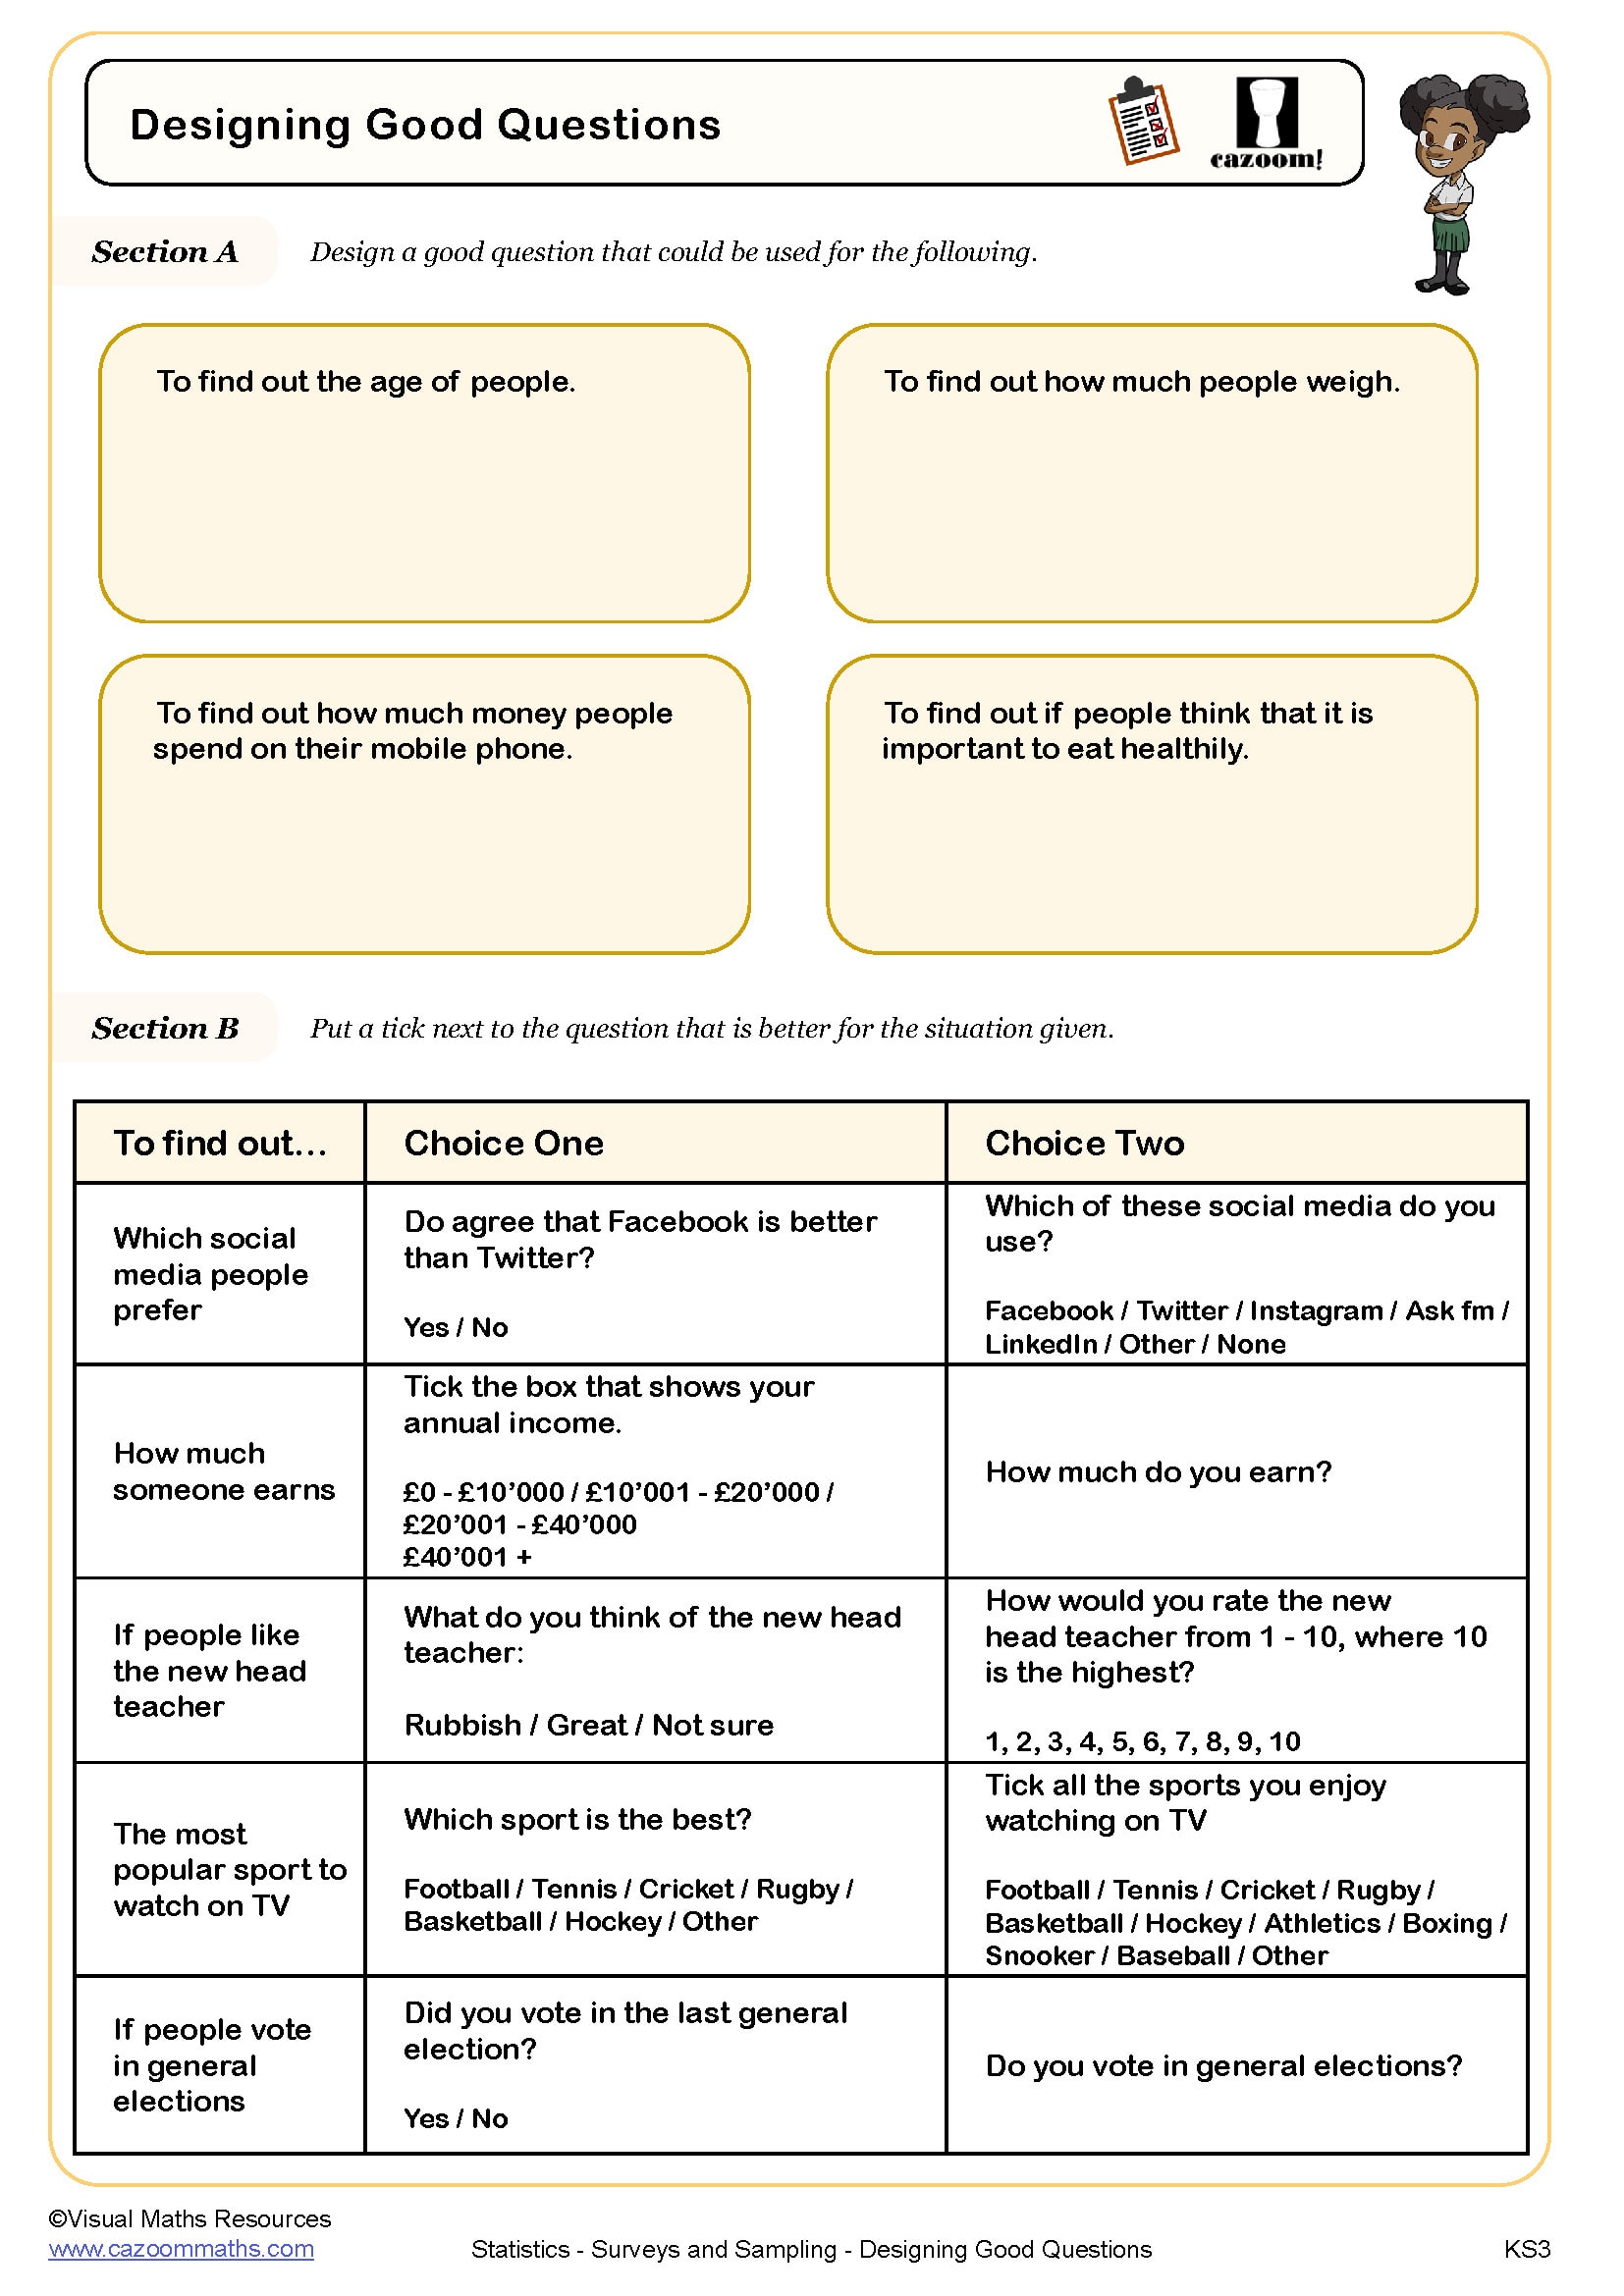
Designing Good Questions
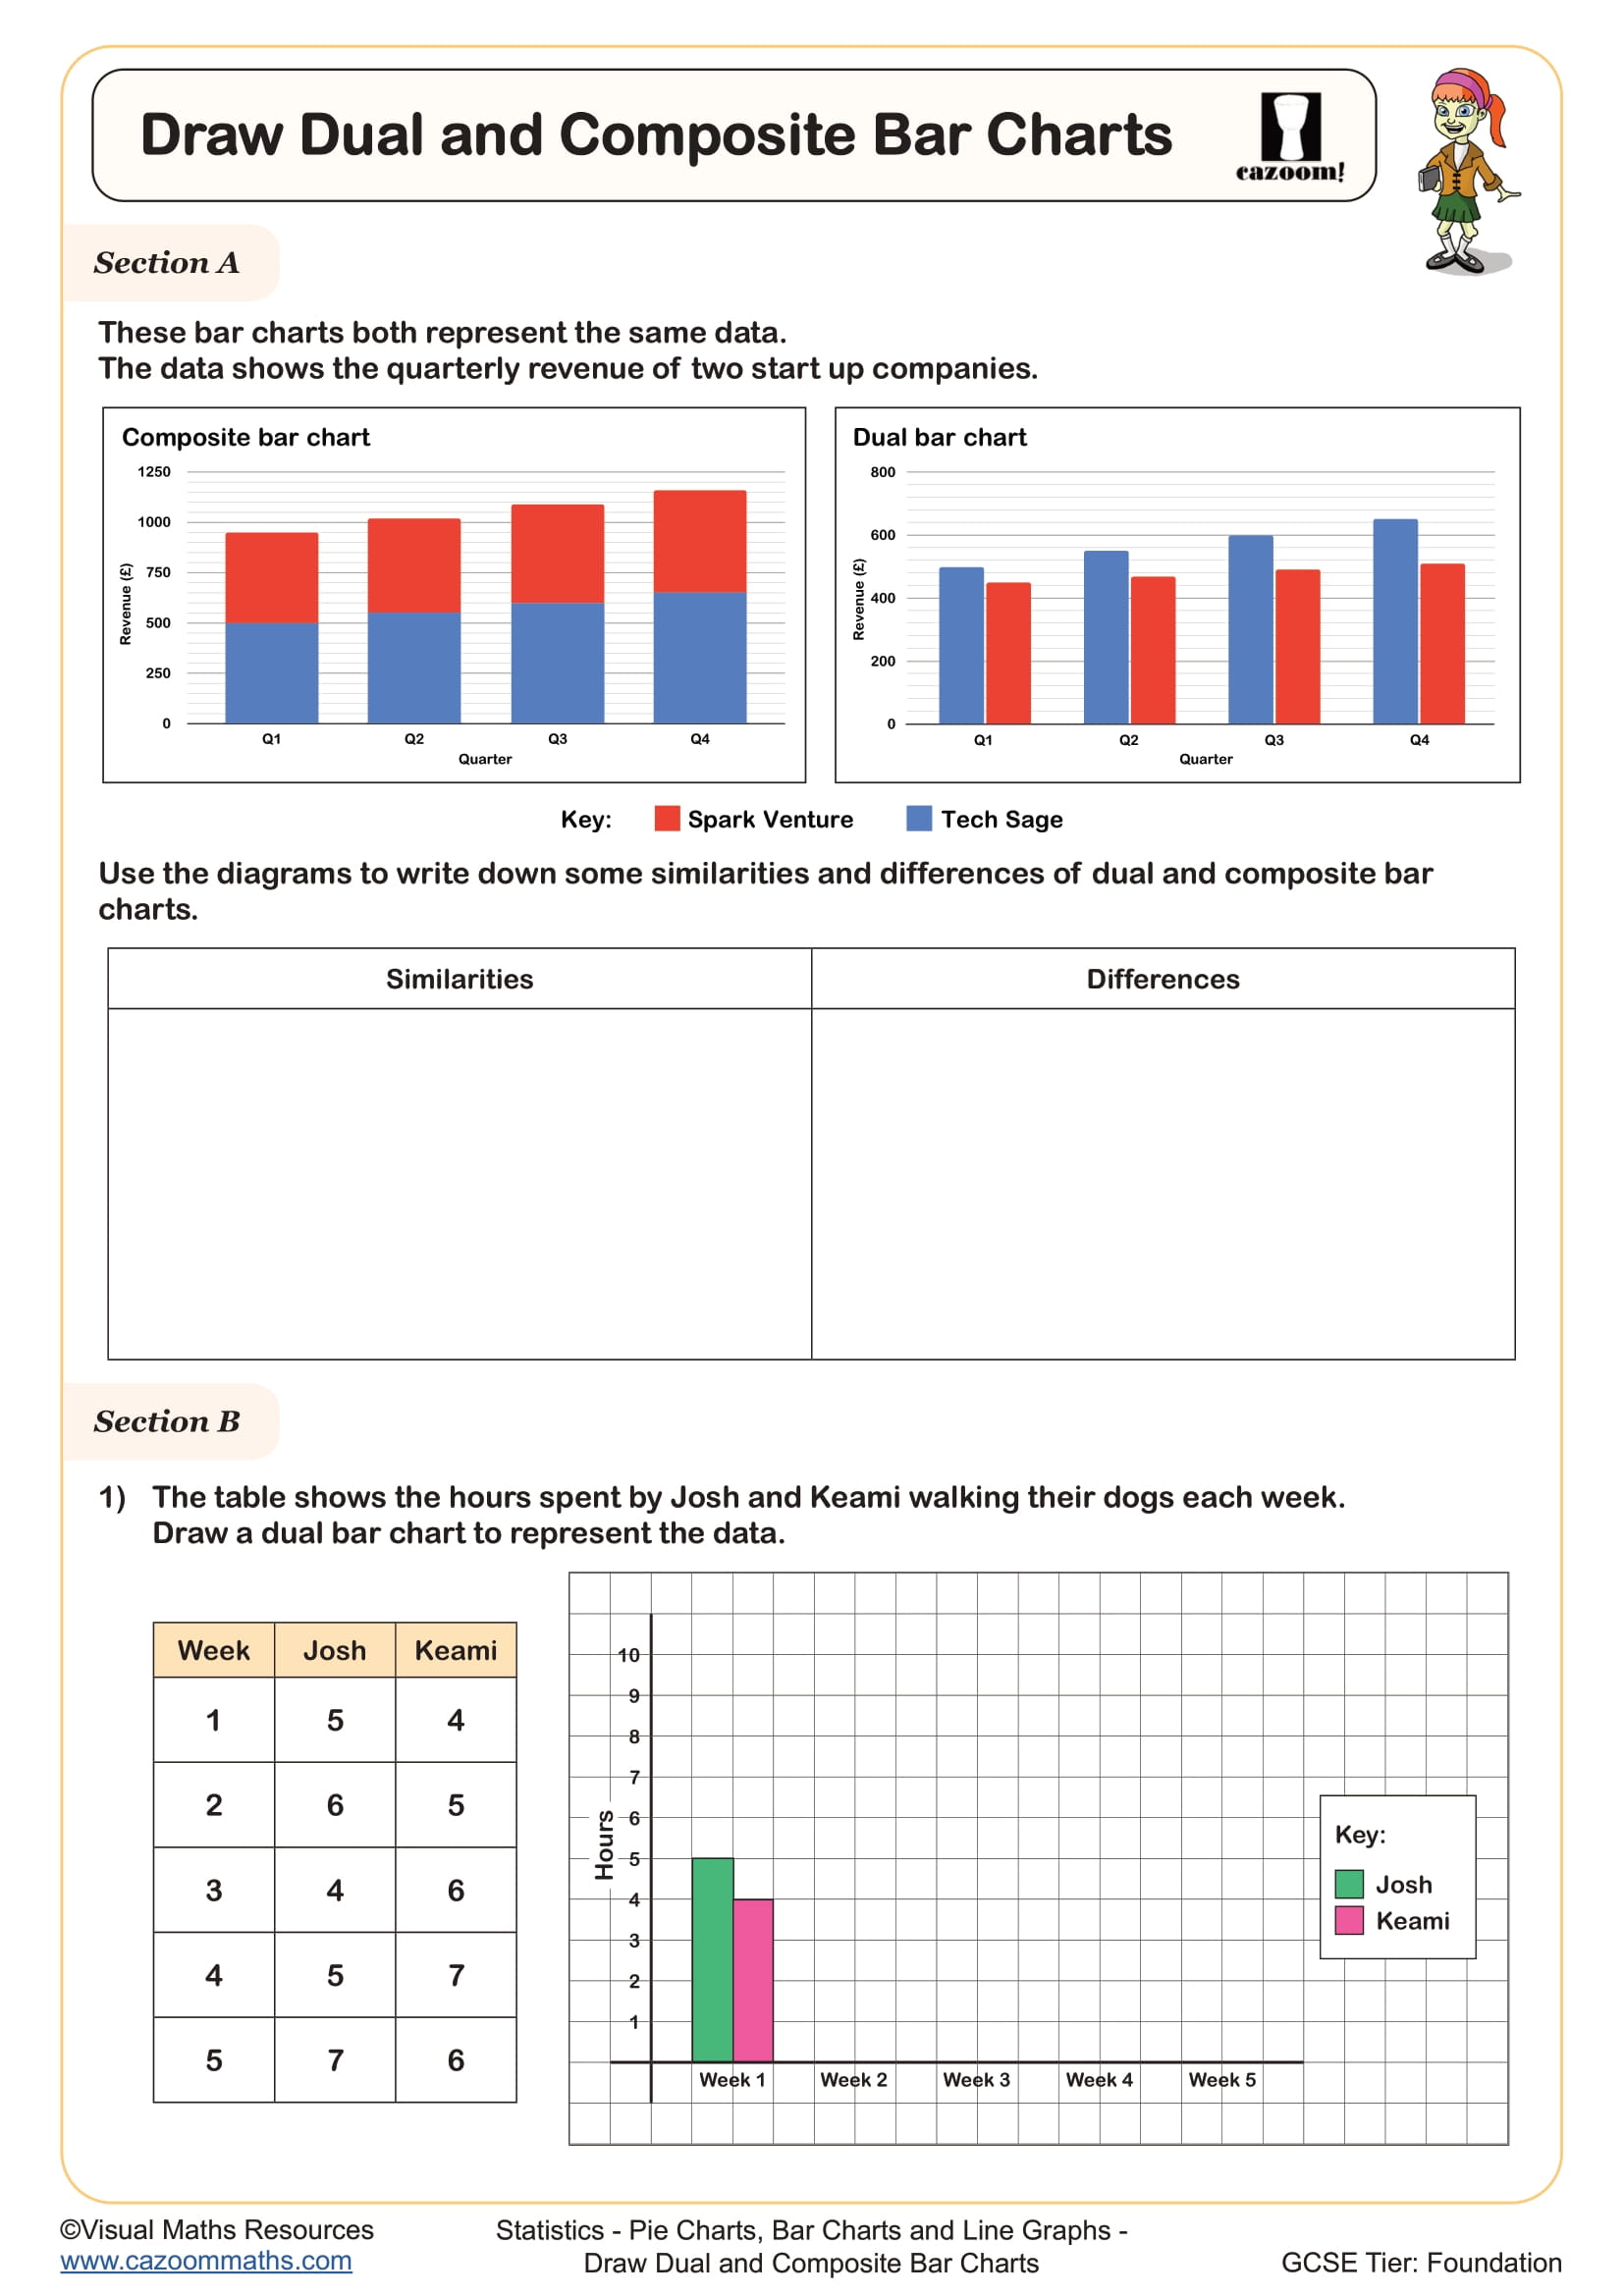
Draw Composite and Dual Bar Charts
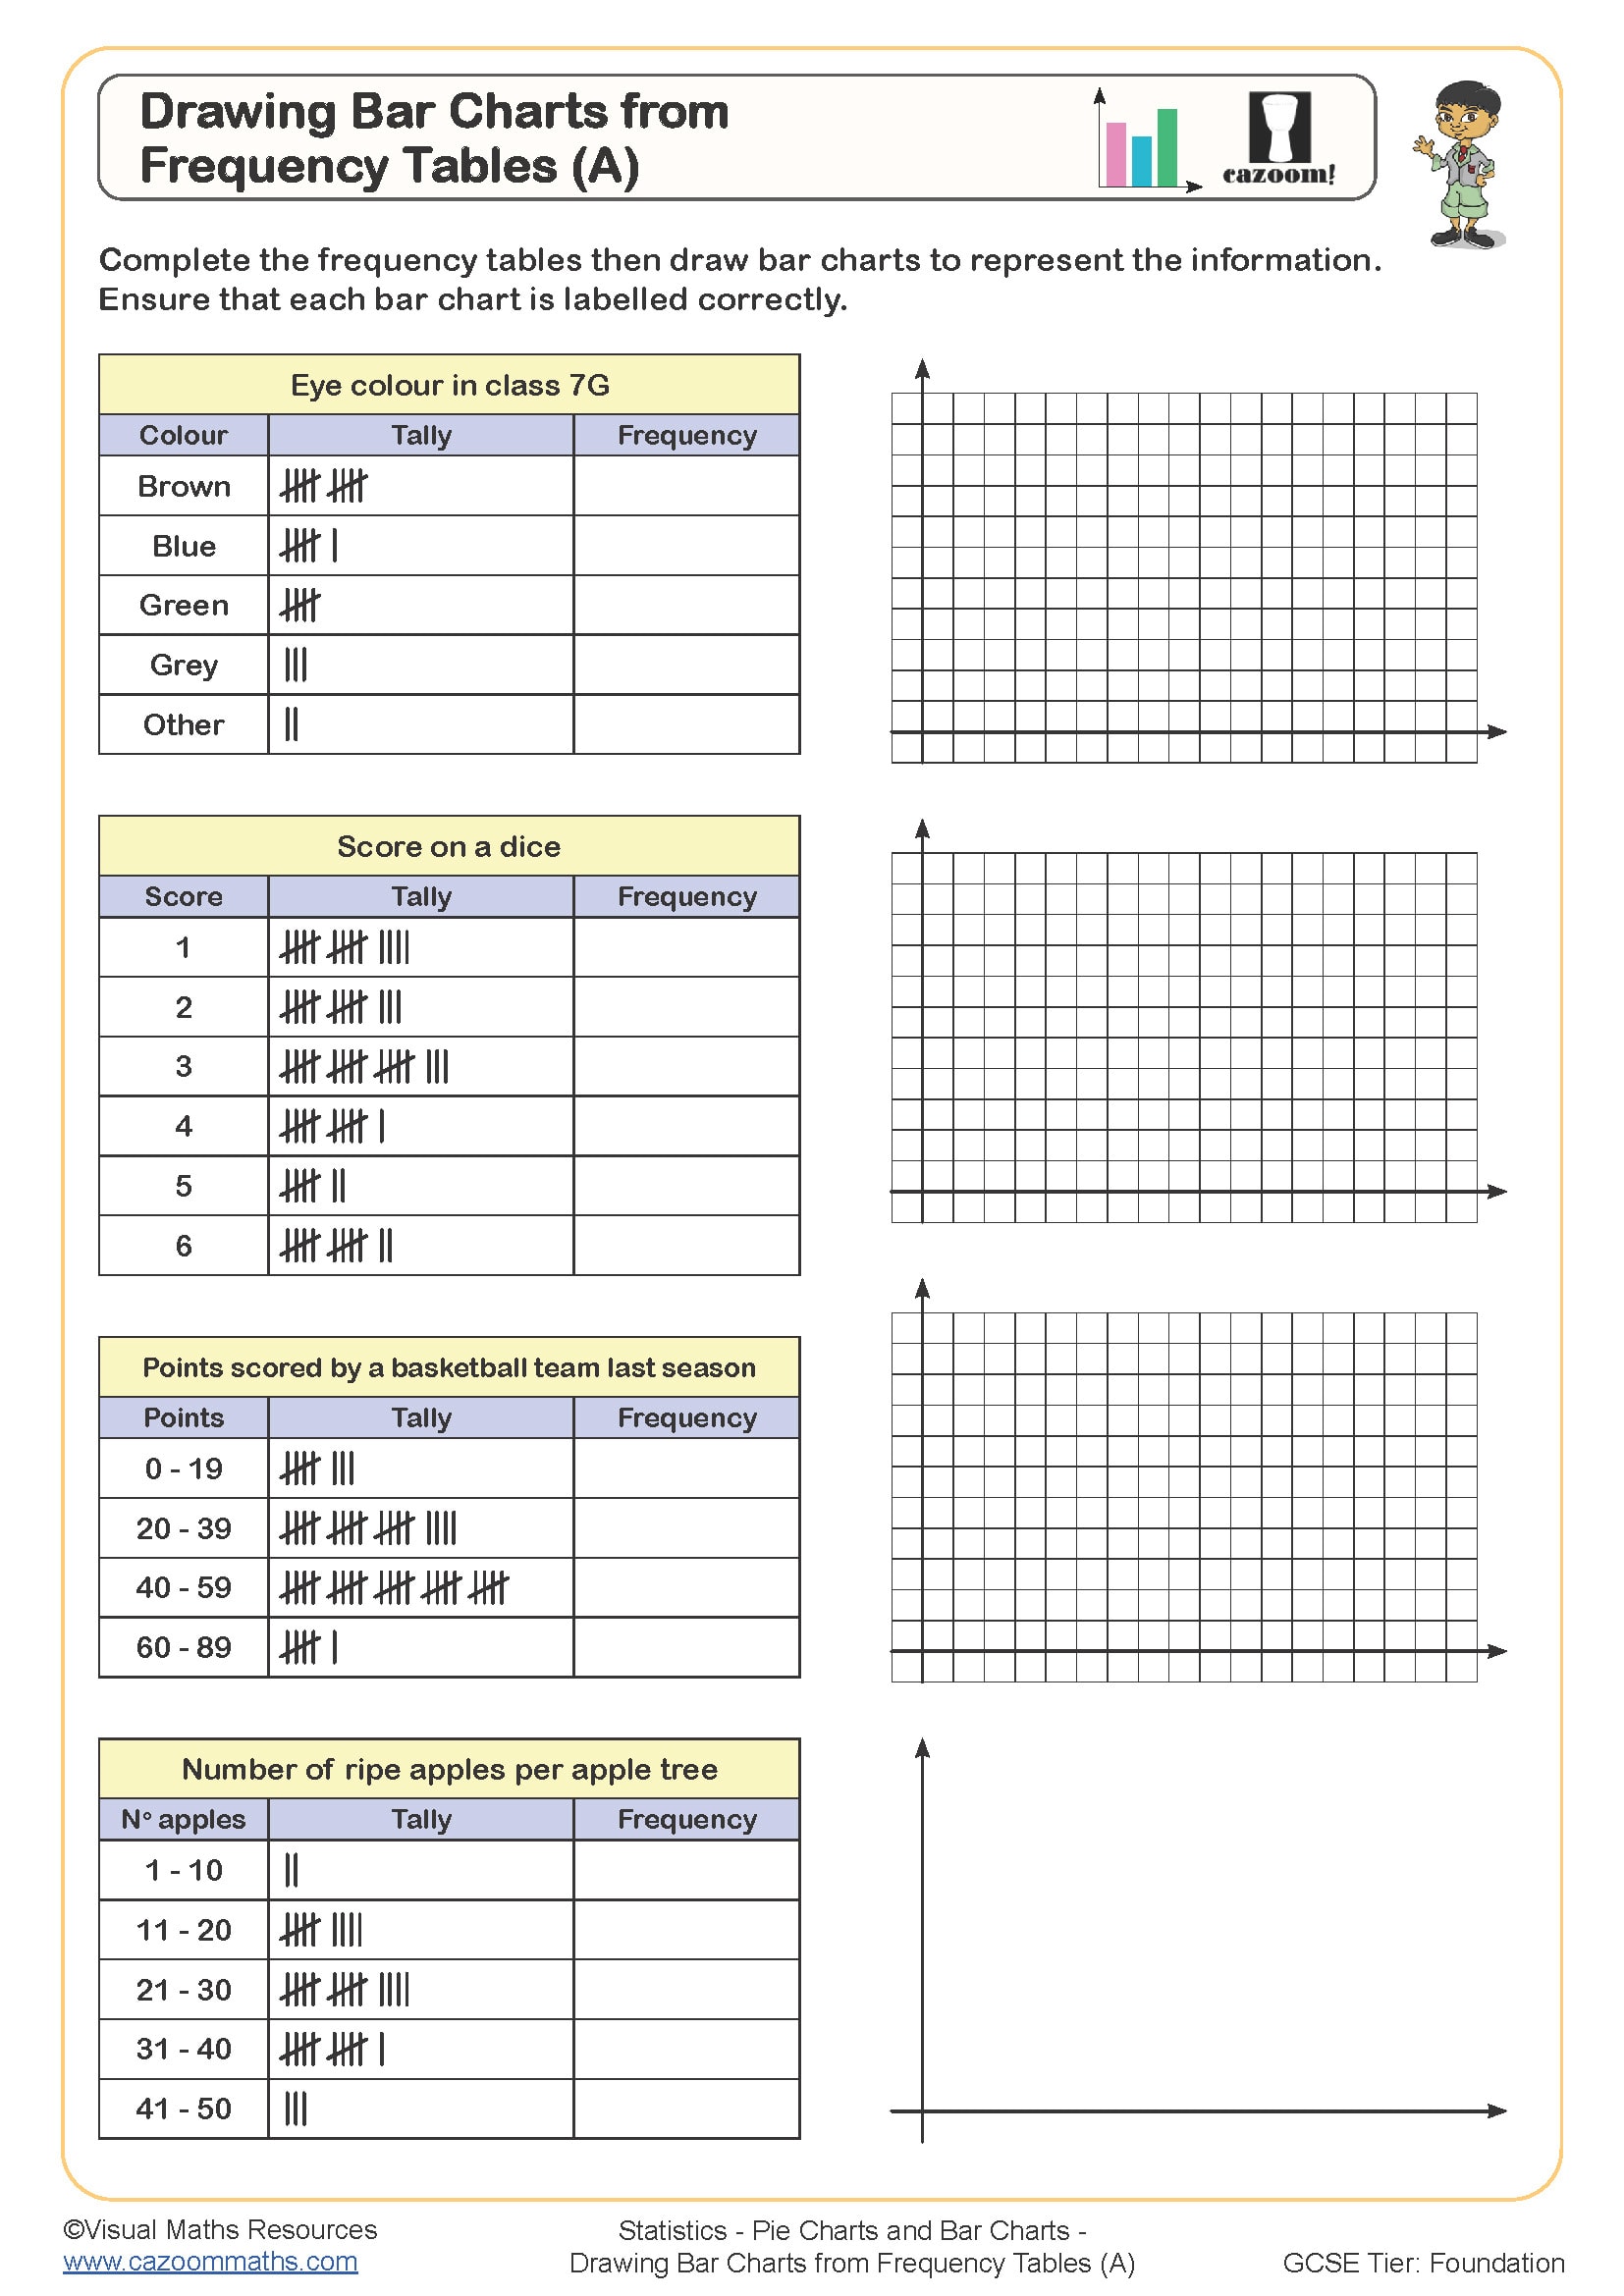
Drawing Bar Charts from Frequency Tables (A)
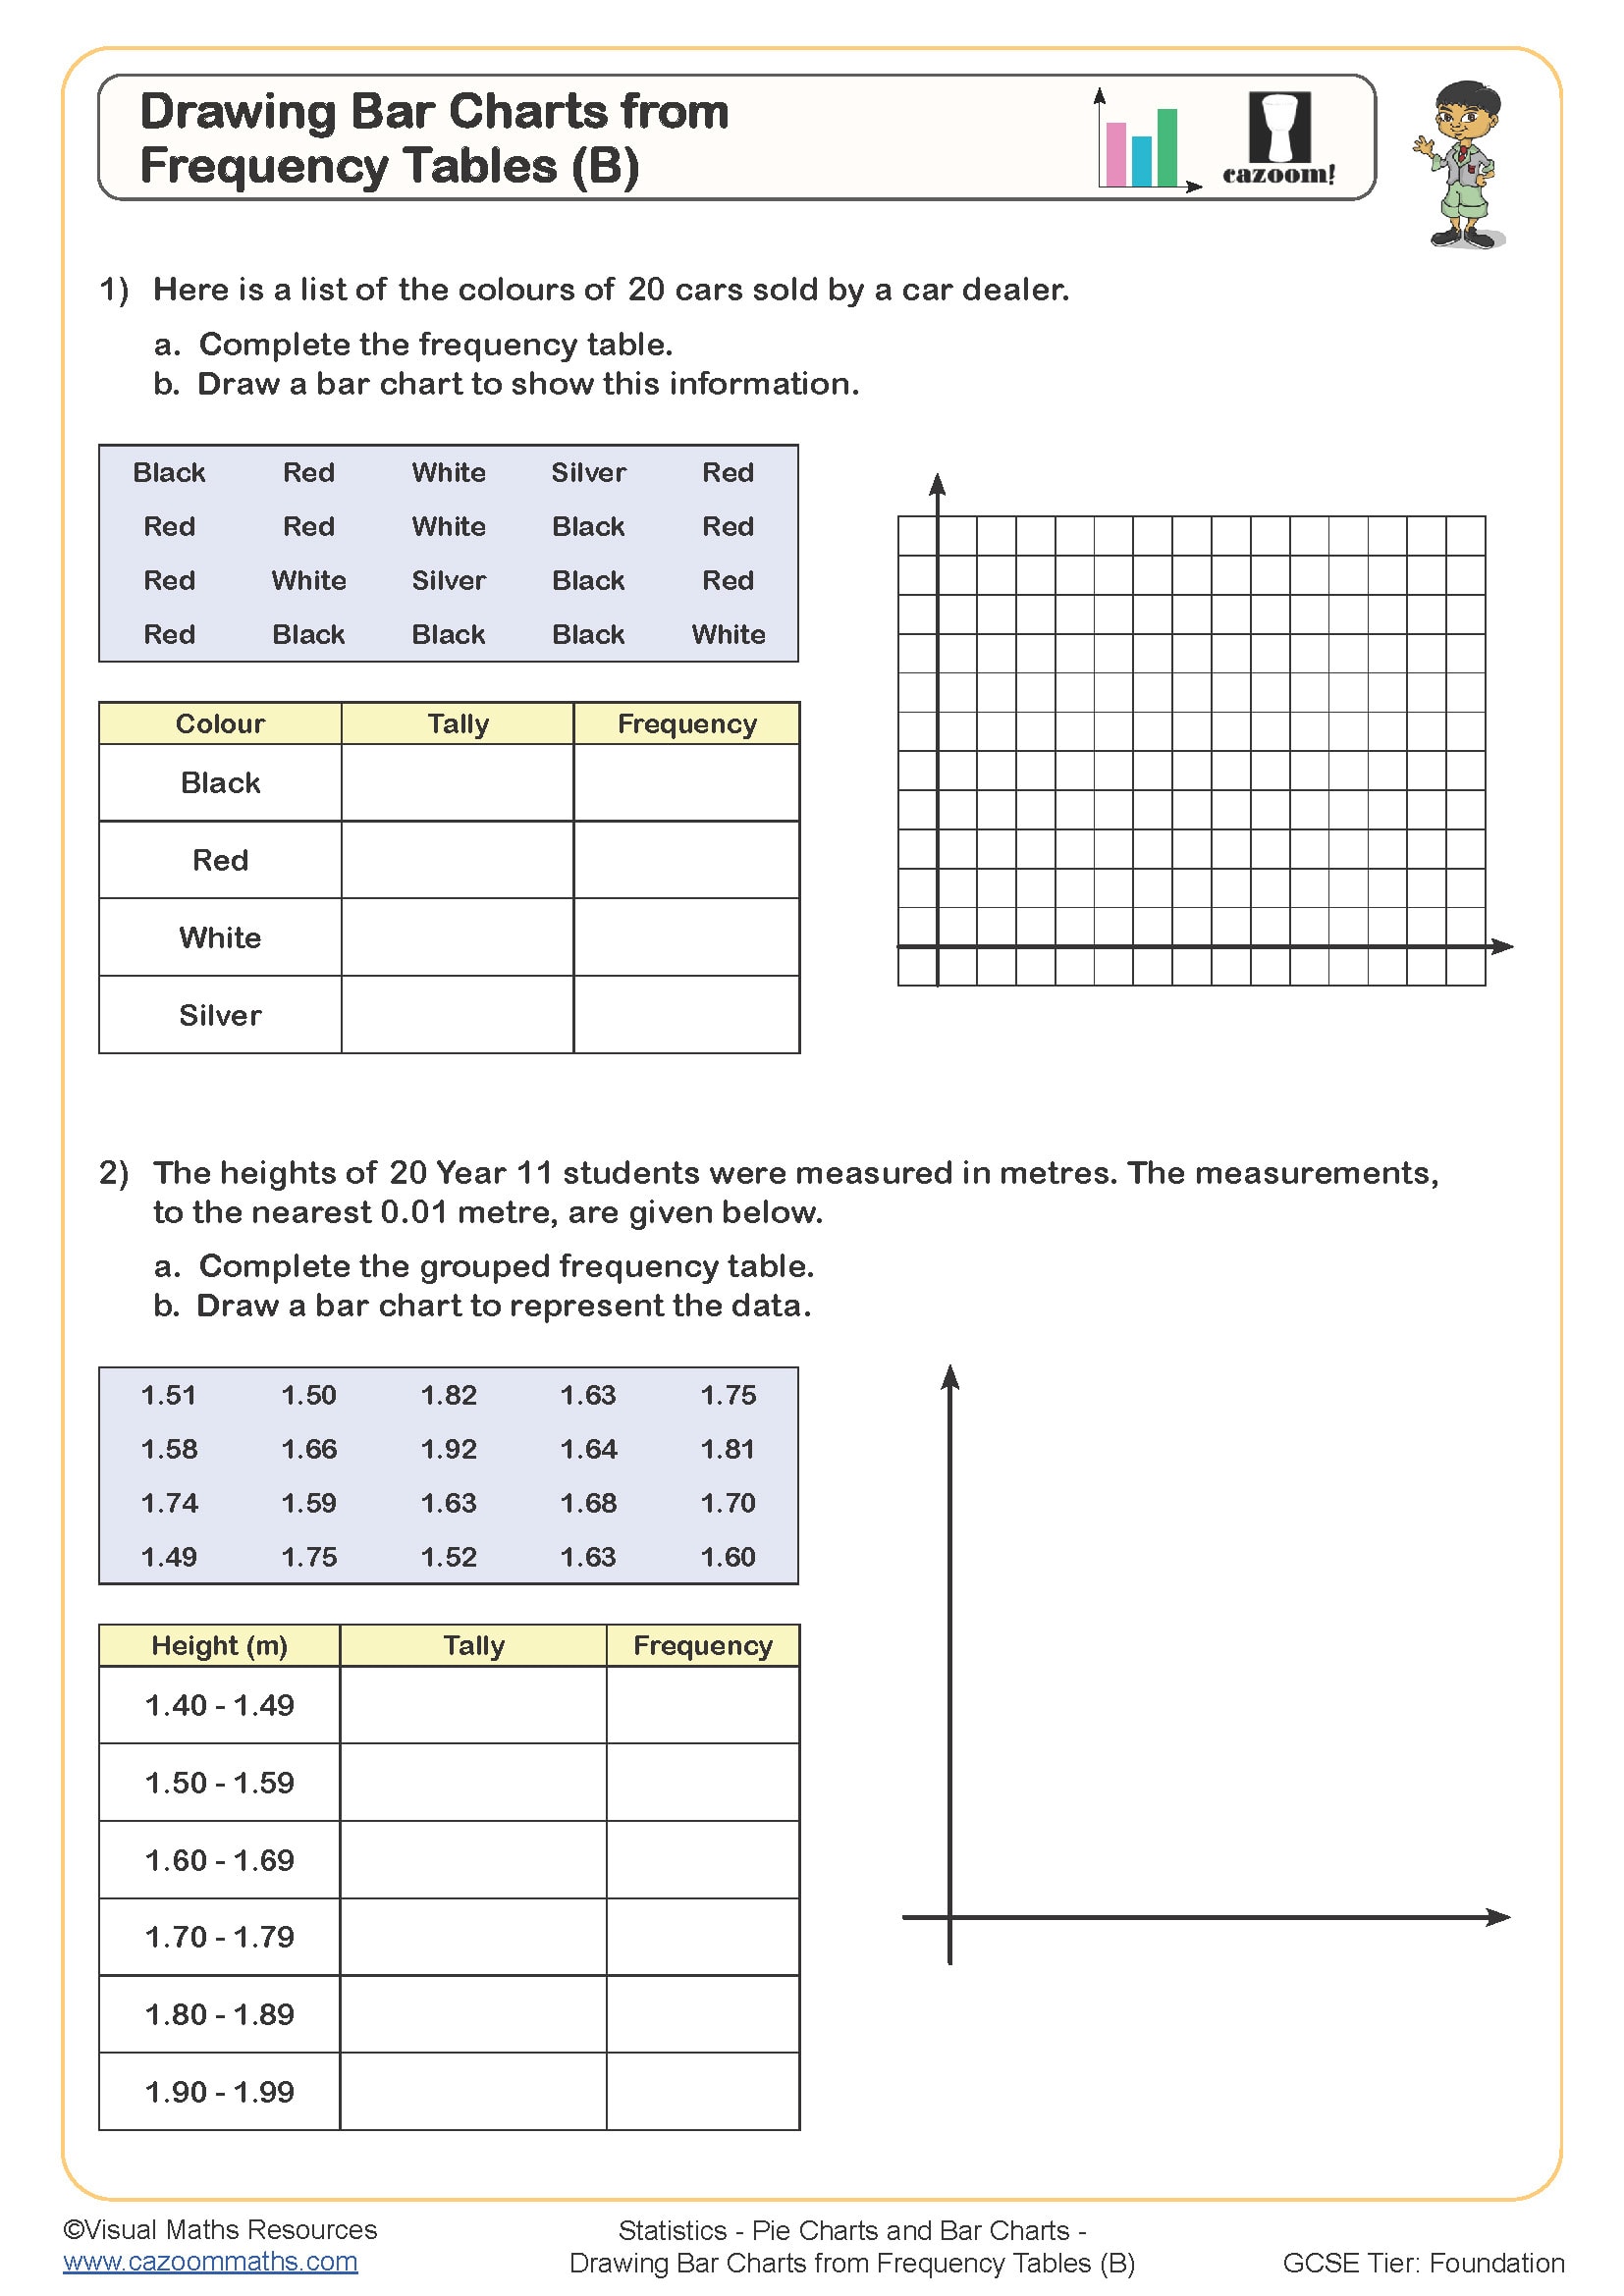
Drawing Bar Charts from Frequency Tables (B)
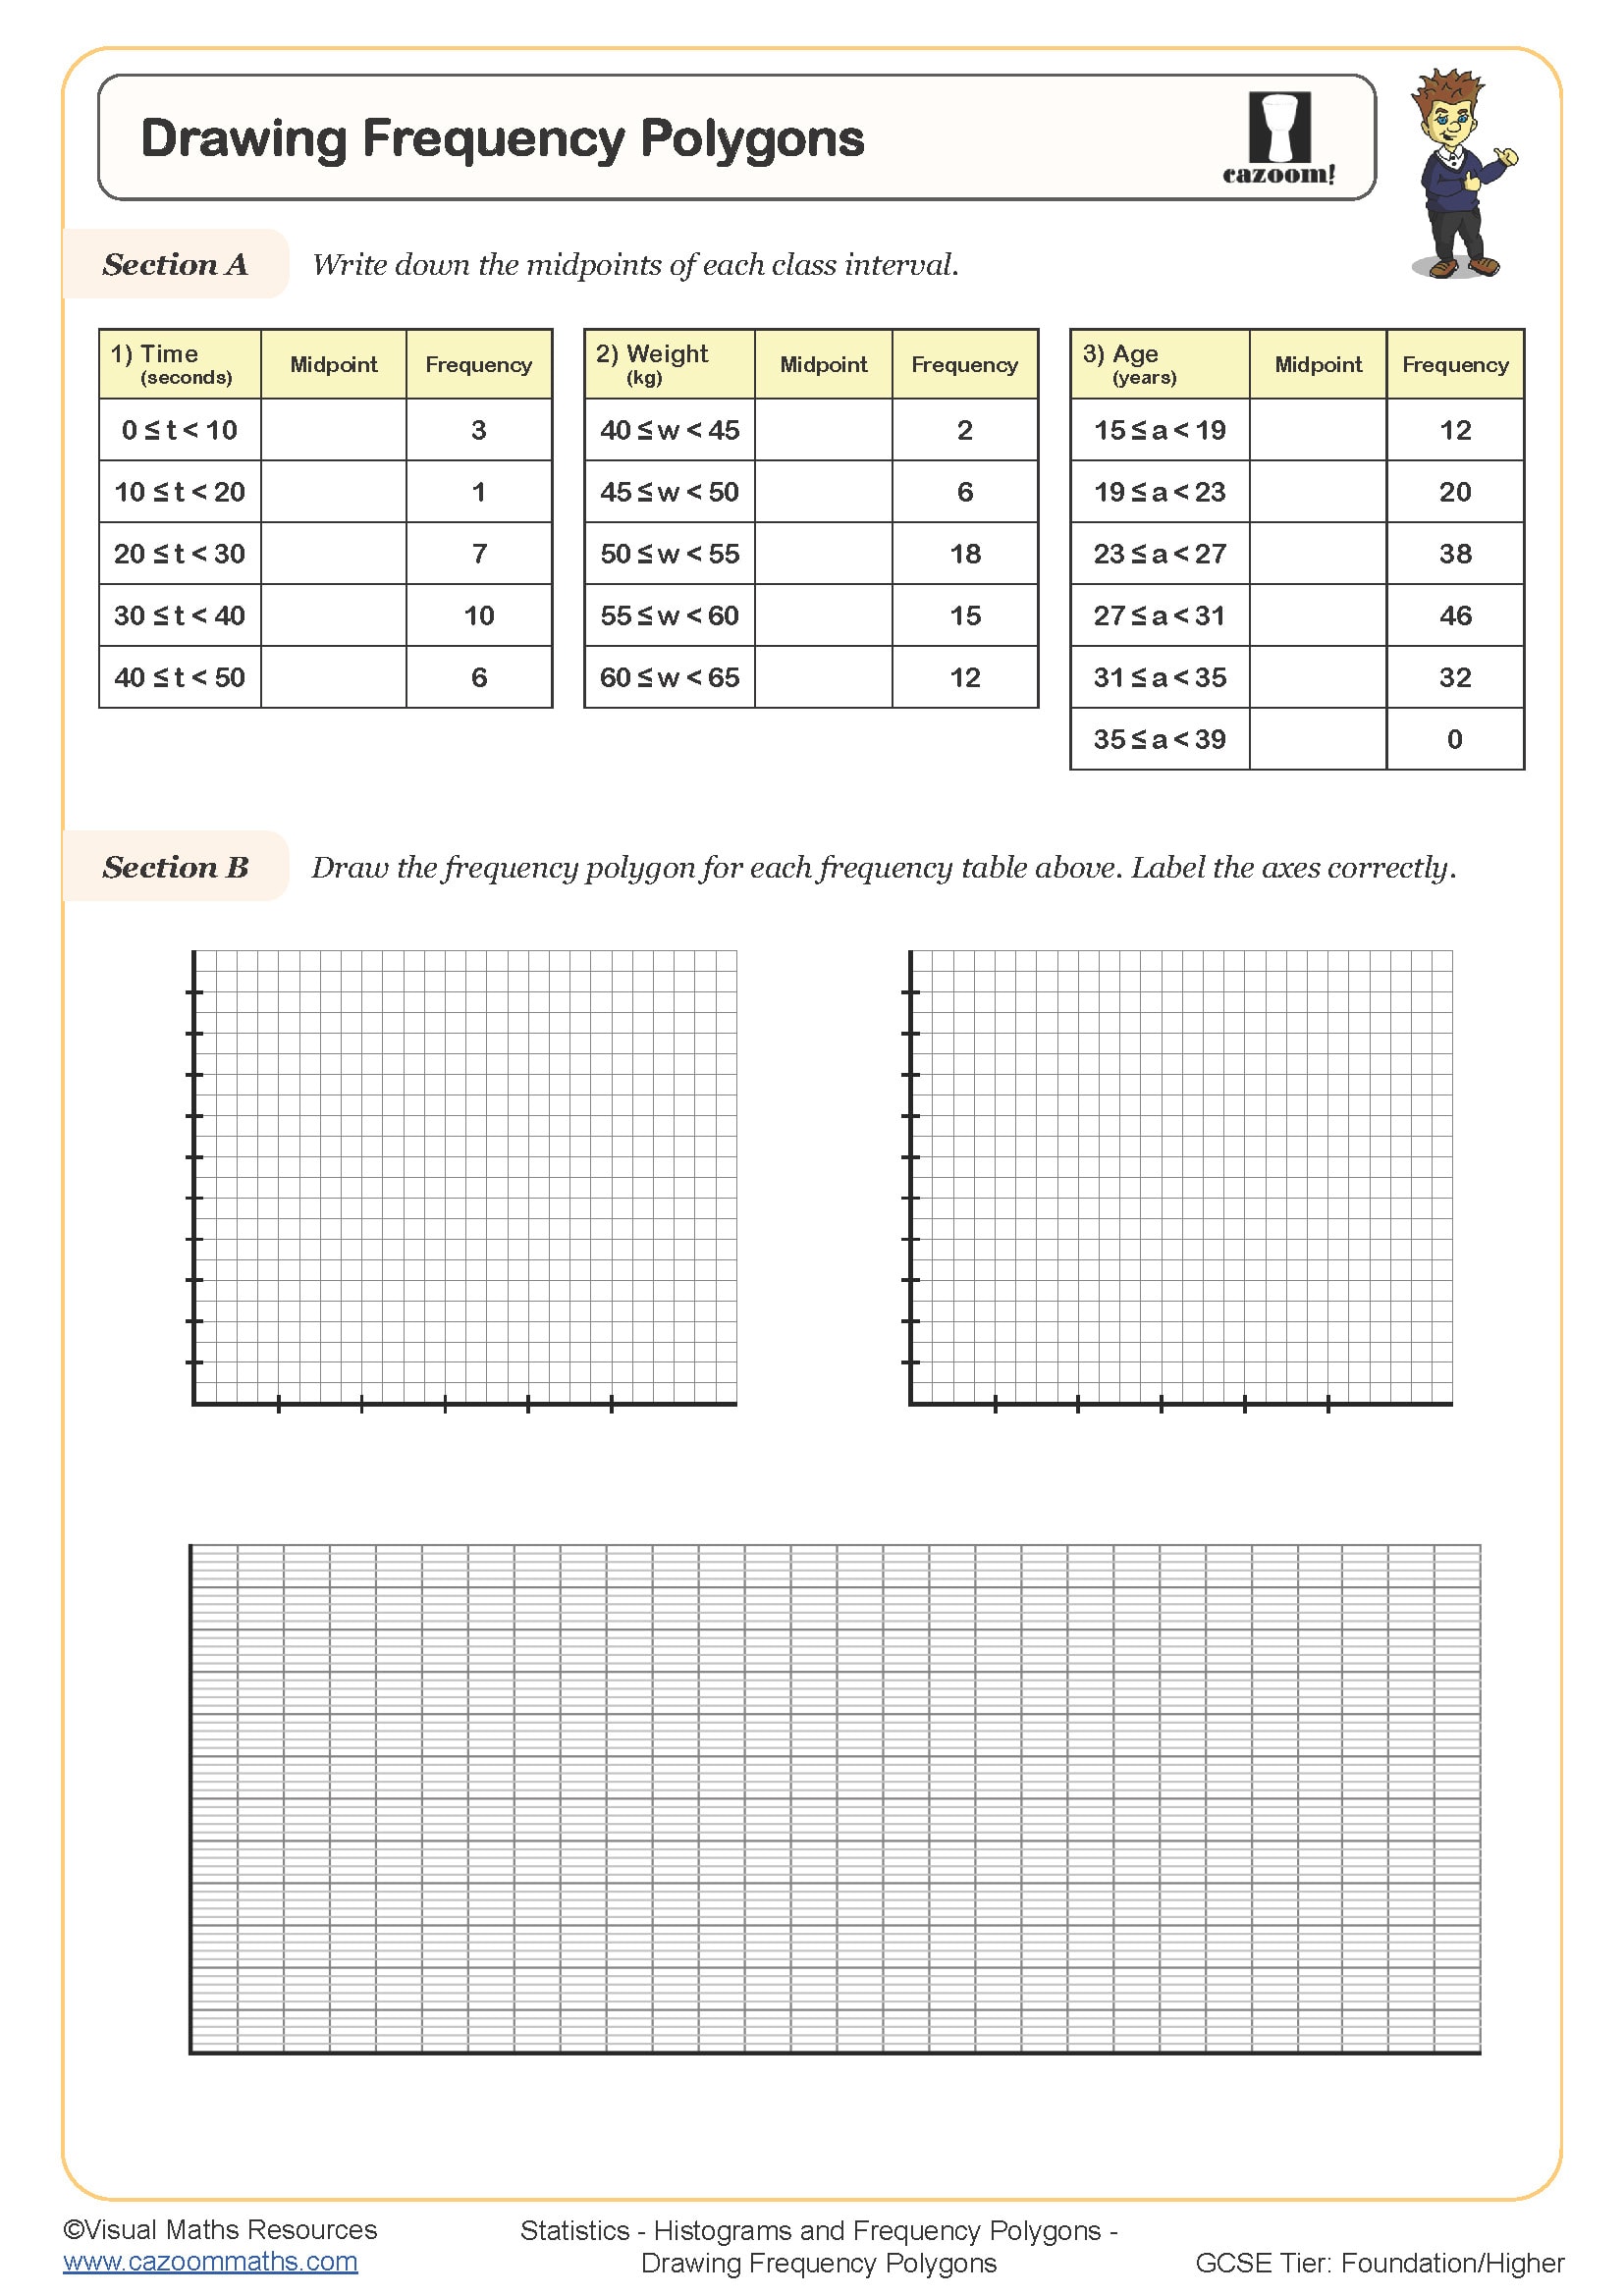
Drawing Frequency Polygons
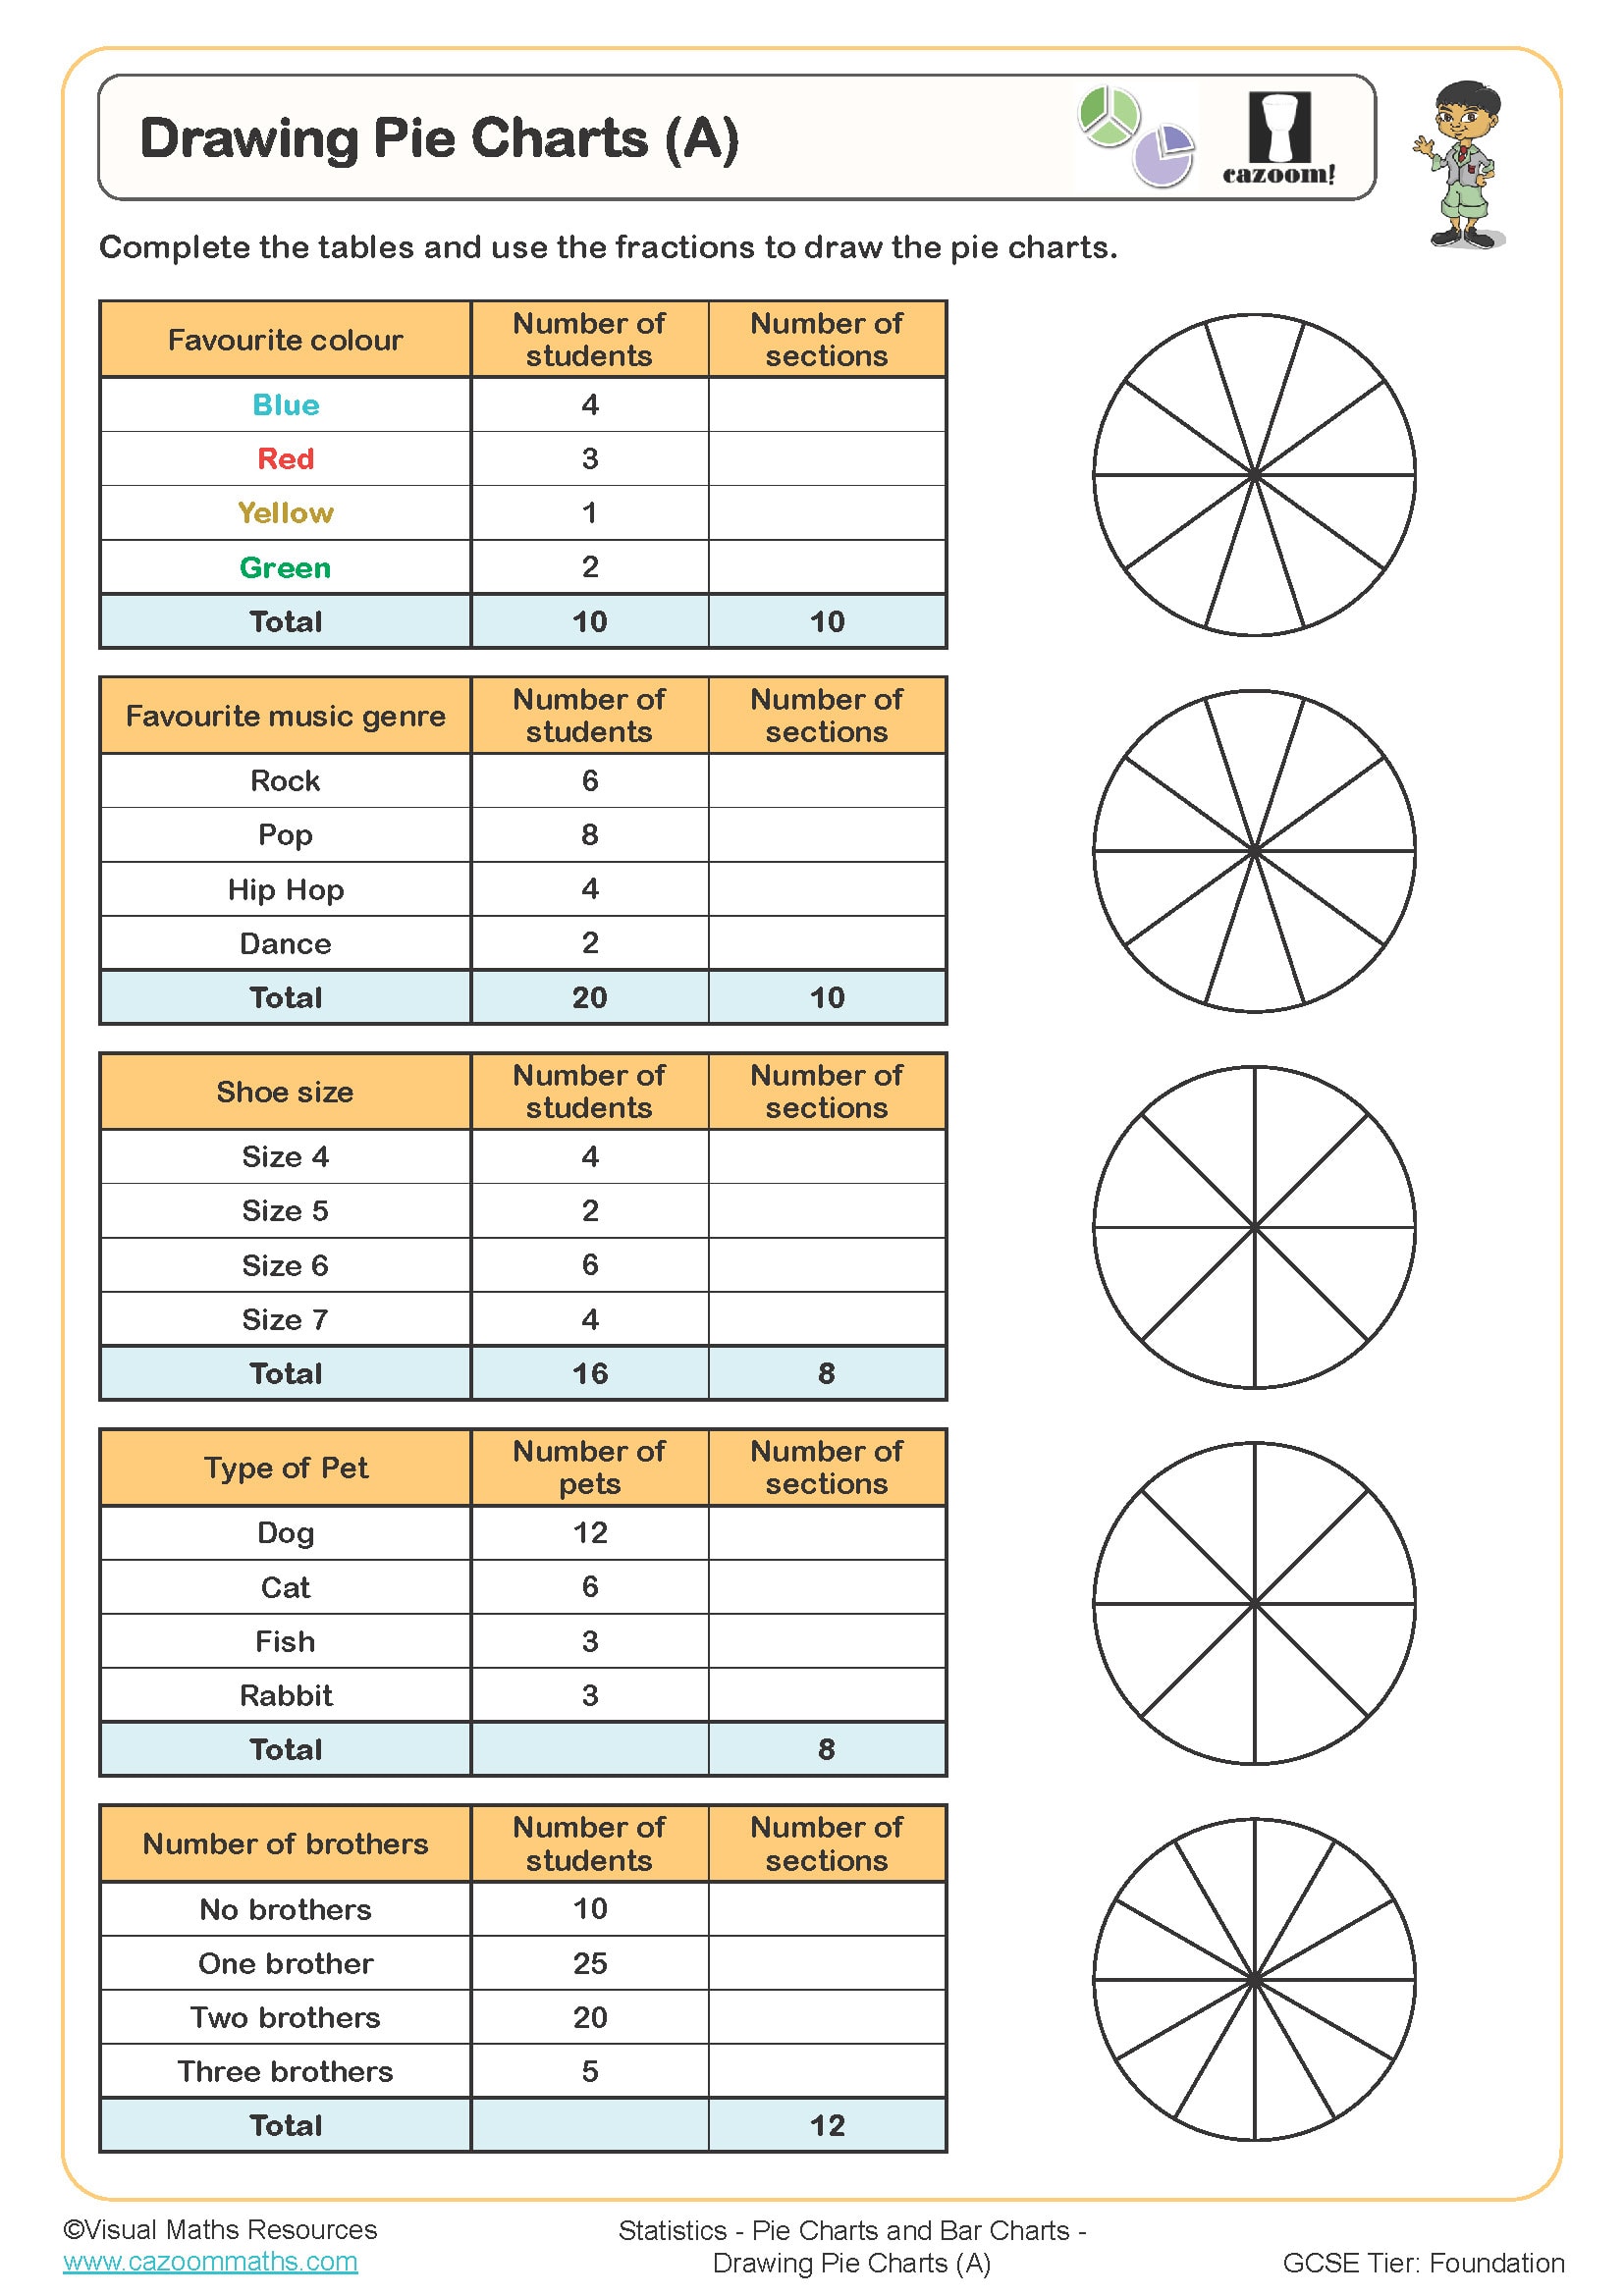
Drawing Pie Charts (A)
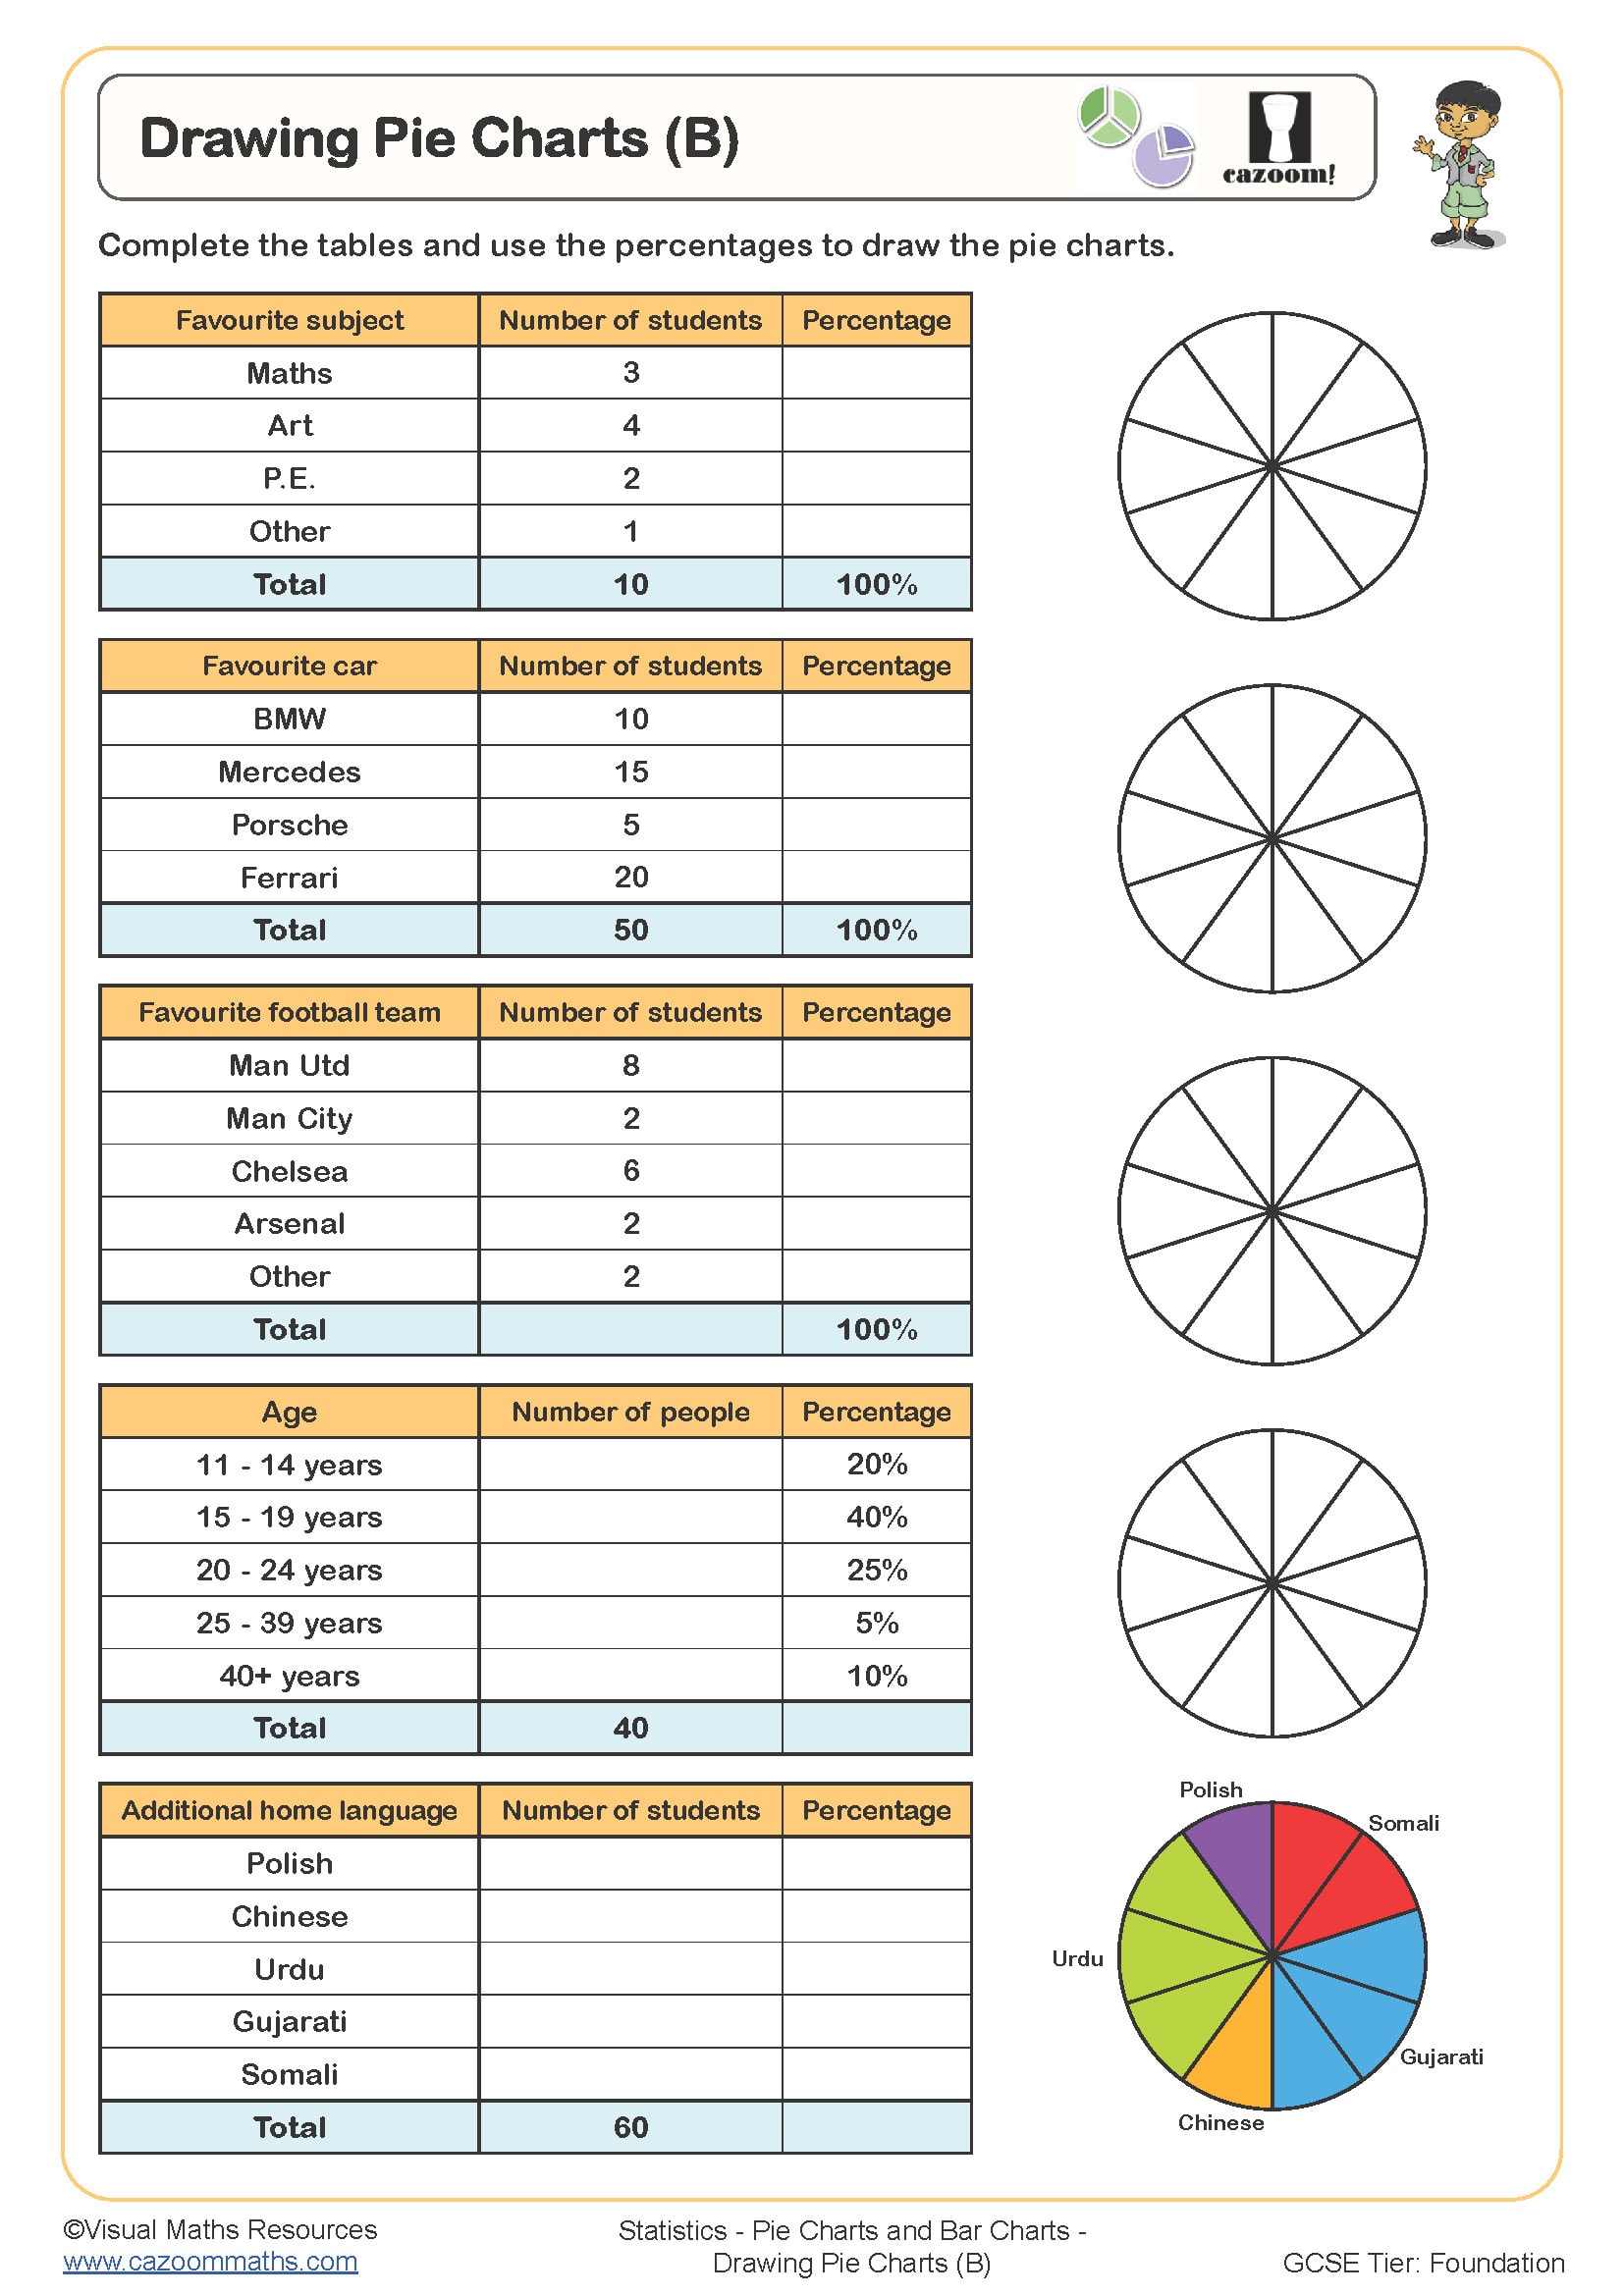
Drawing Pie Charts (B)
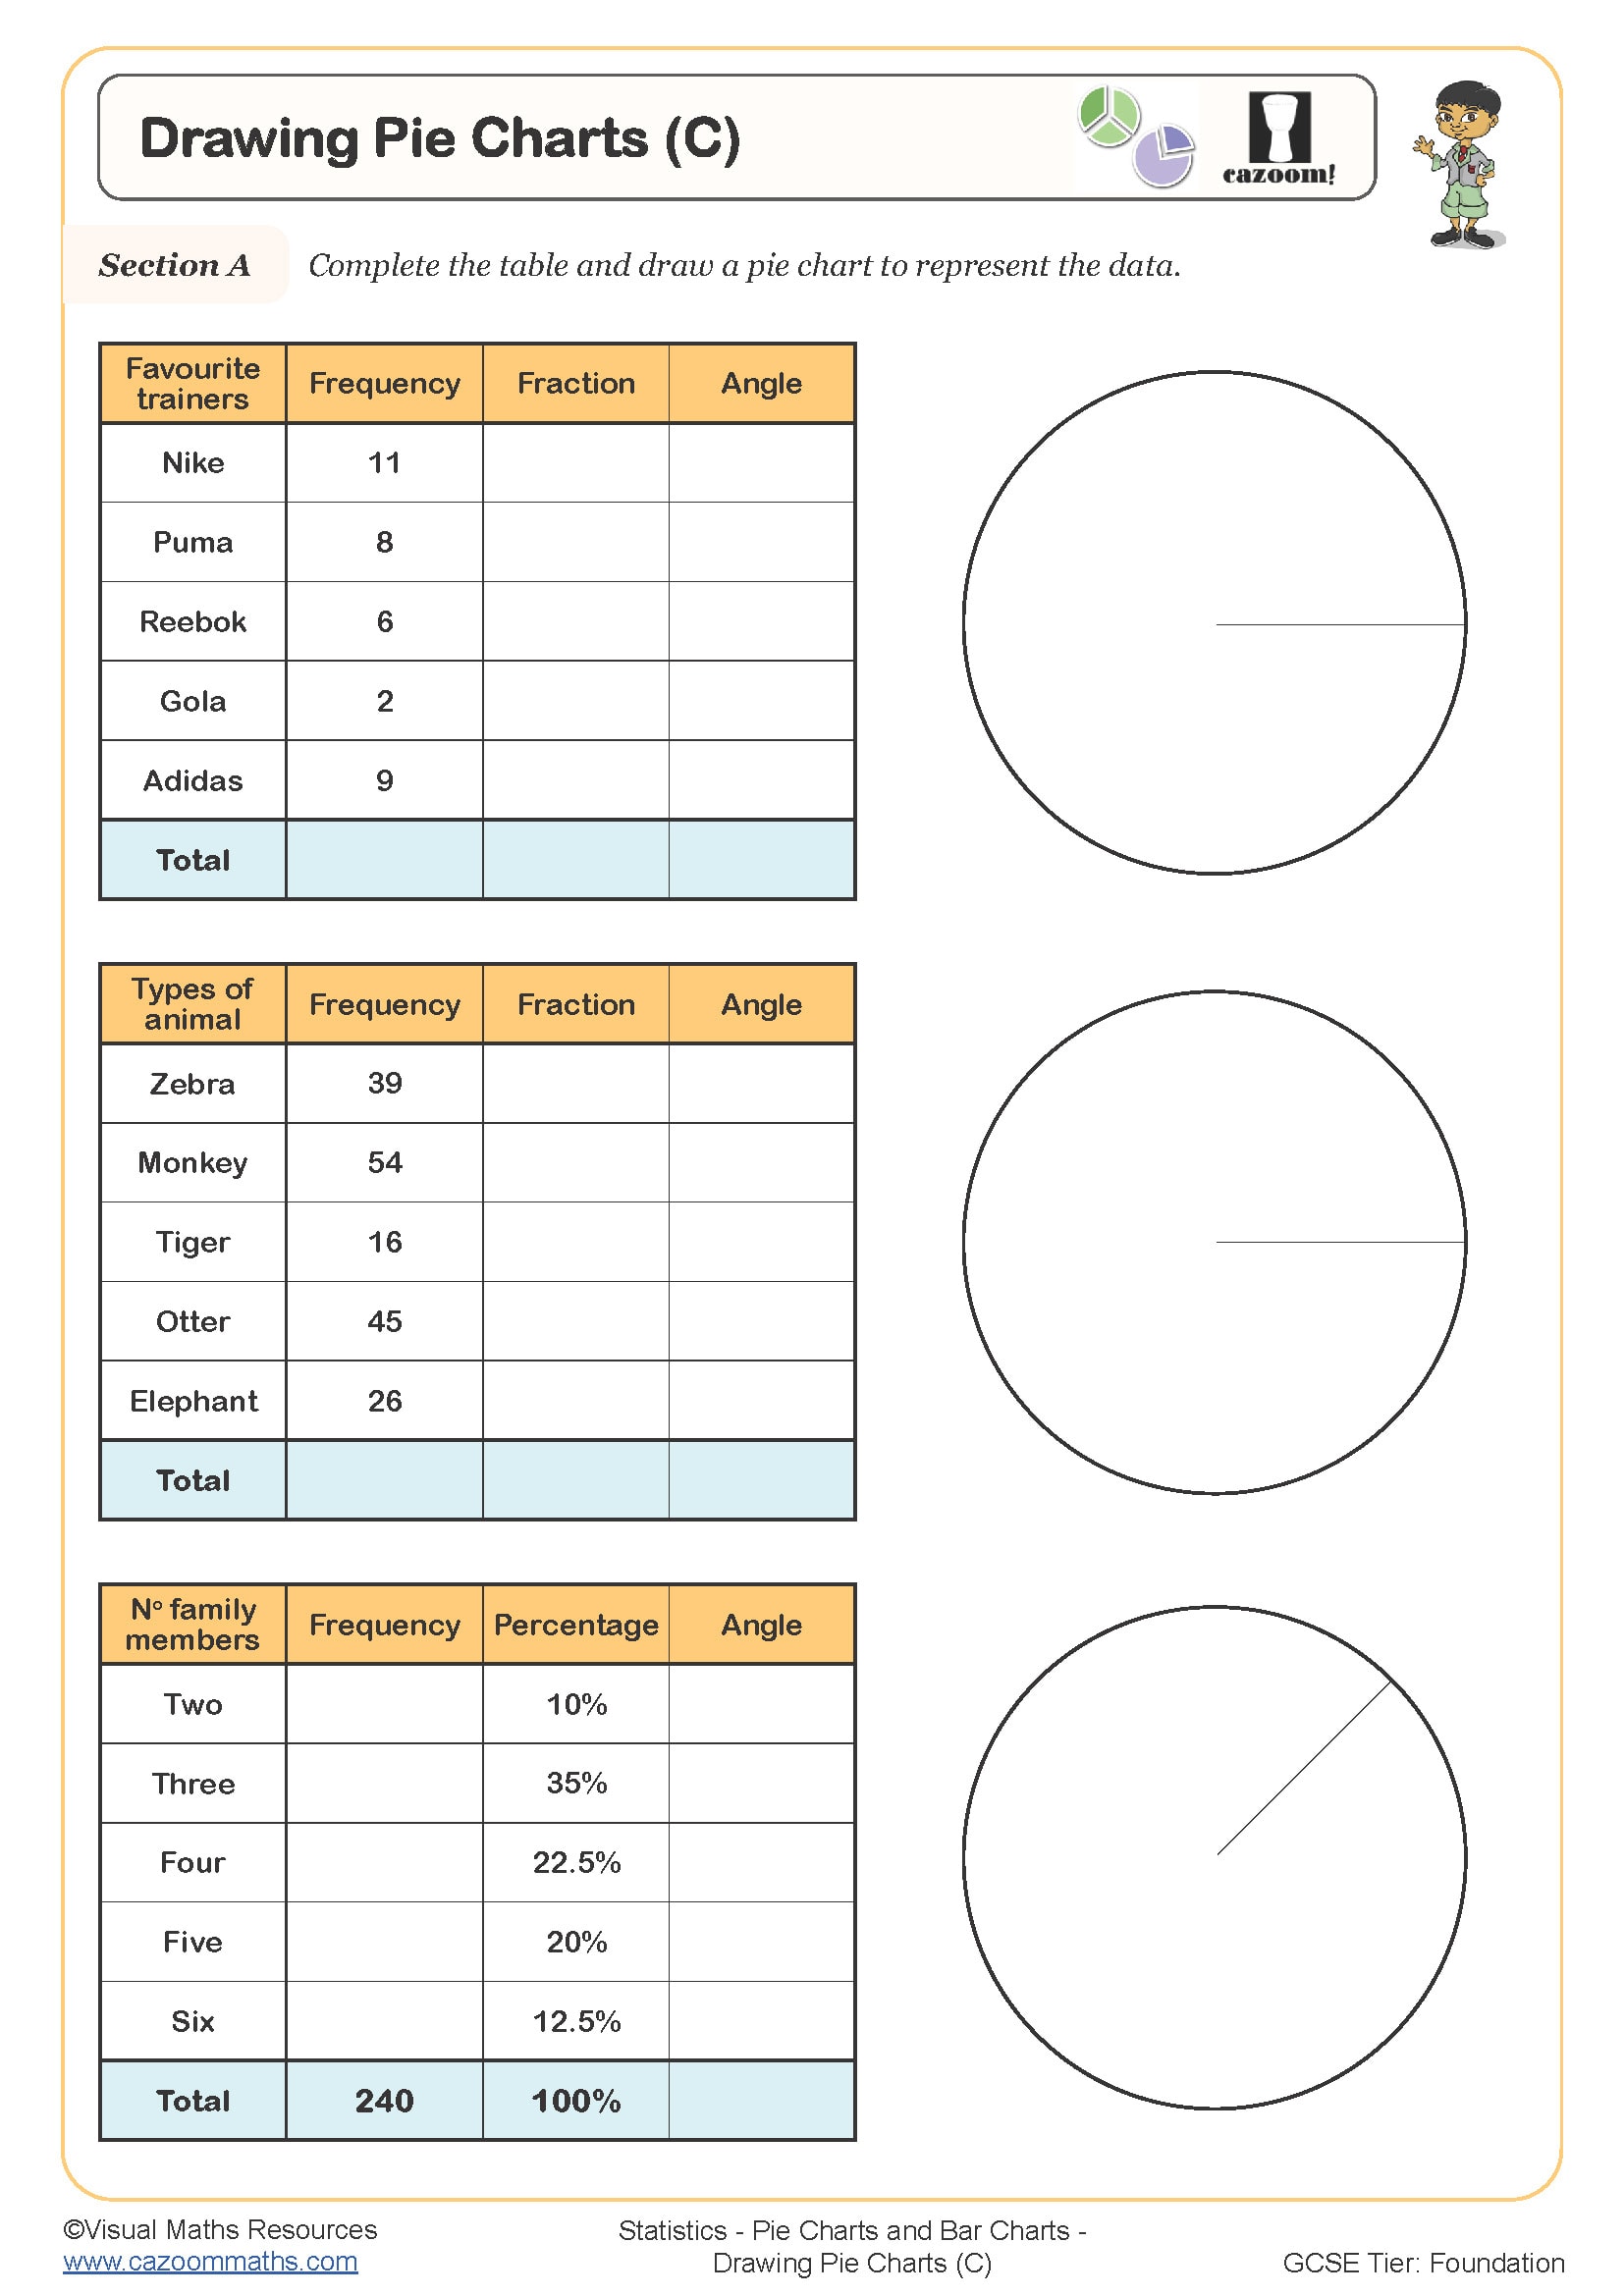
Drawing Pie Charts (C)
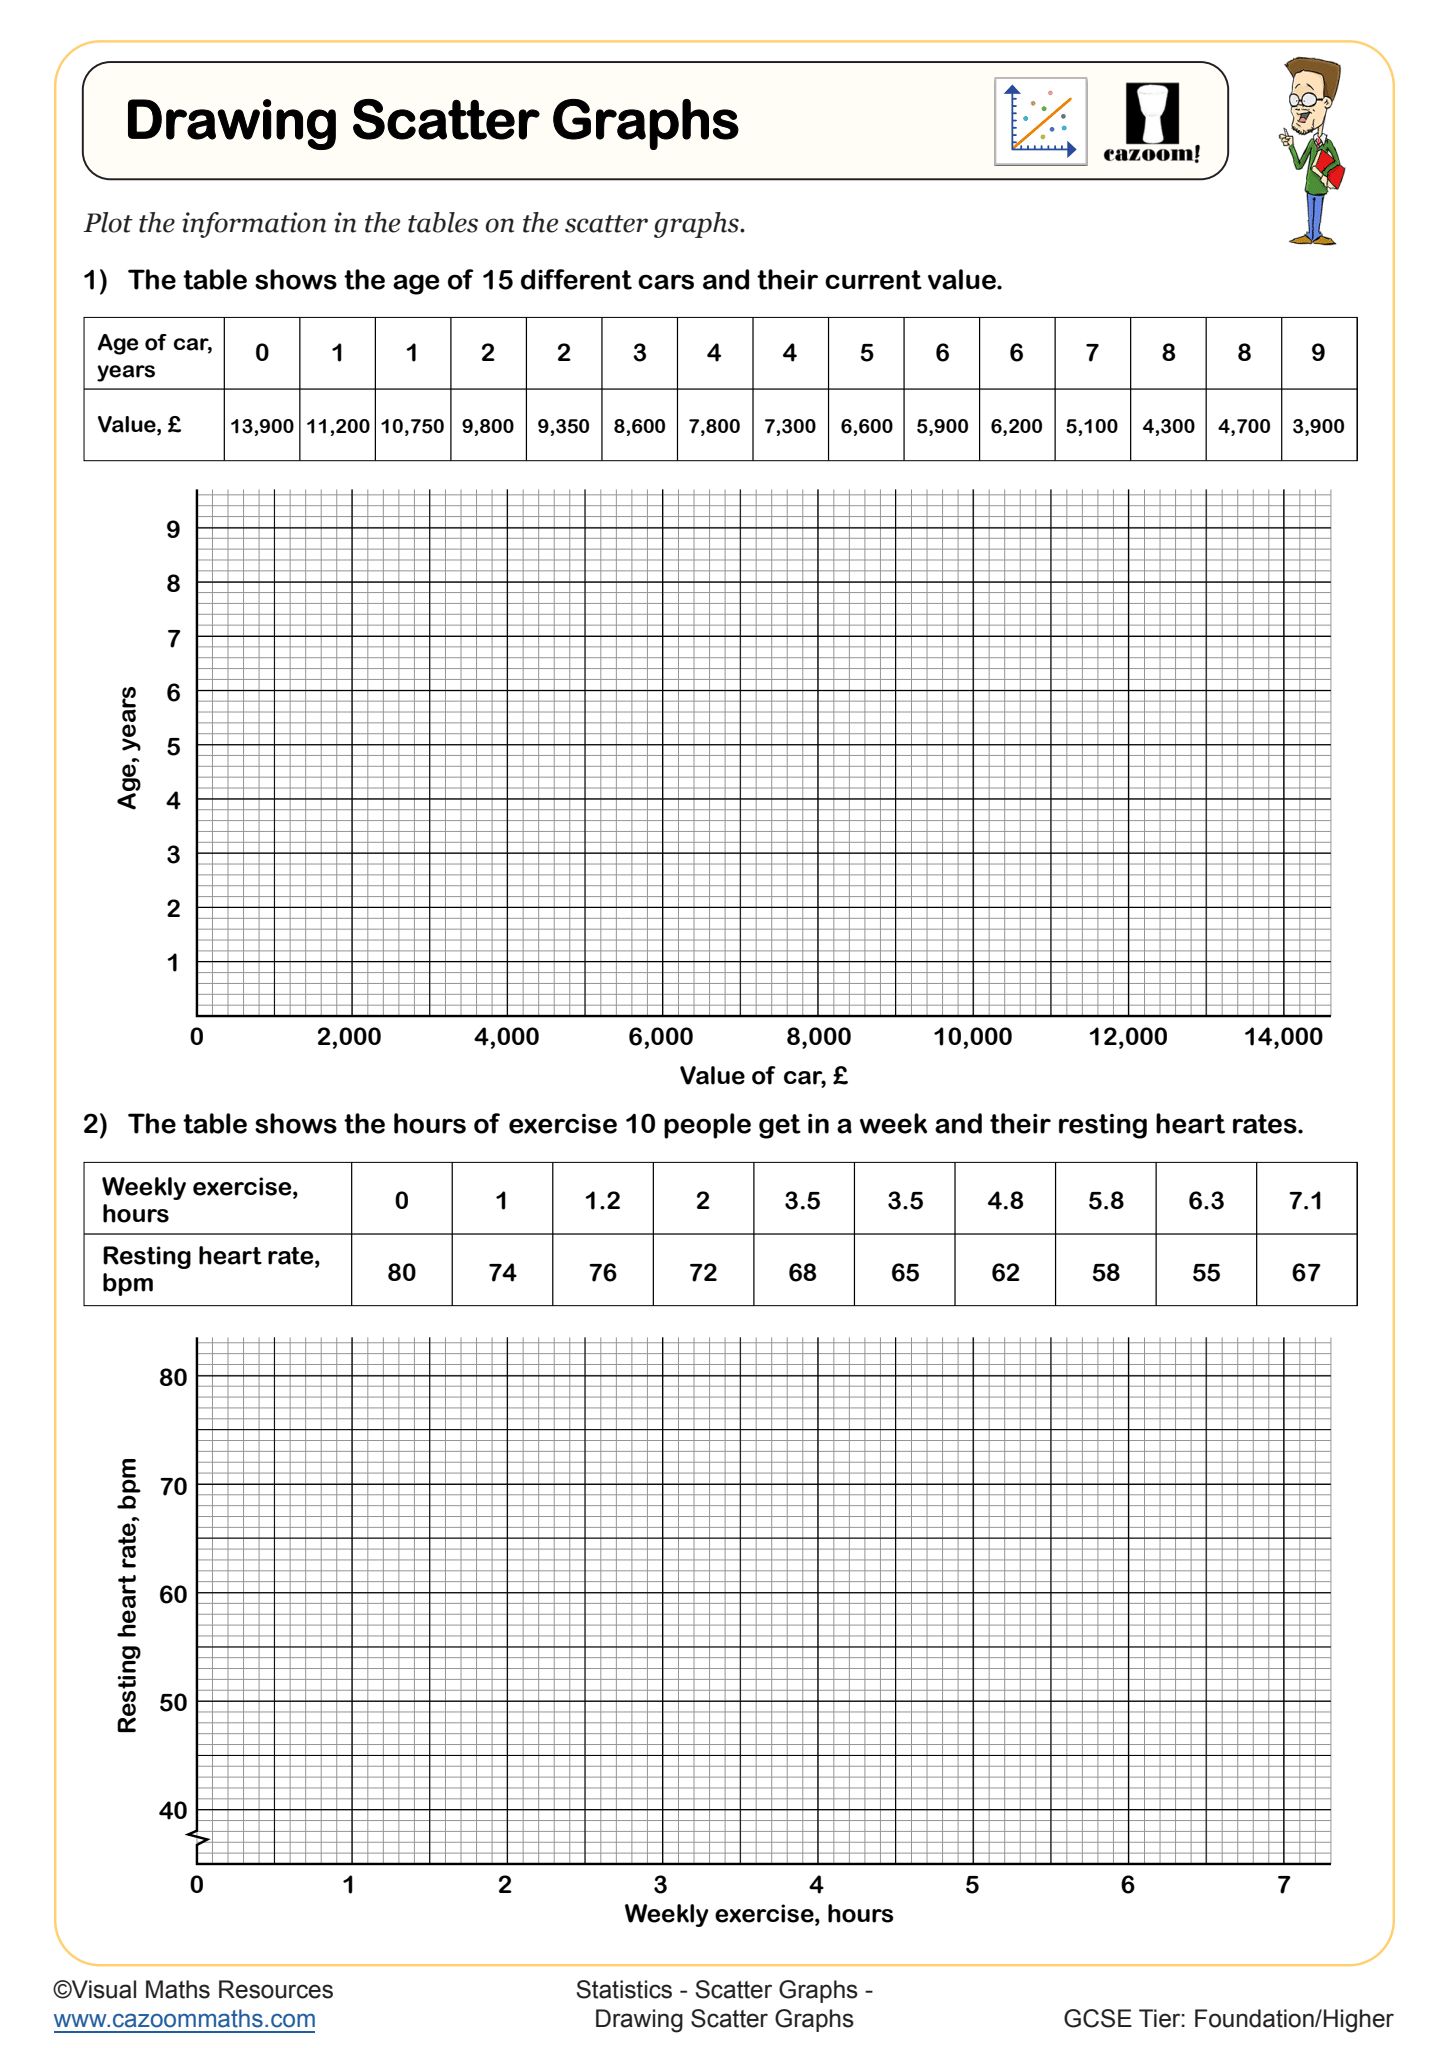
Drawing Scatter Graphs
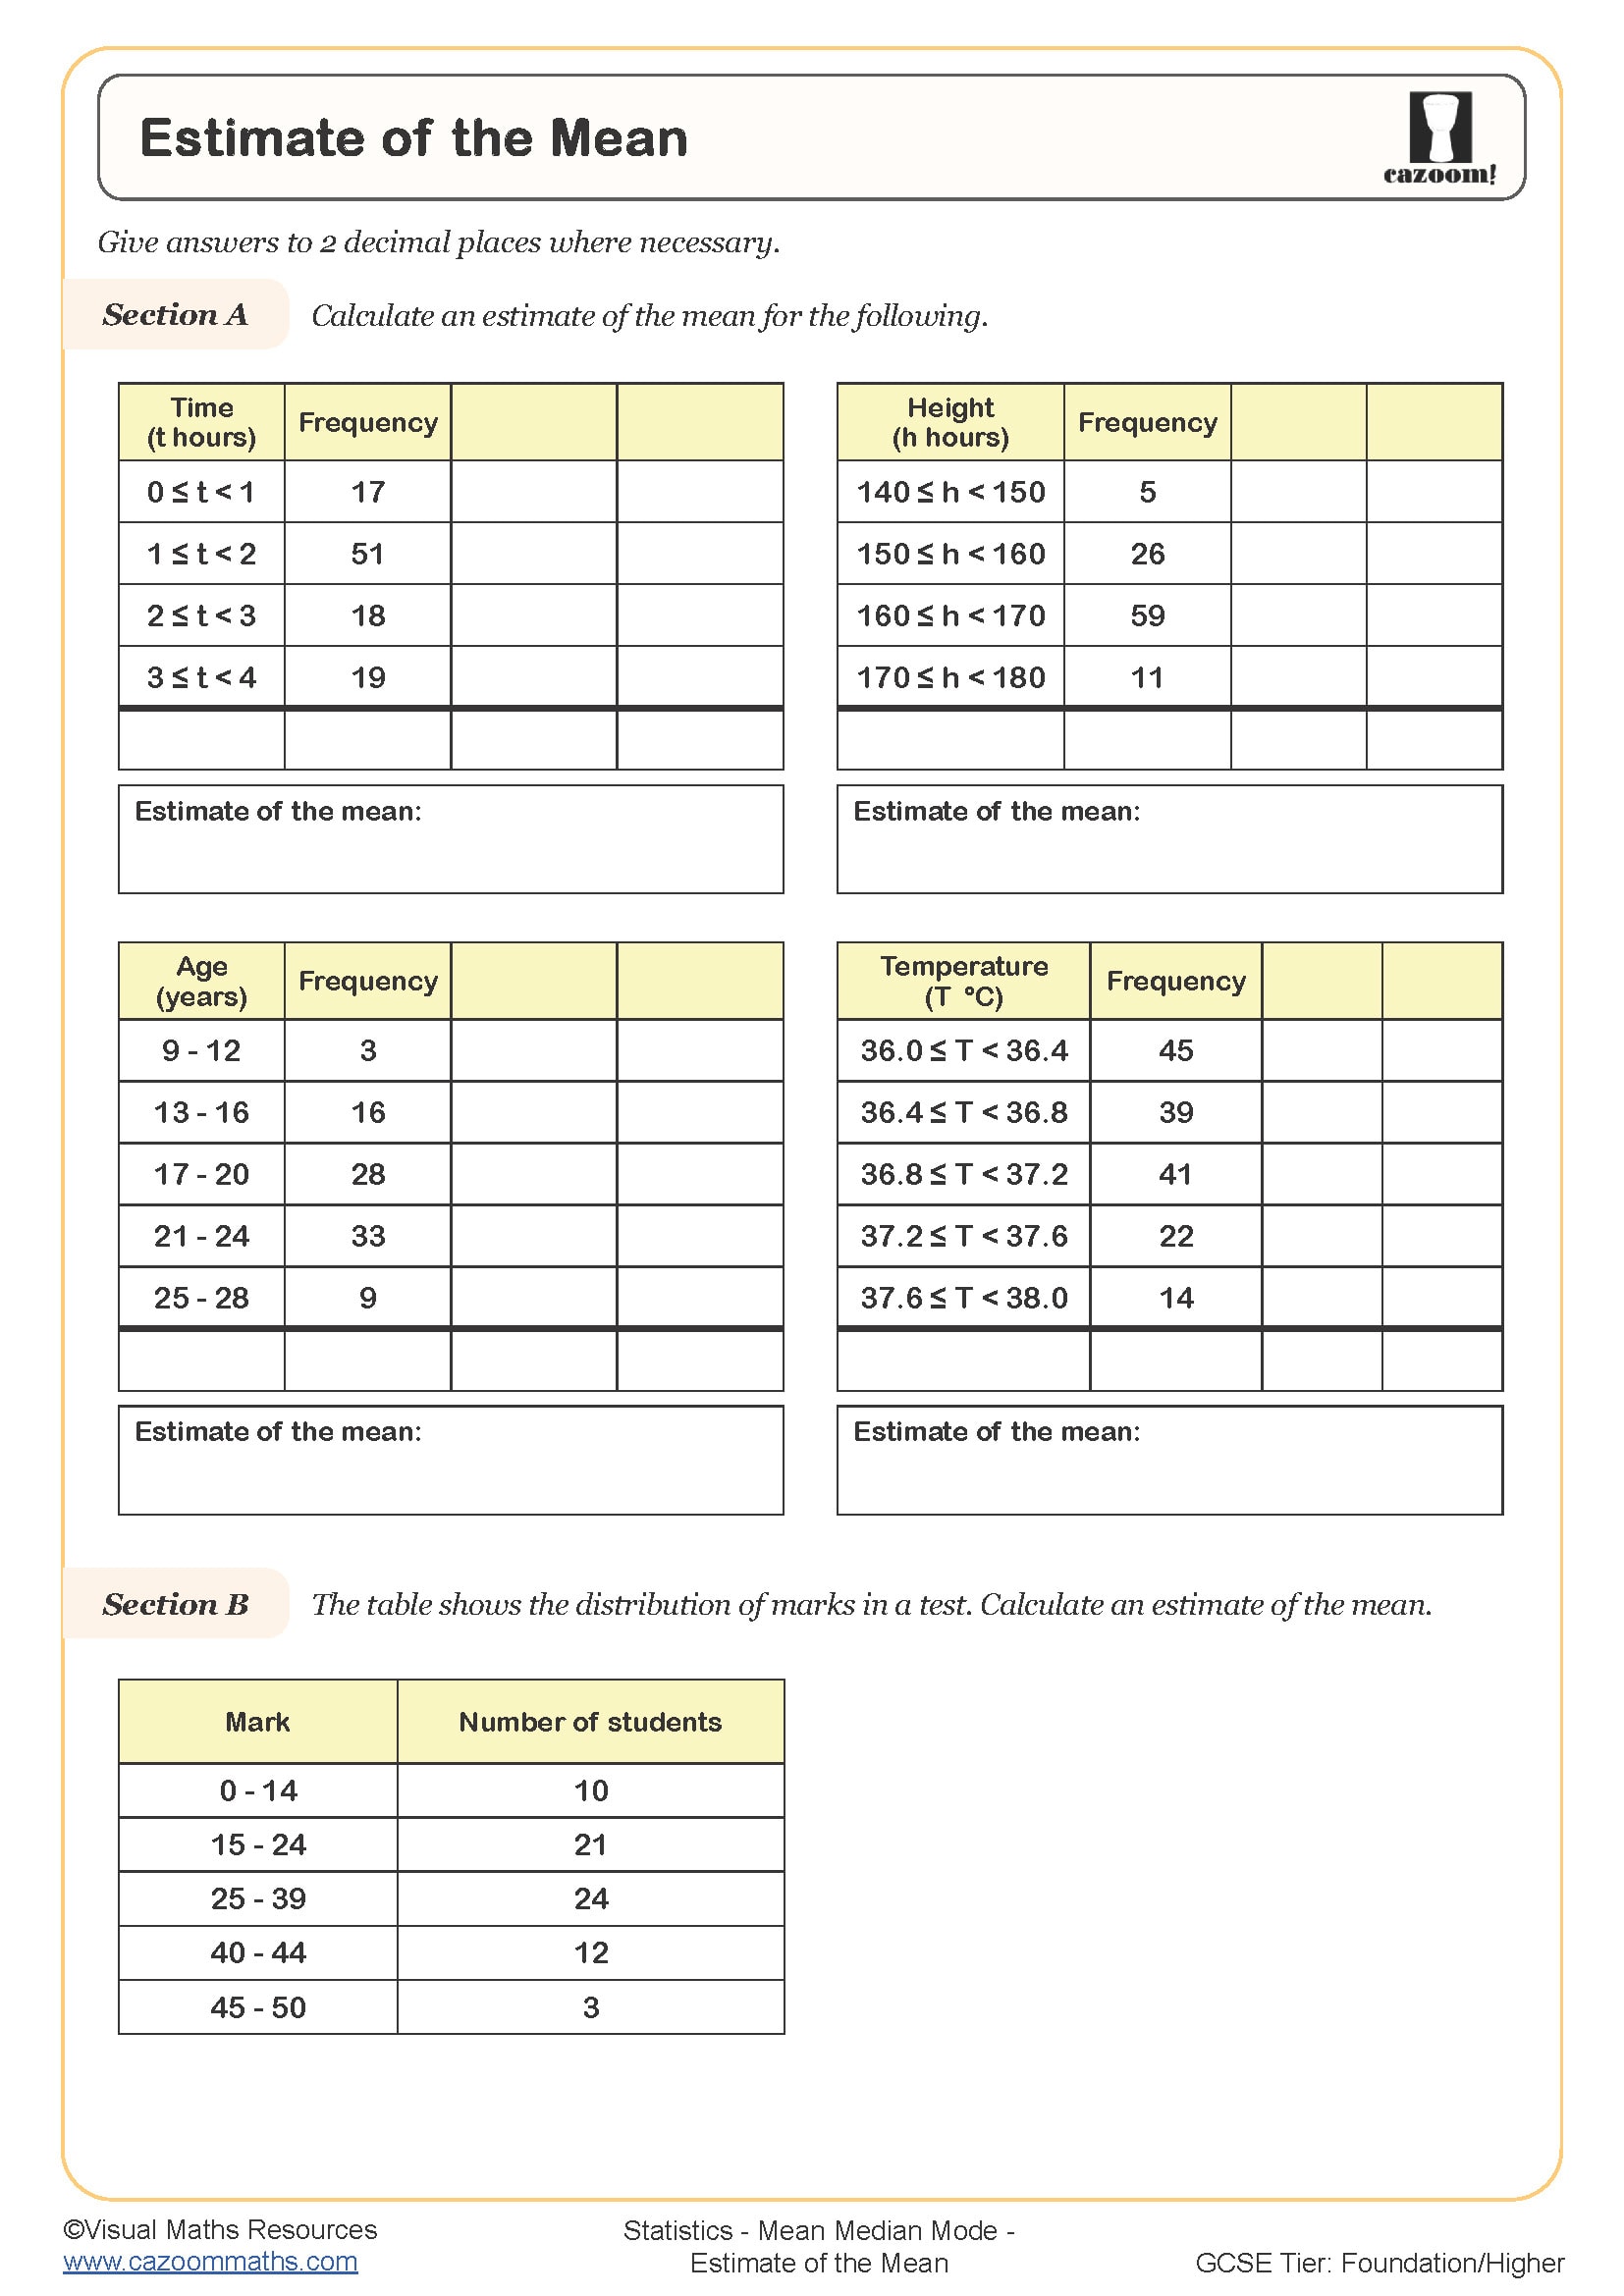
Estimate of the Mean
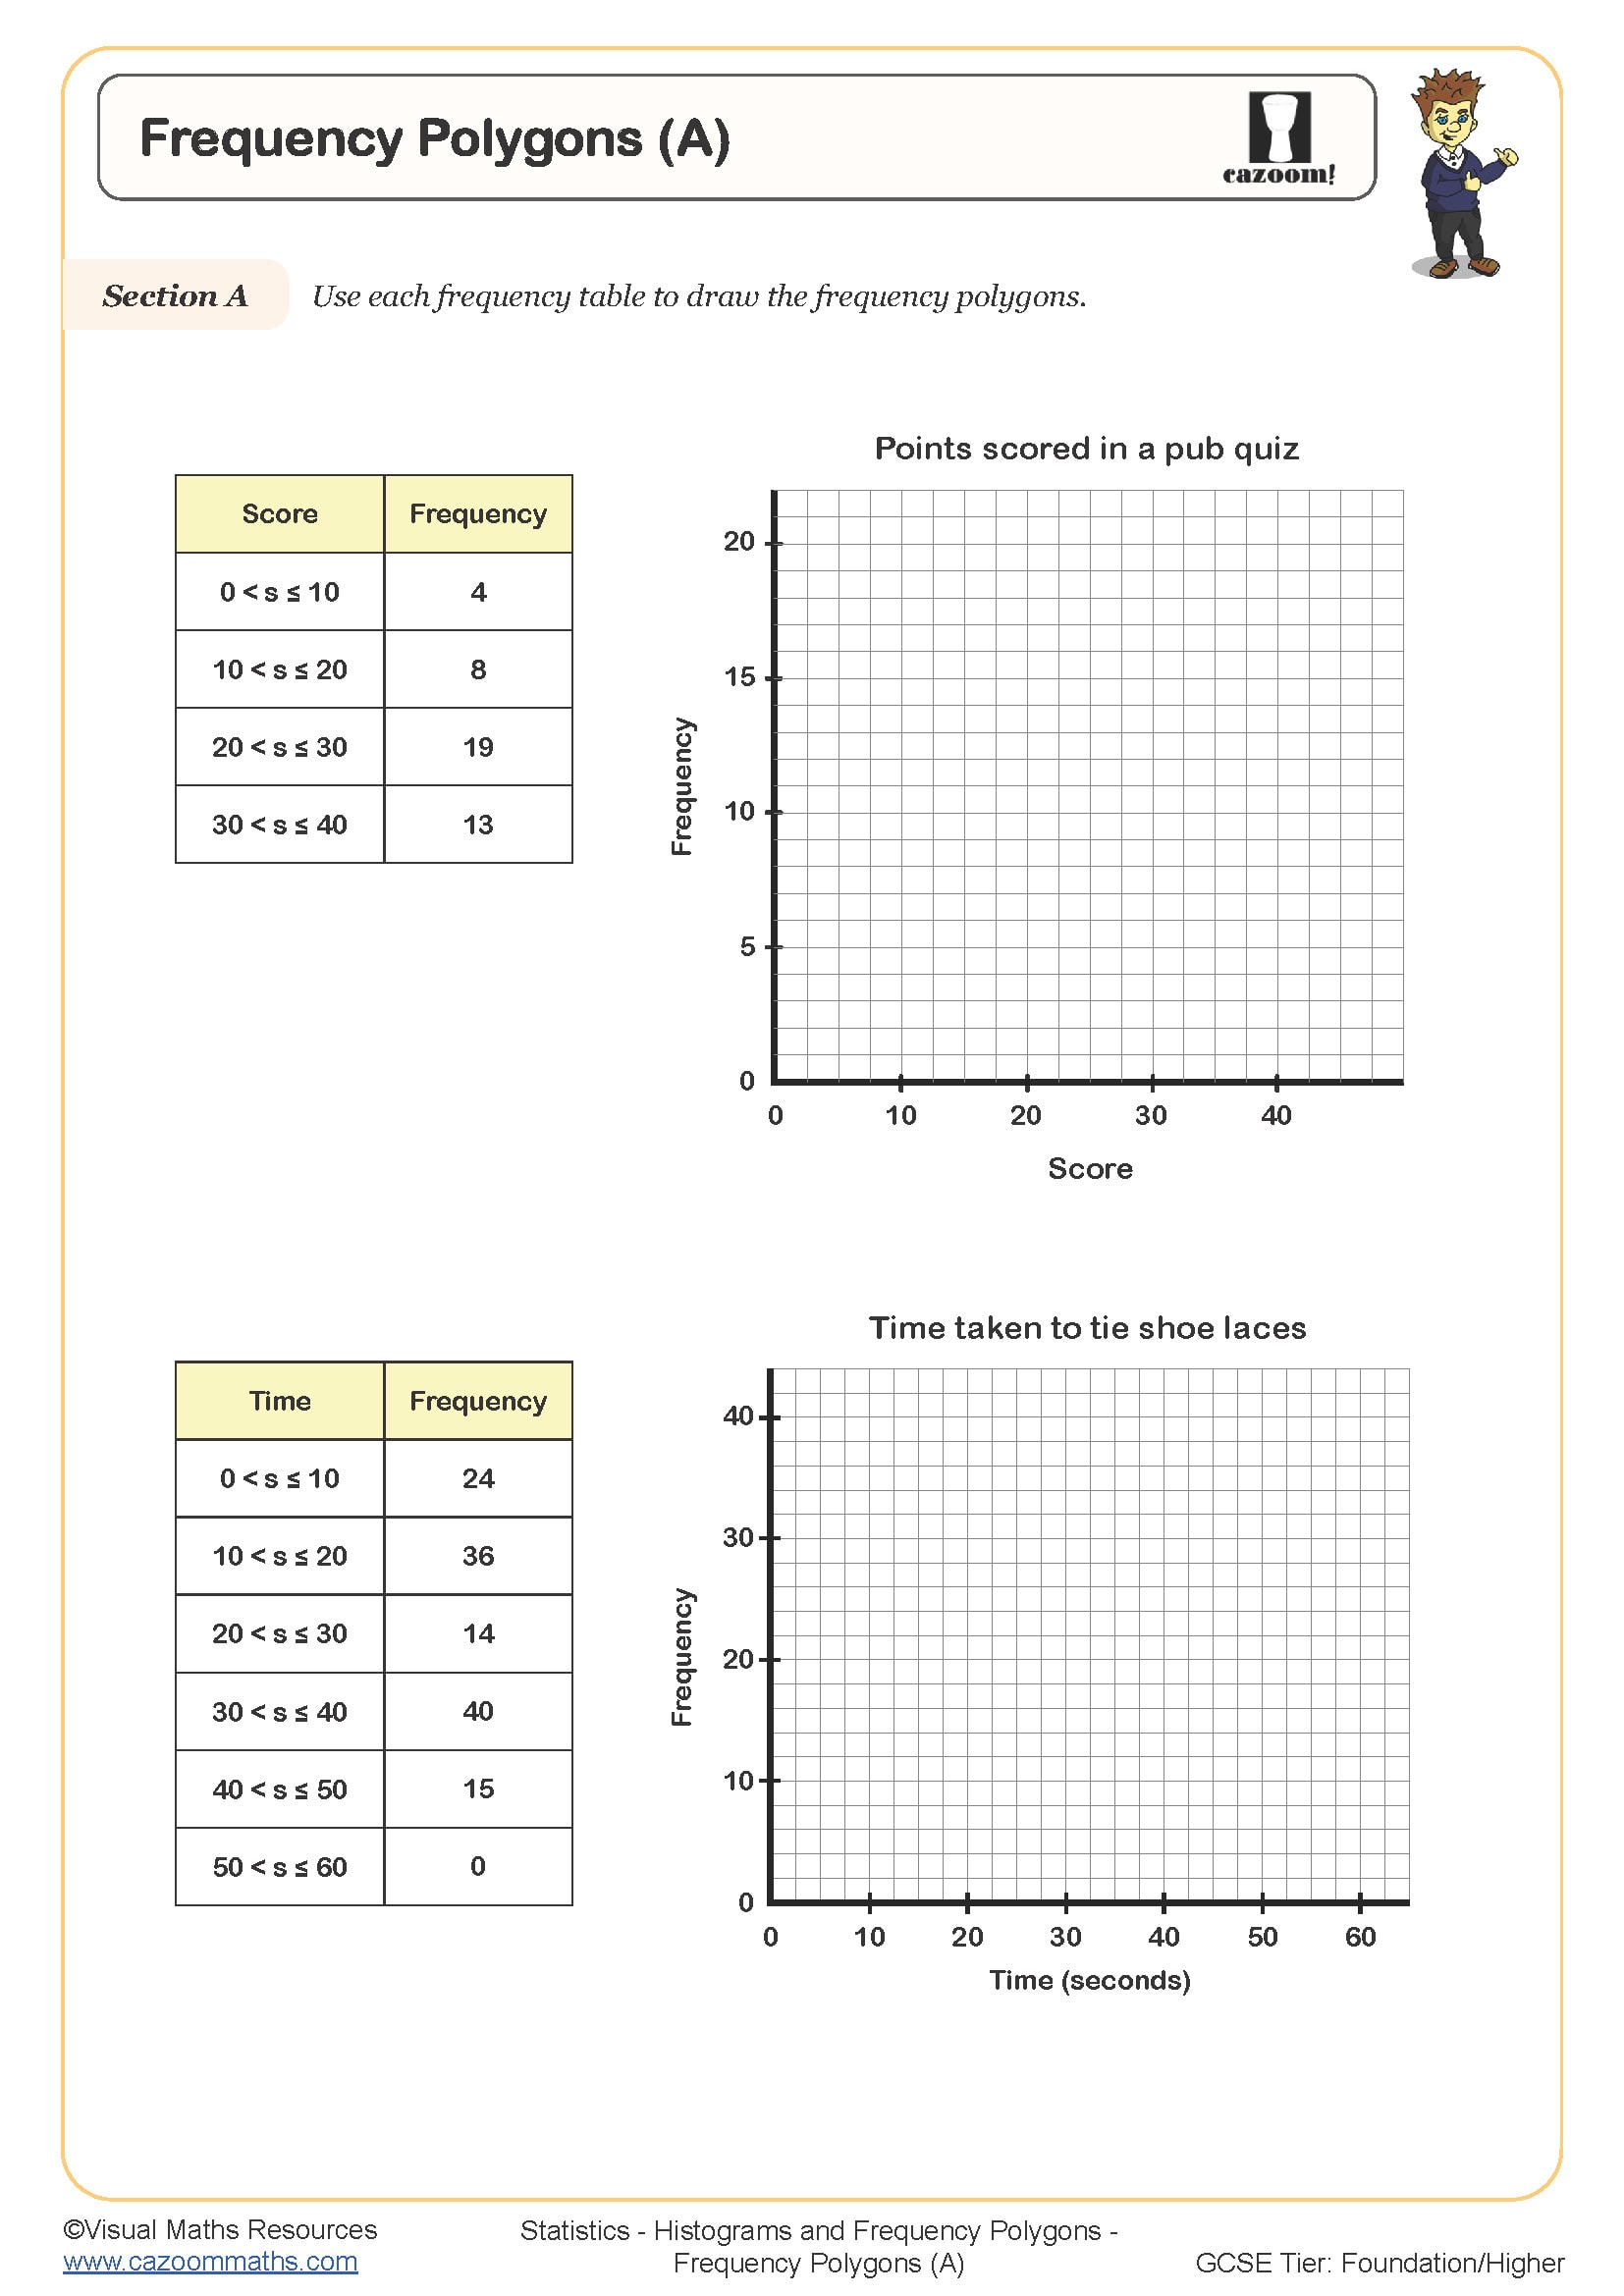
Frequency Polygons (A)
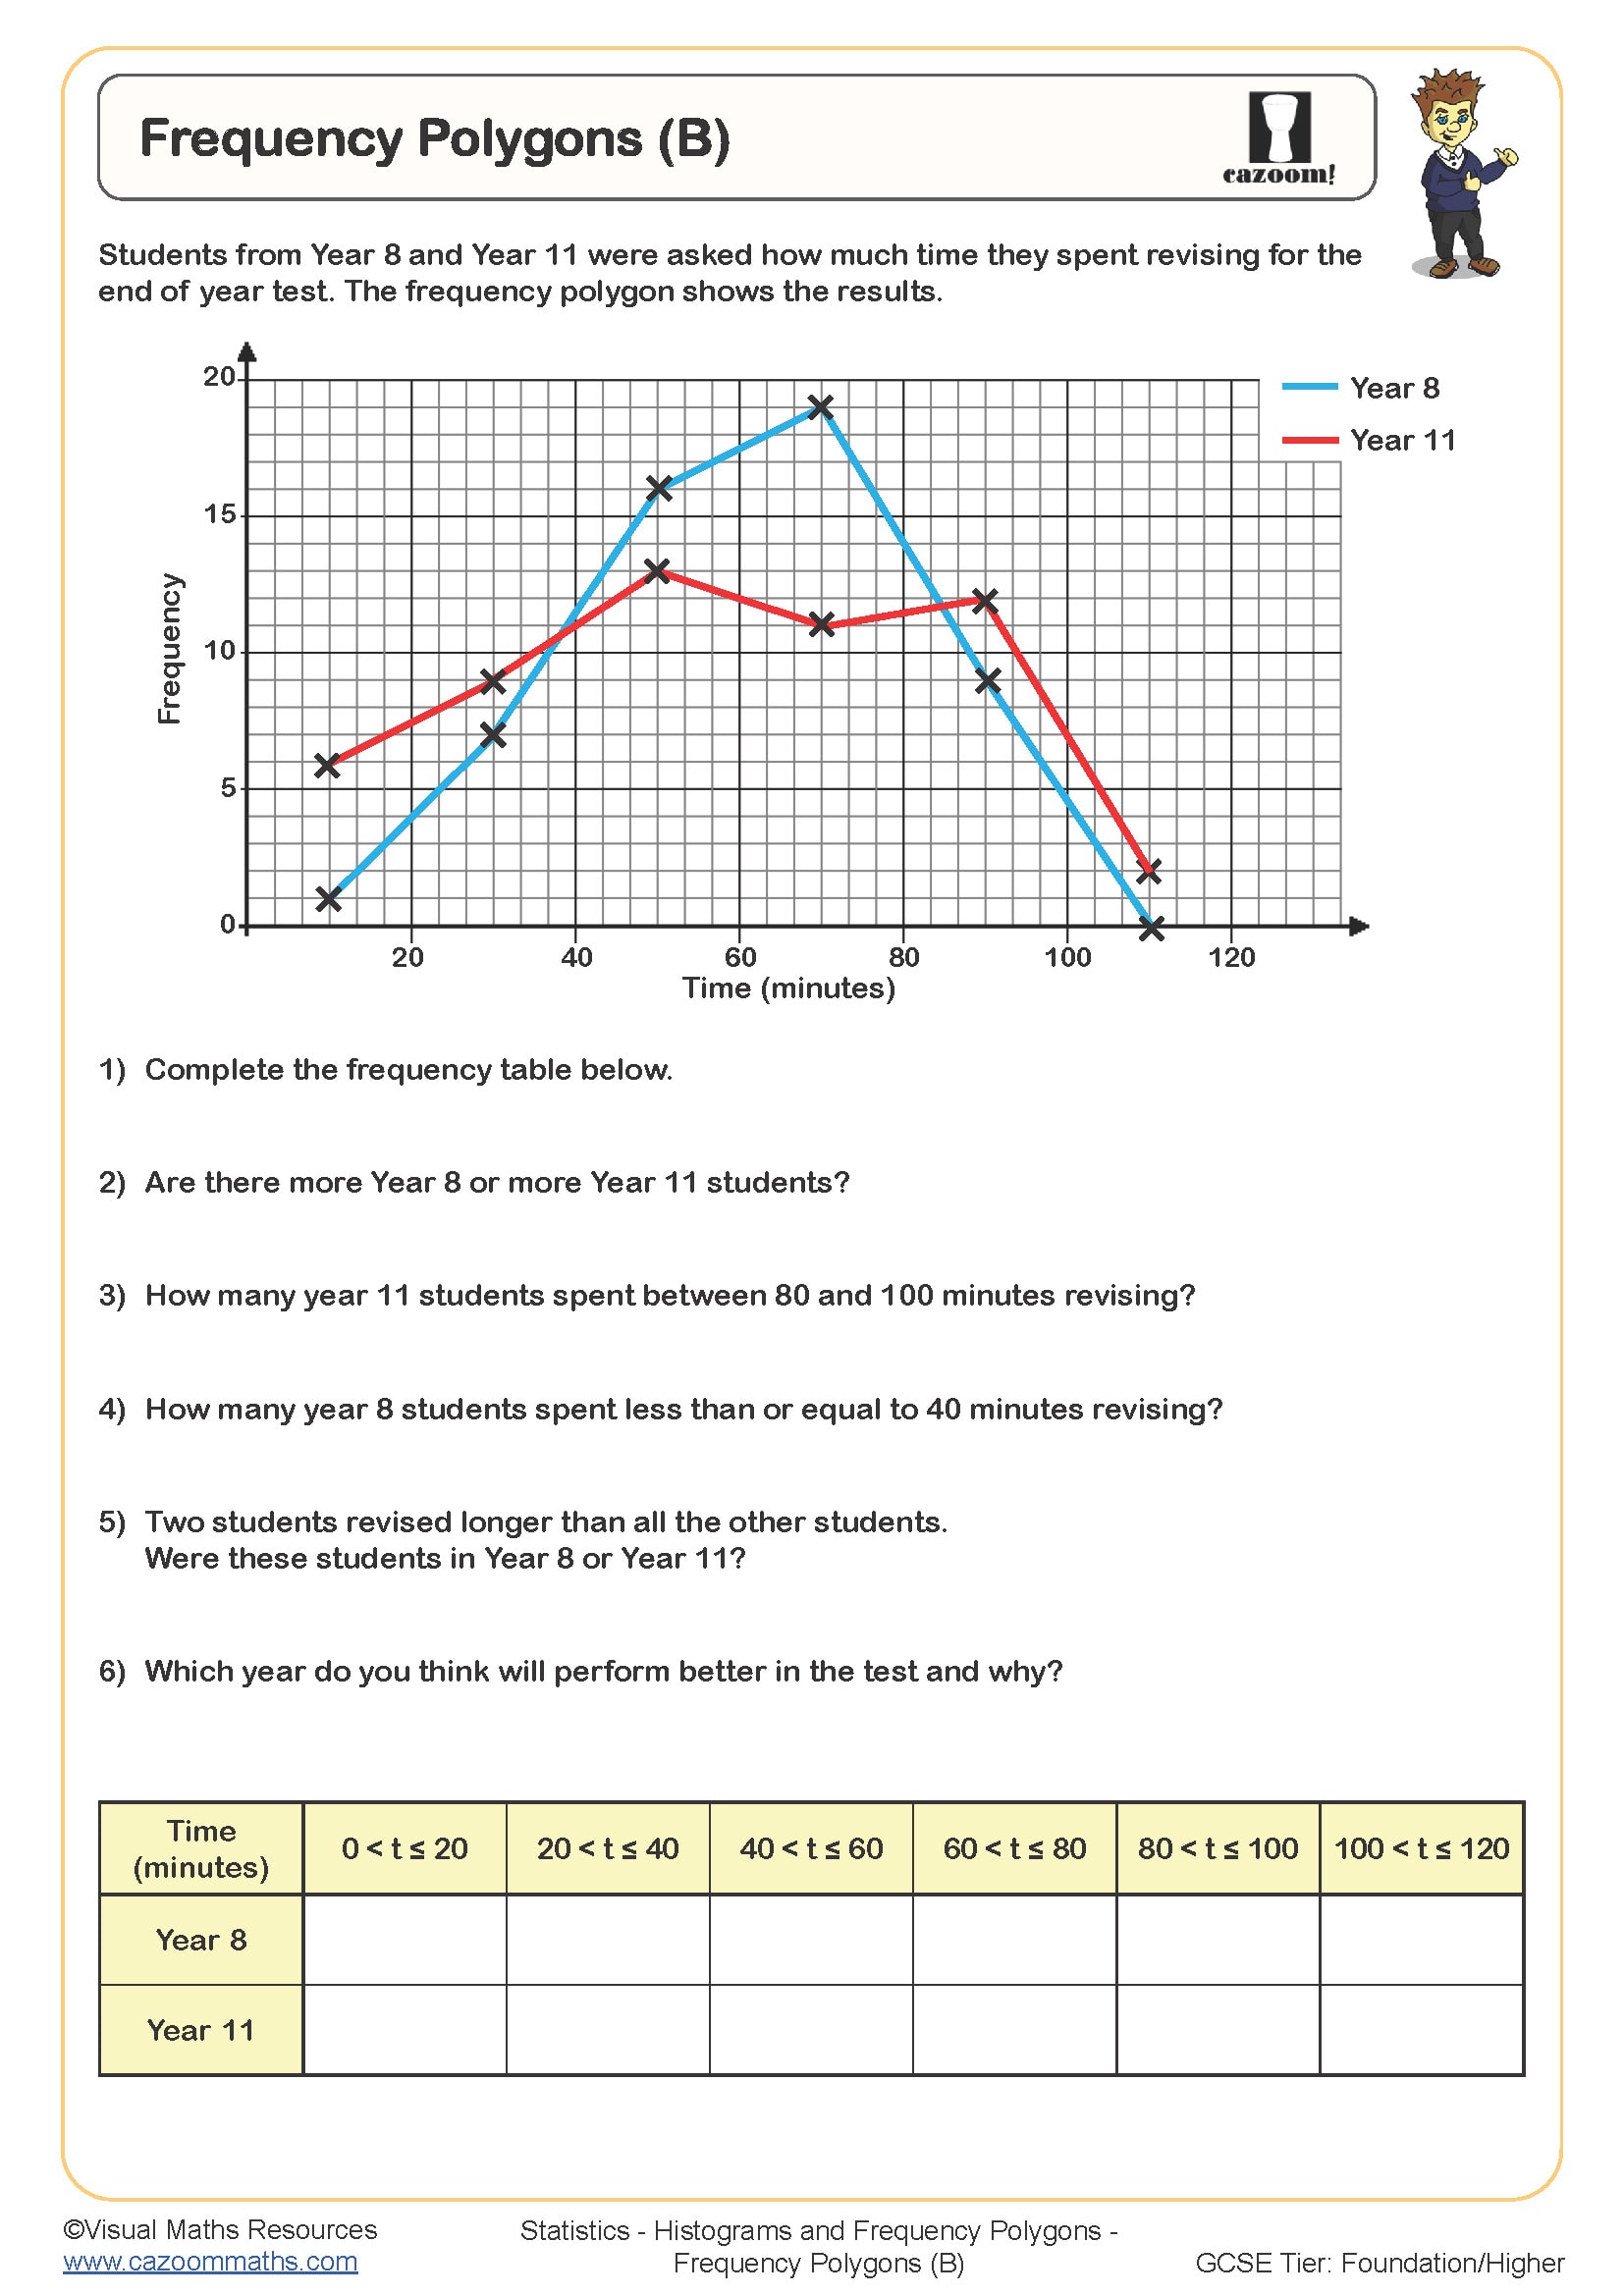
Frequency Polygons (B)
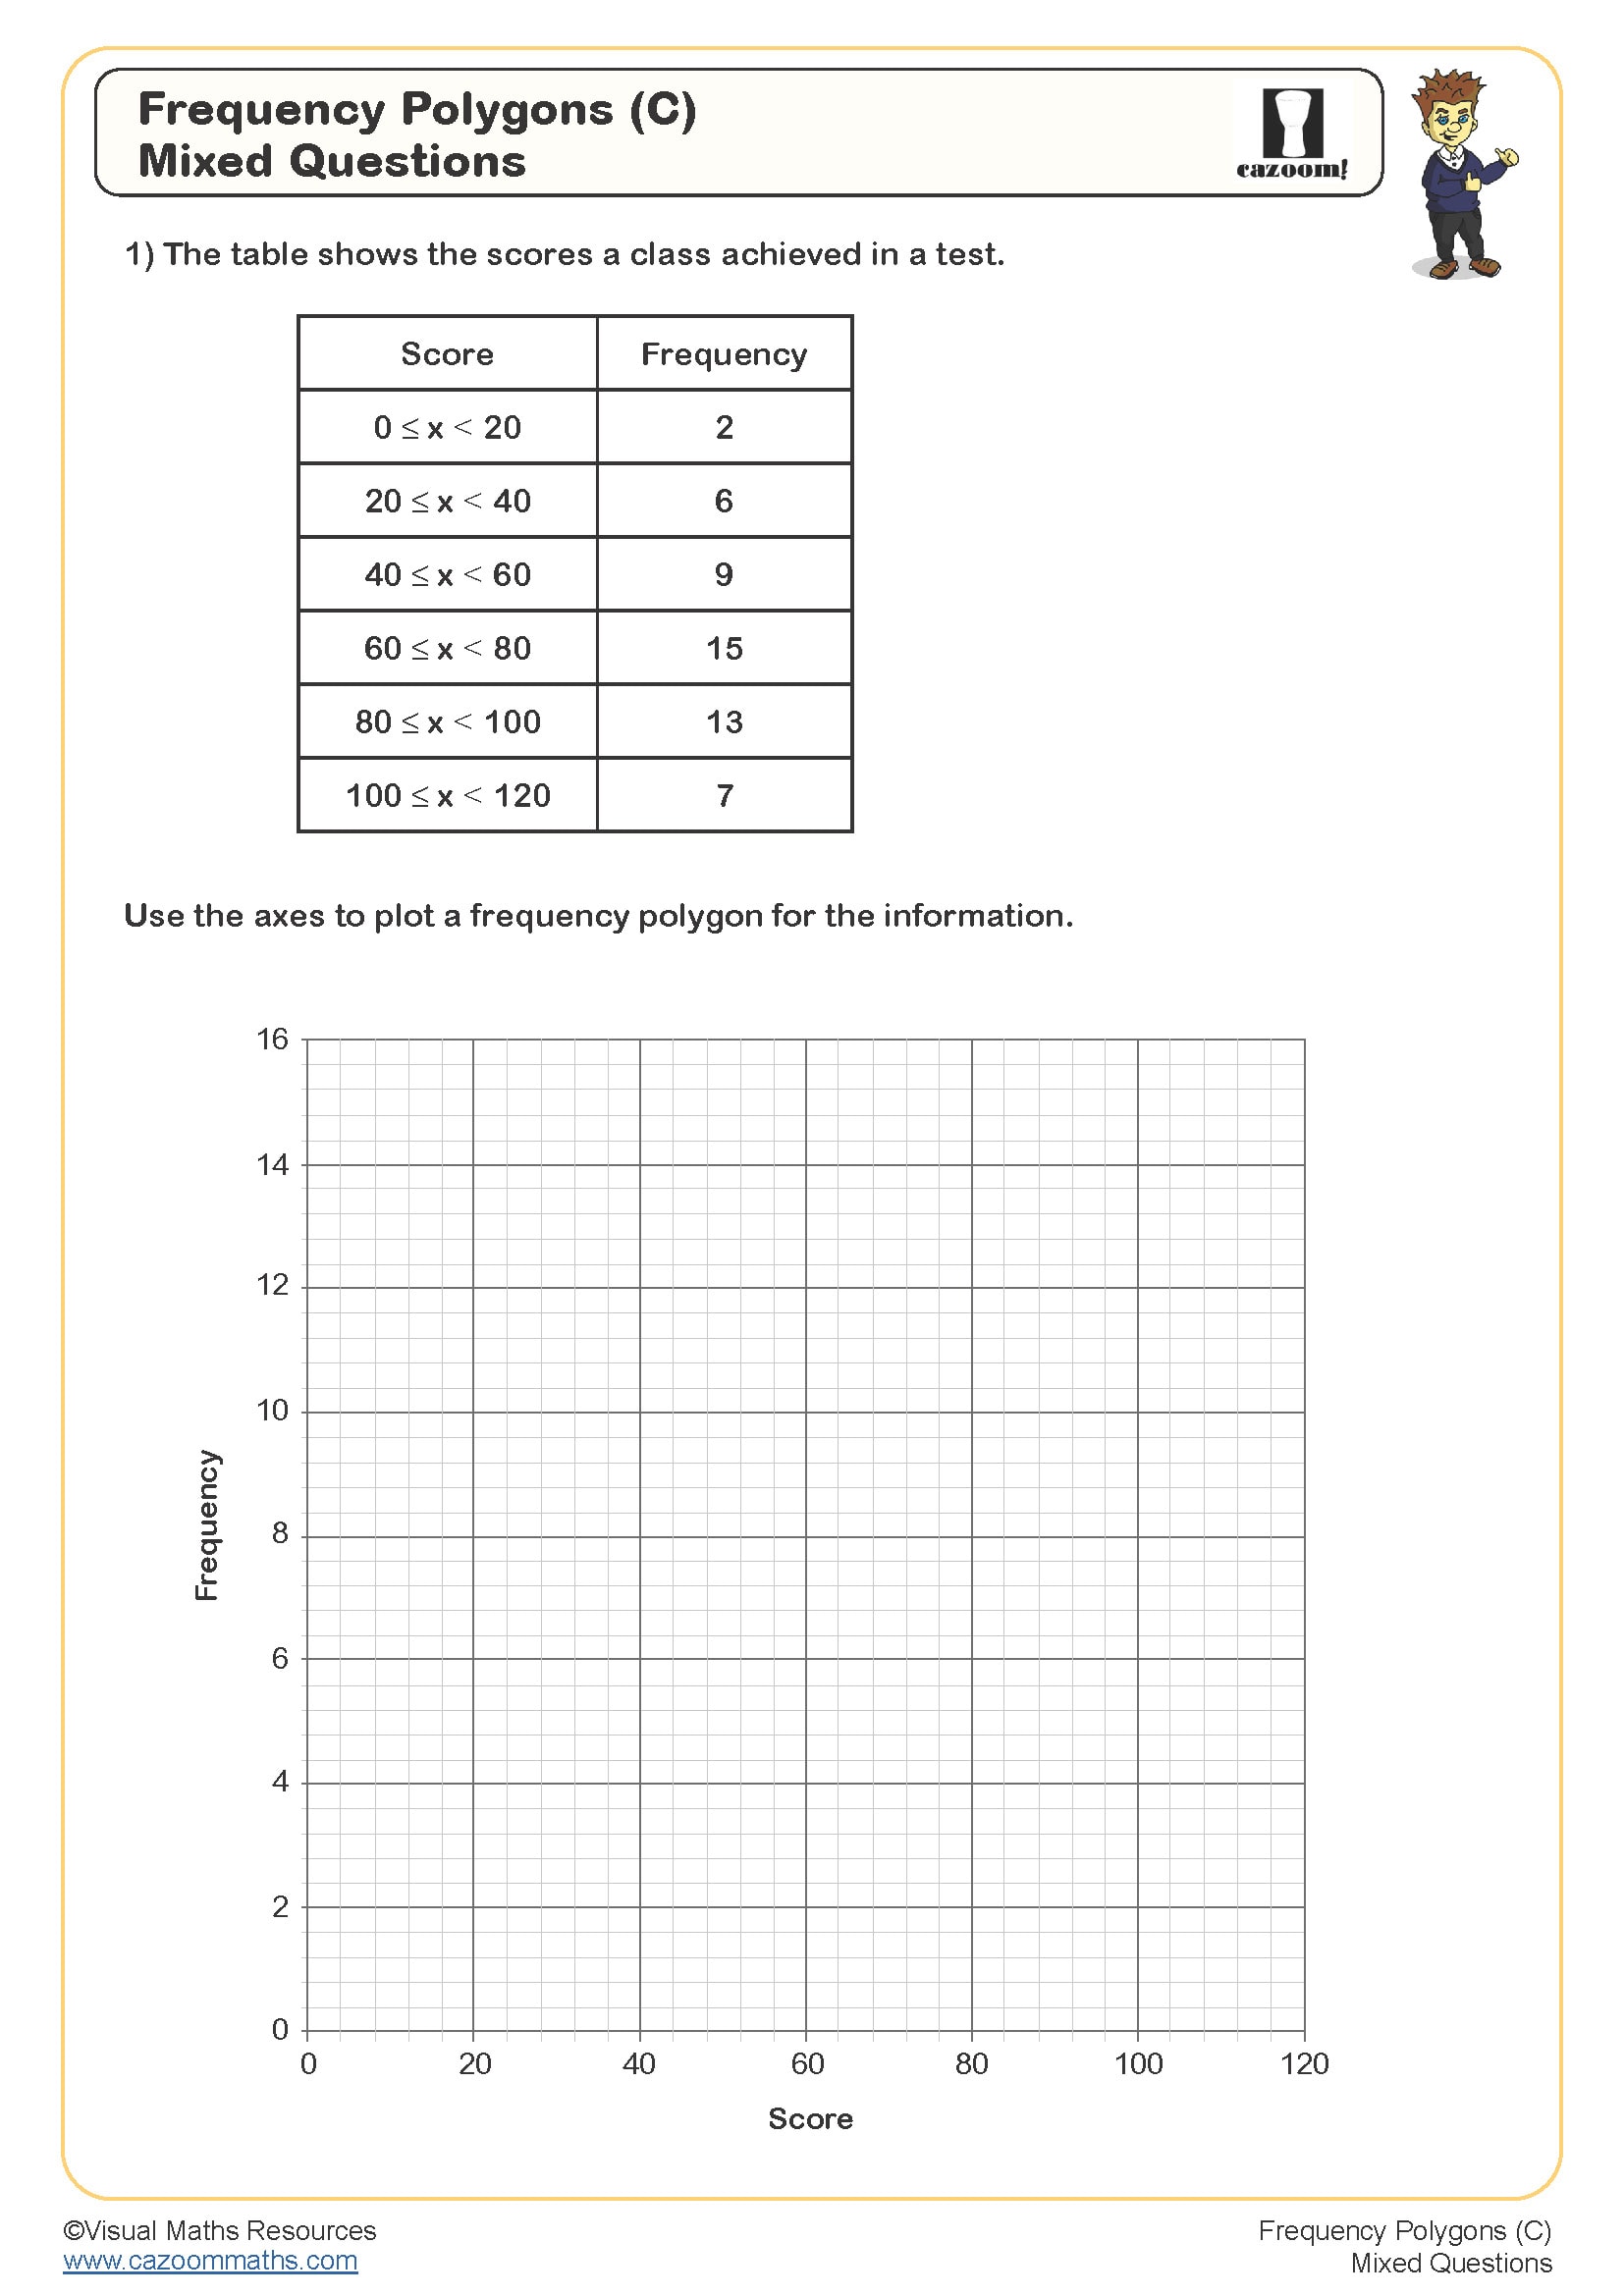
Frequency Polygons (C)
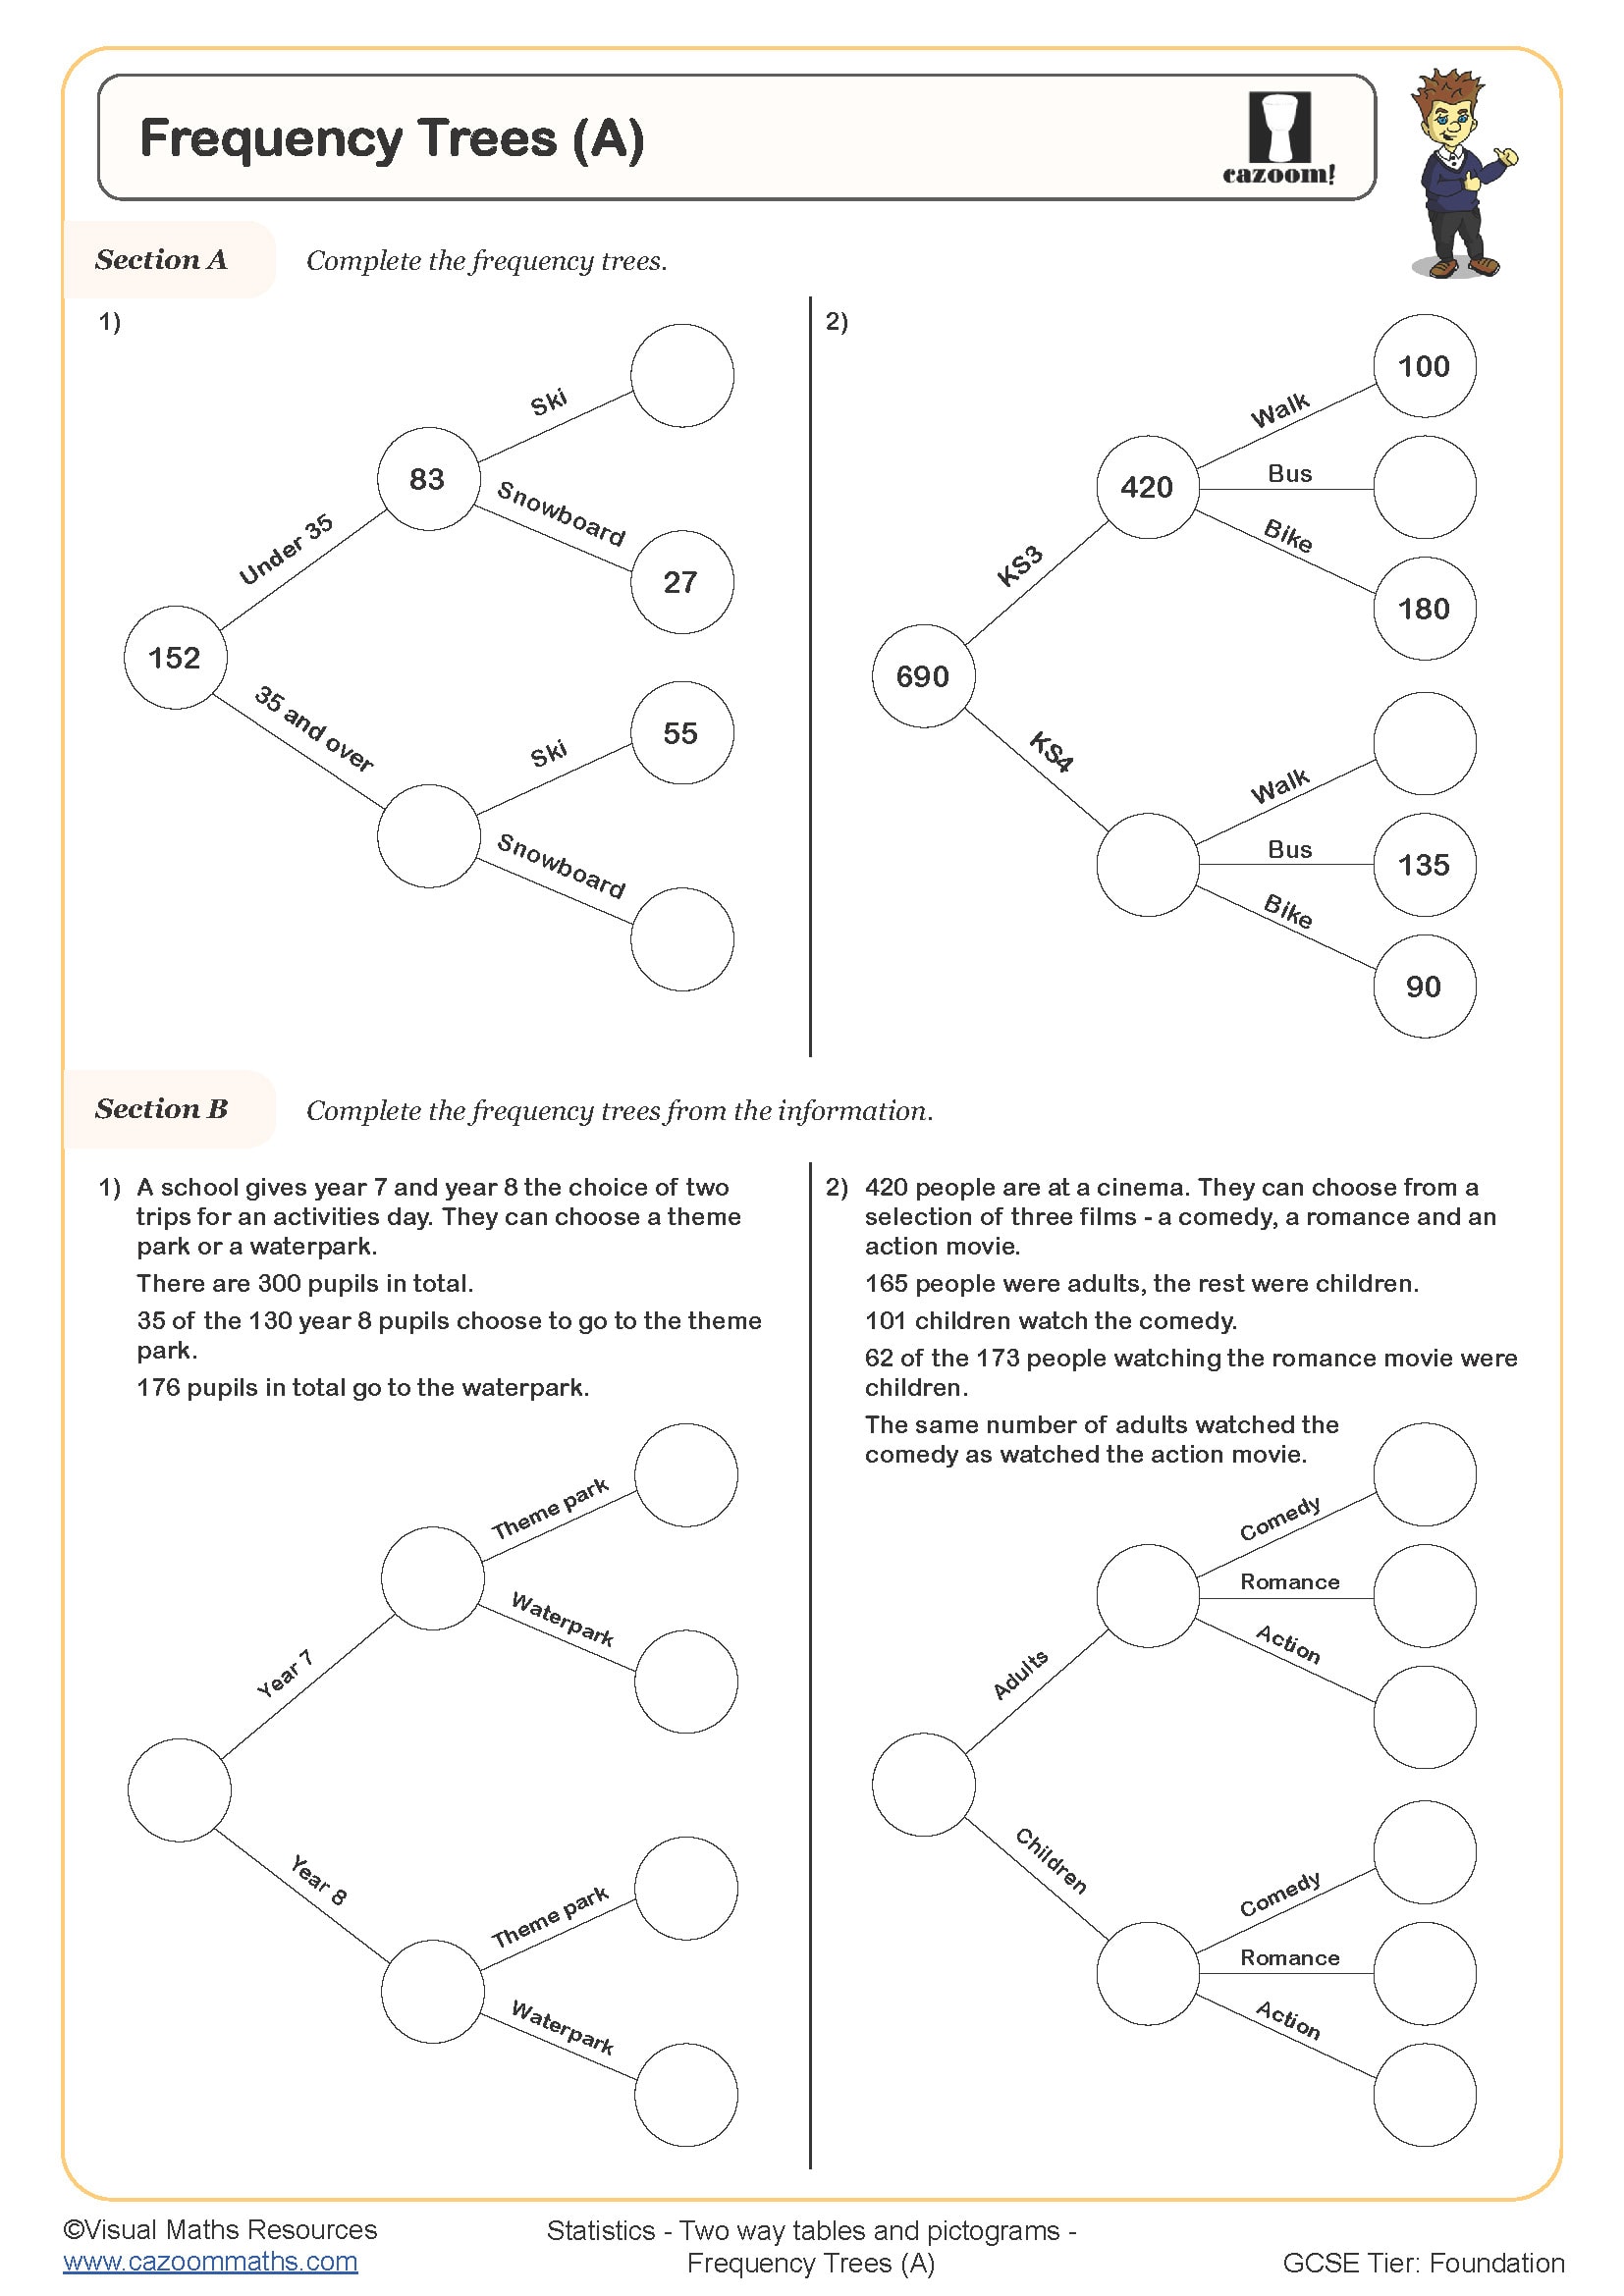
Frequency Trees (A)
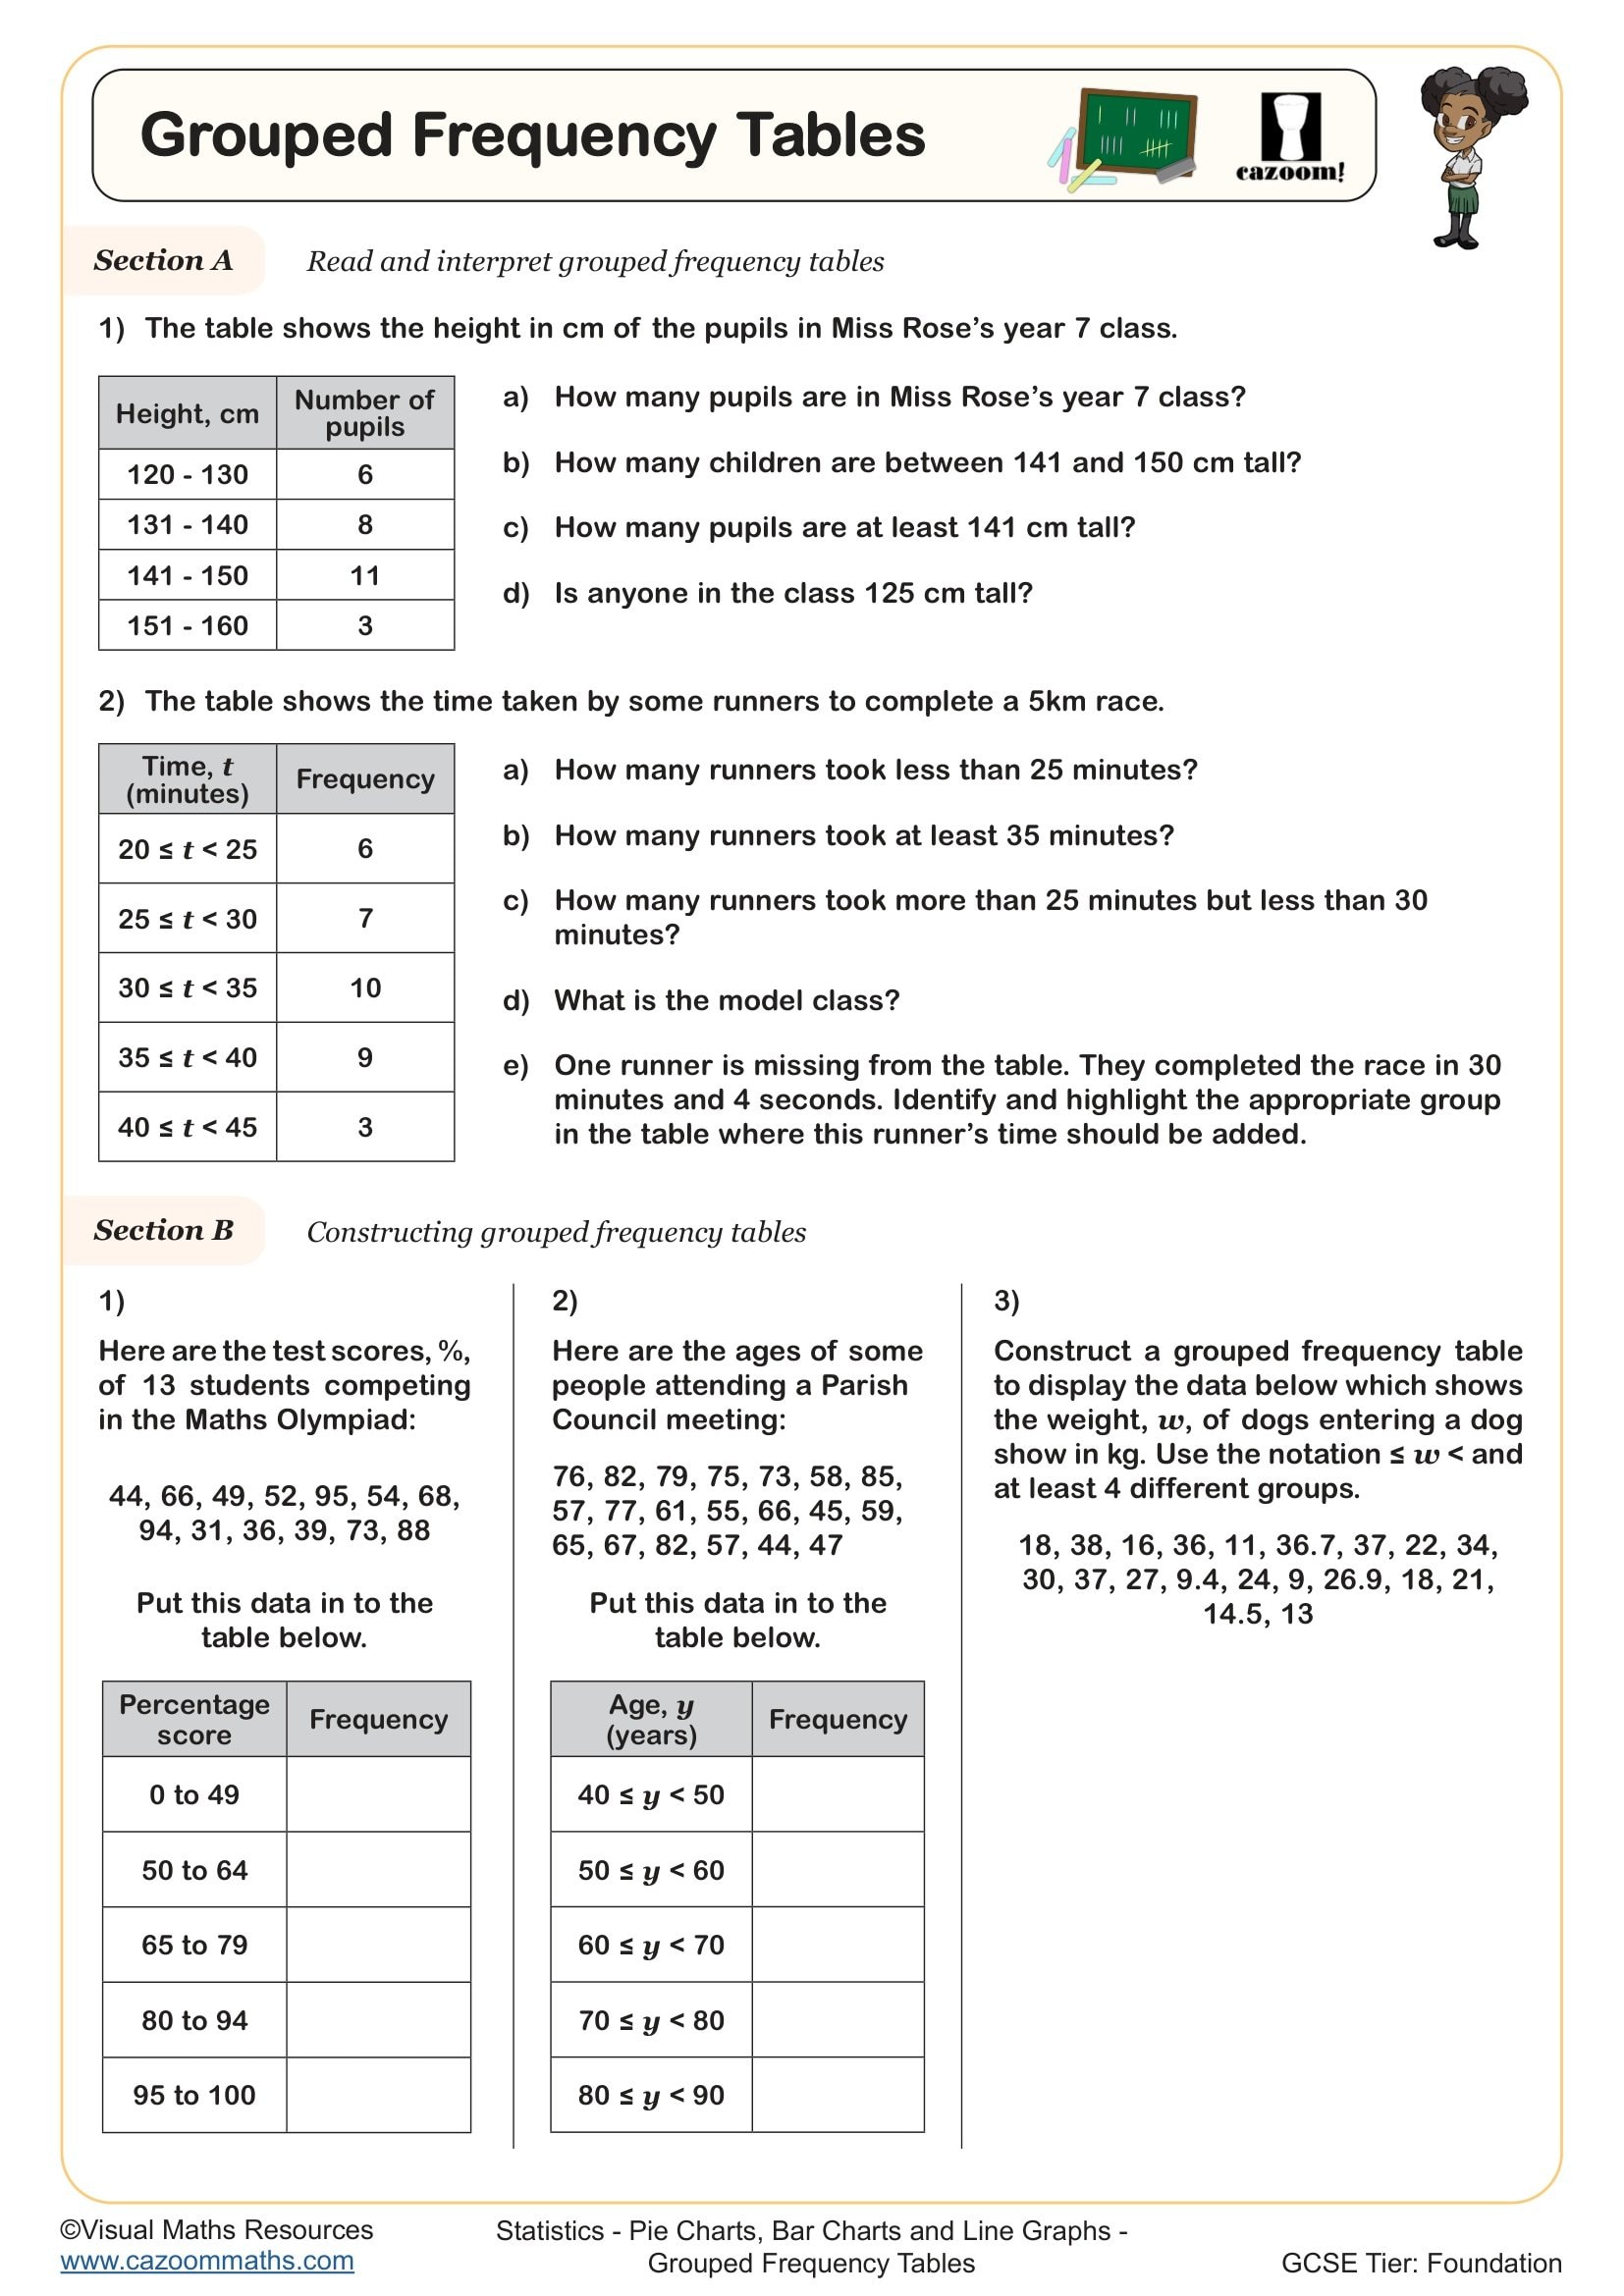
Grouped Frequency Tables
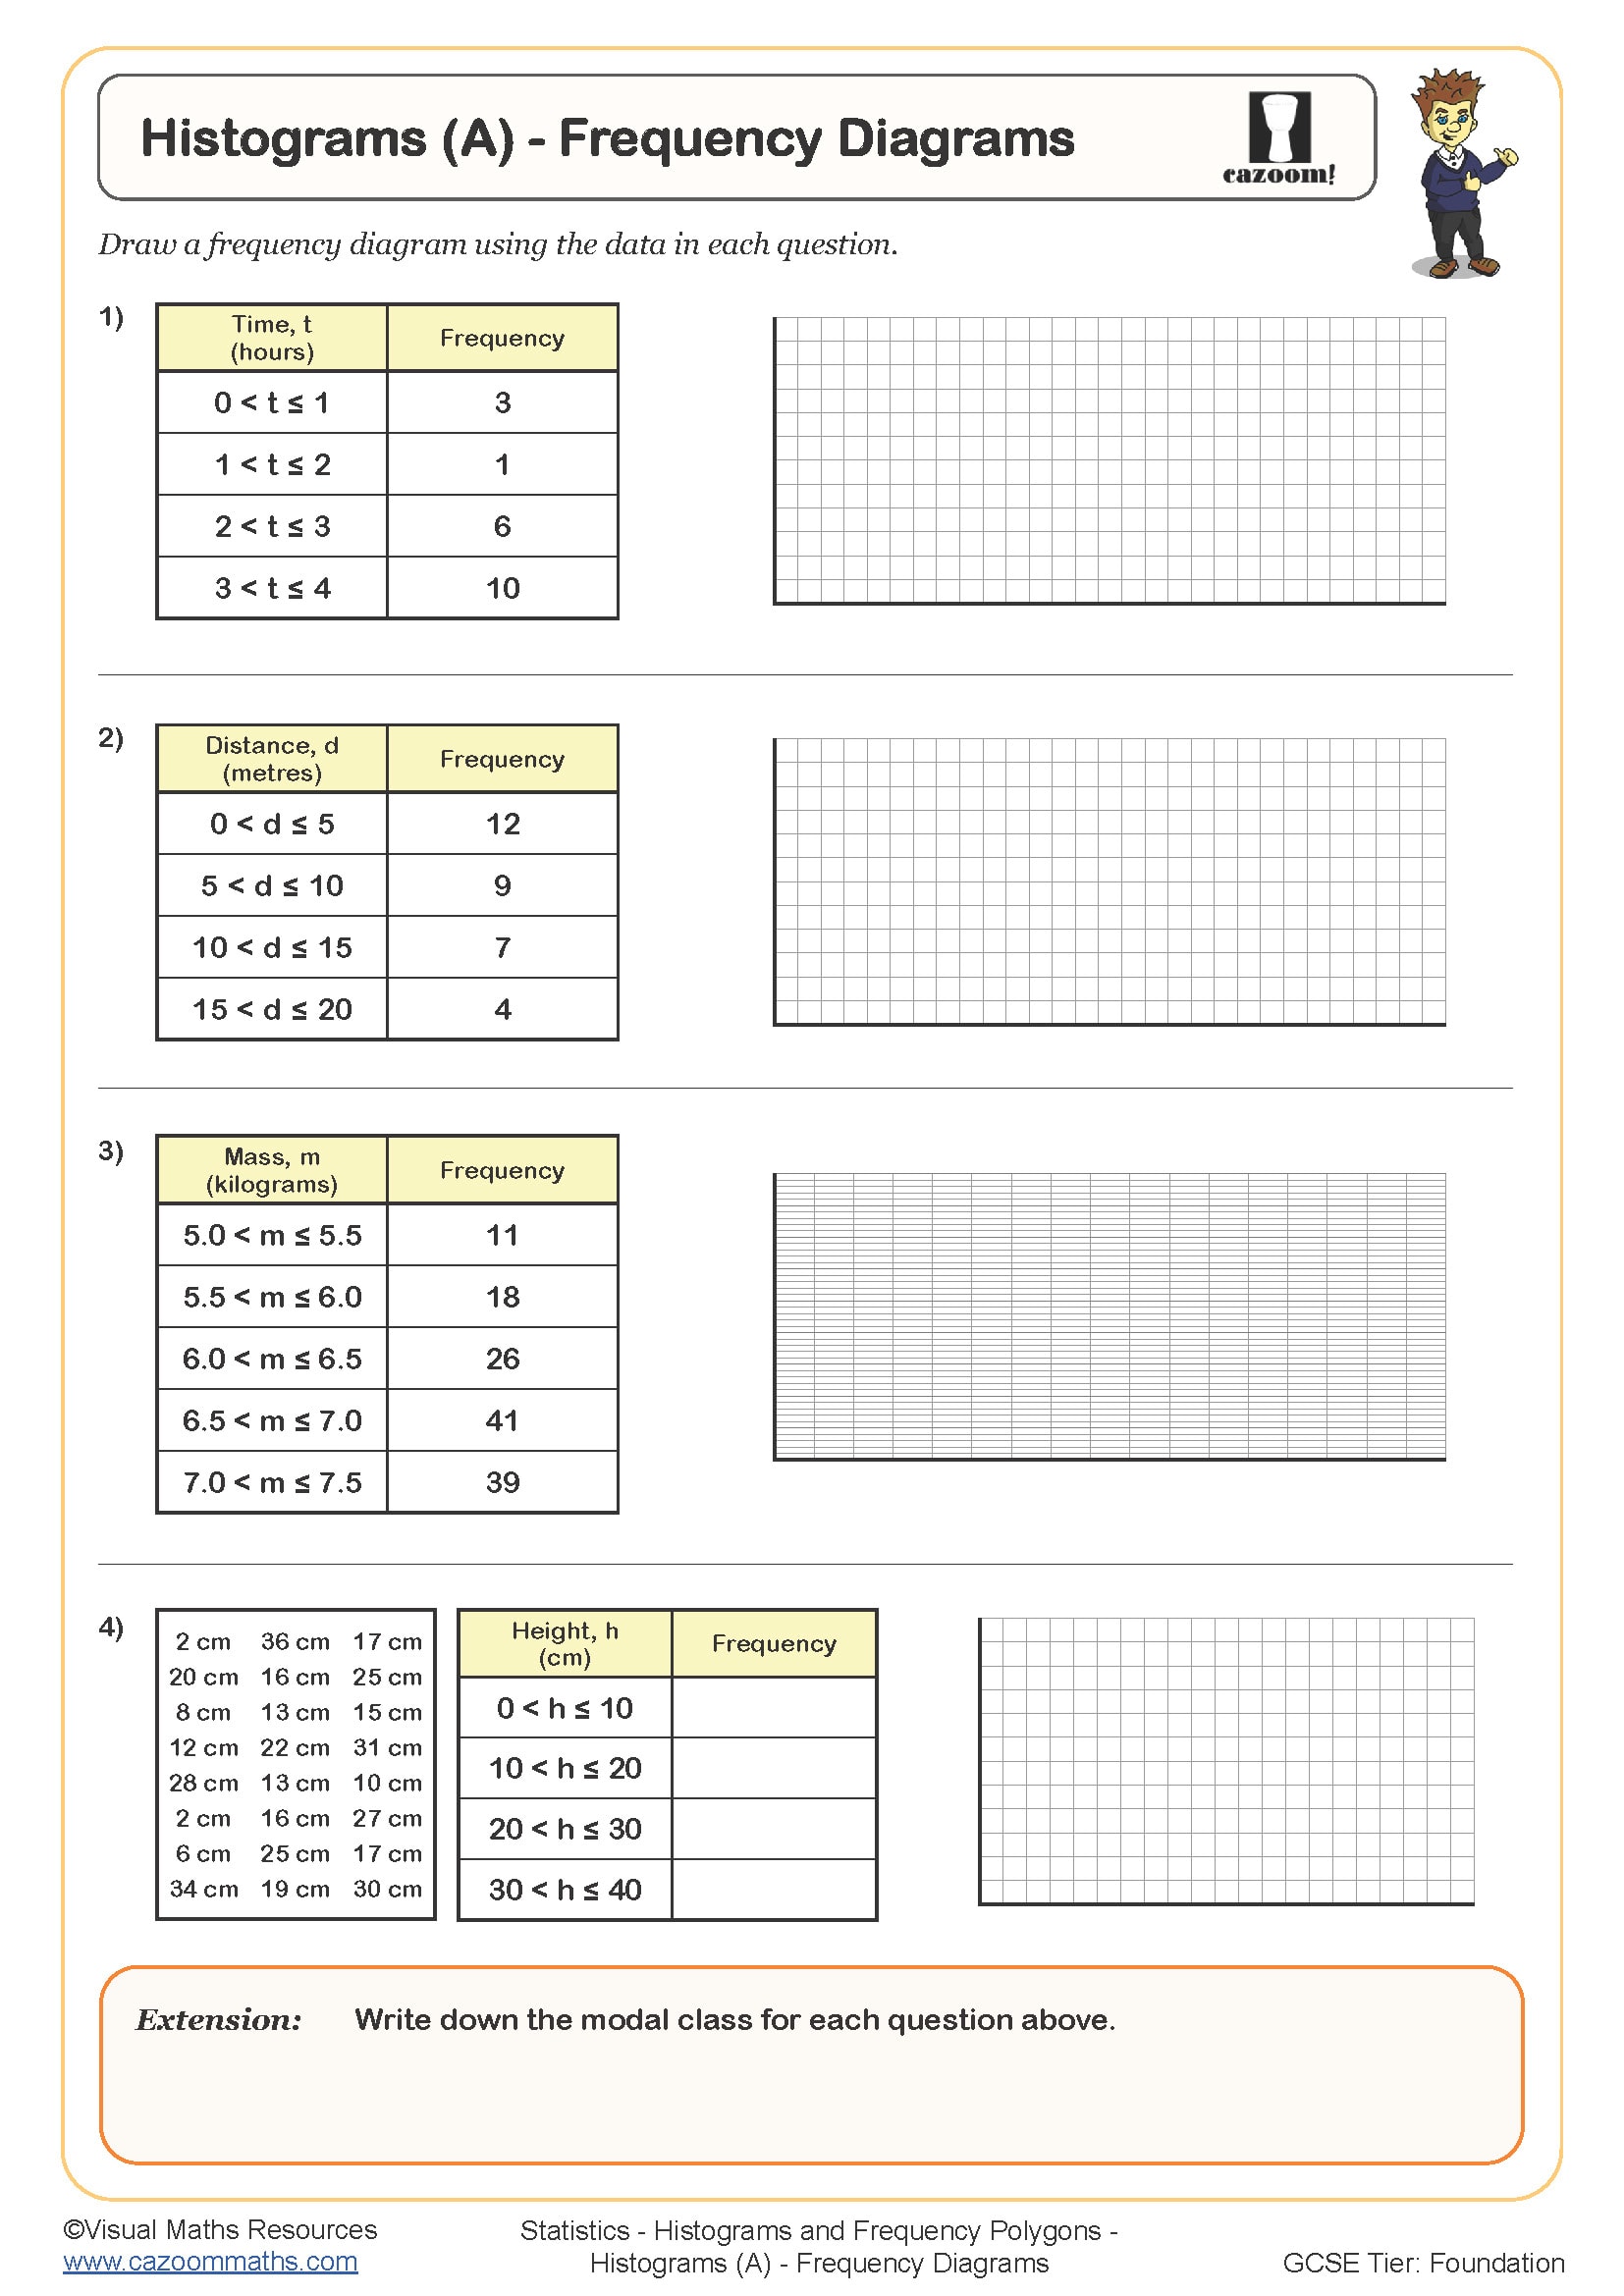
Histograms (A) - Frequency Diagrams
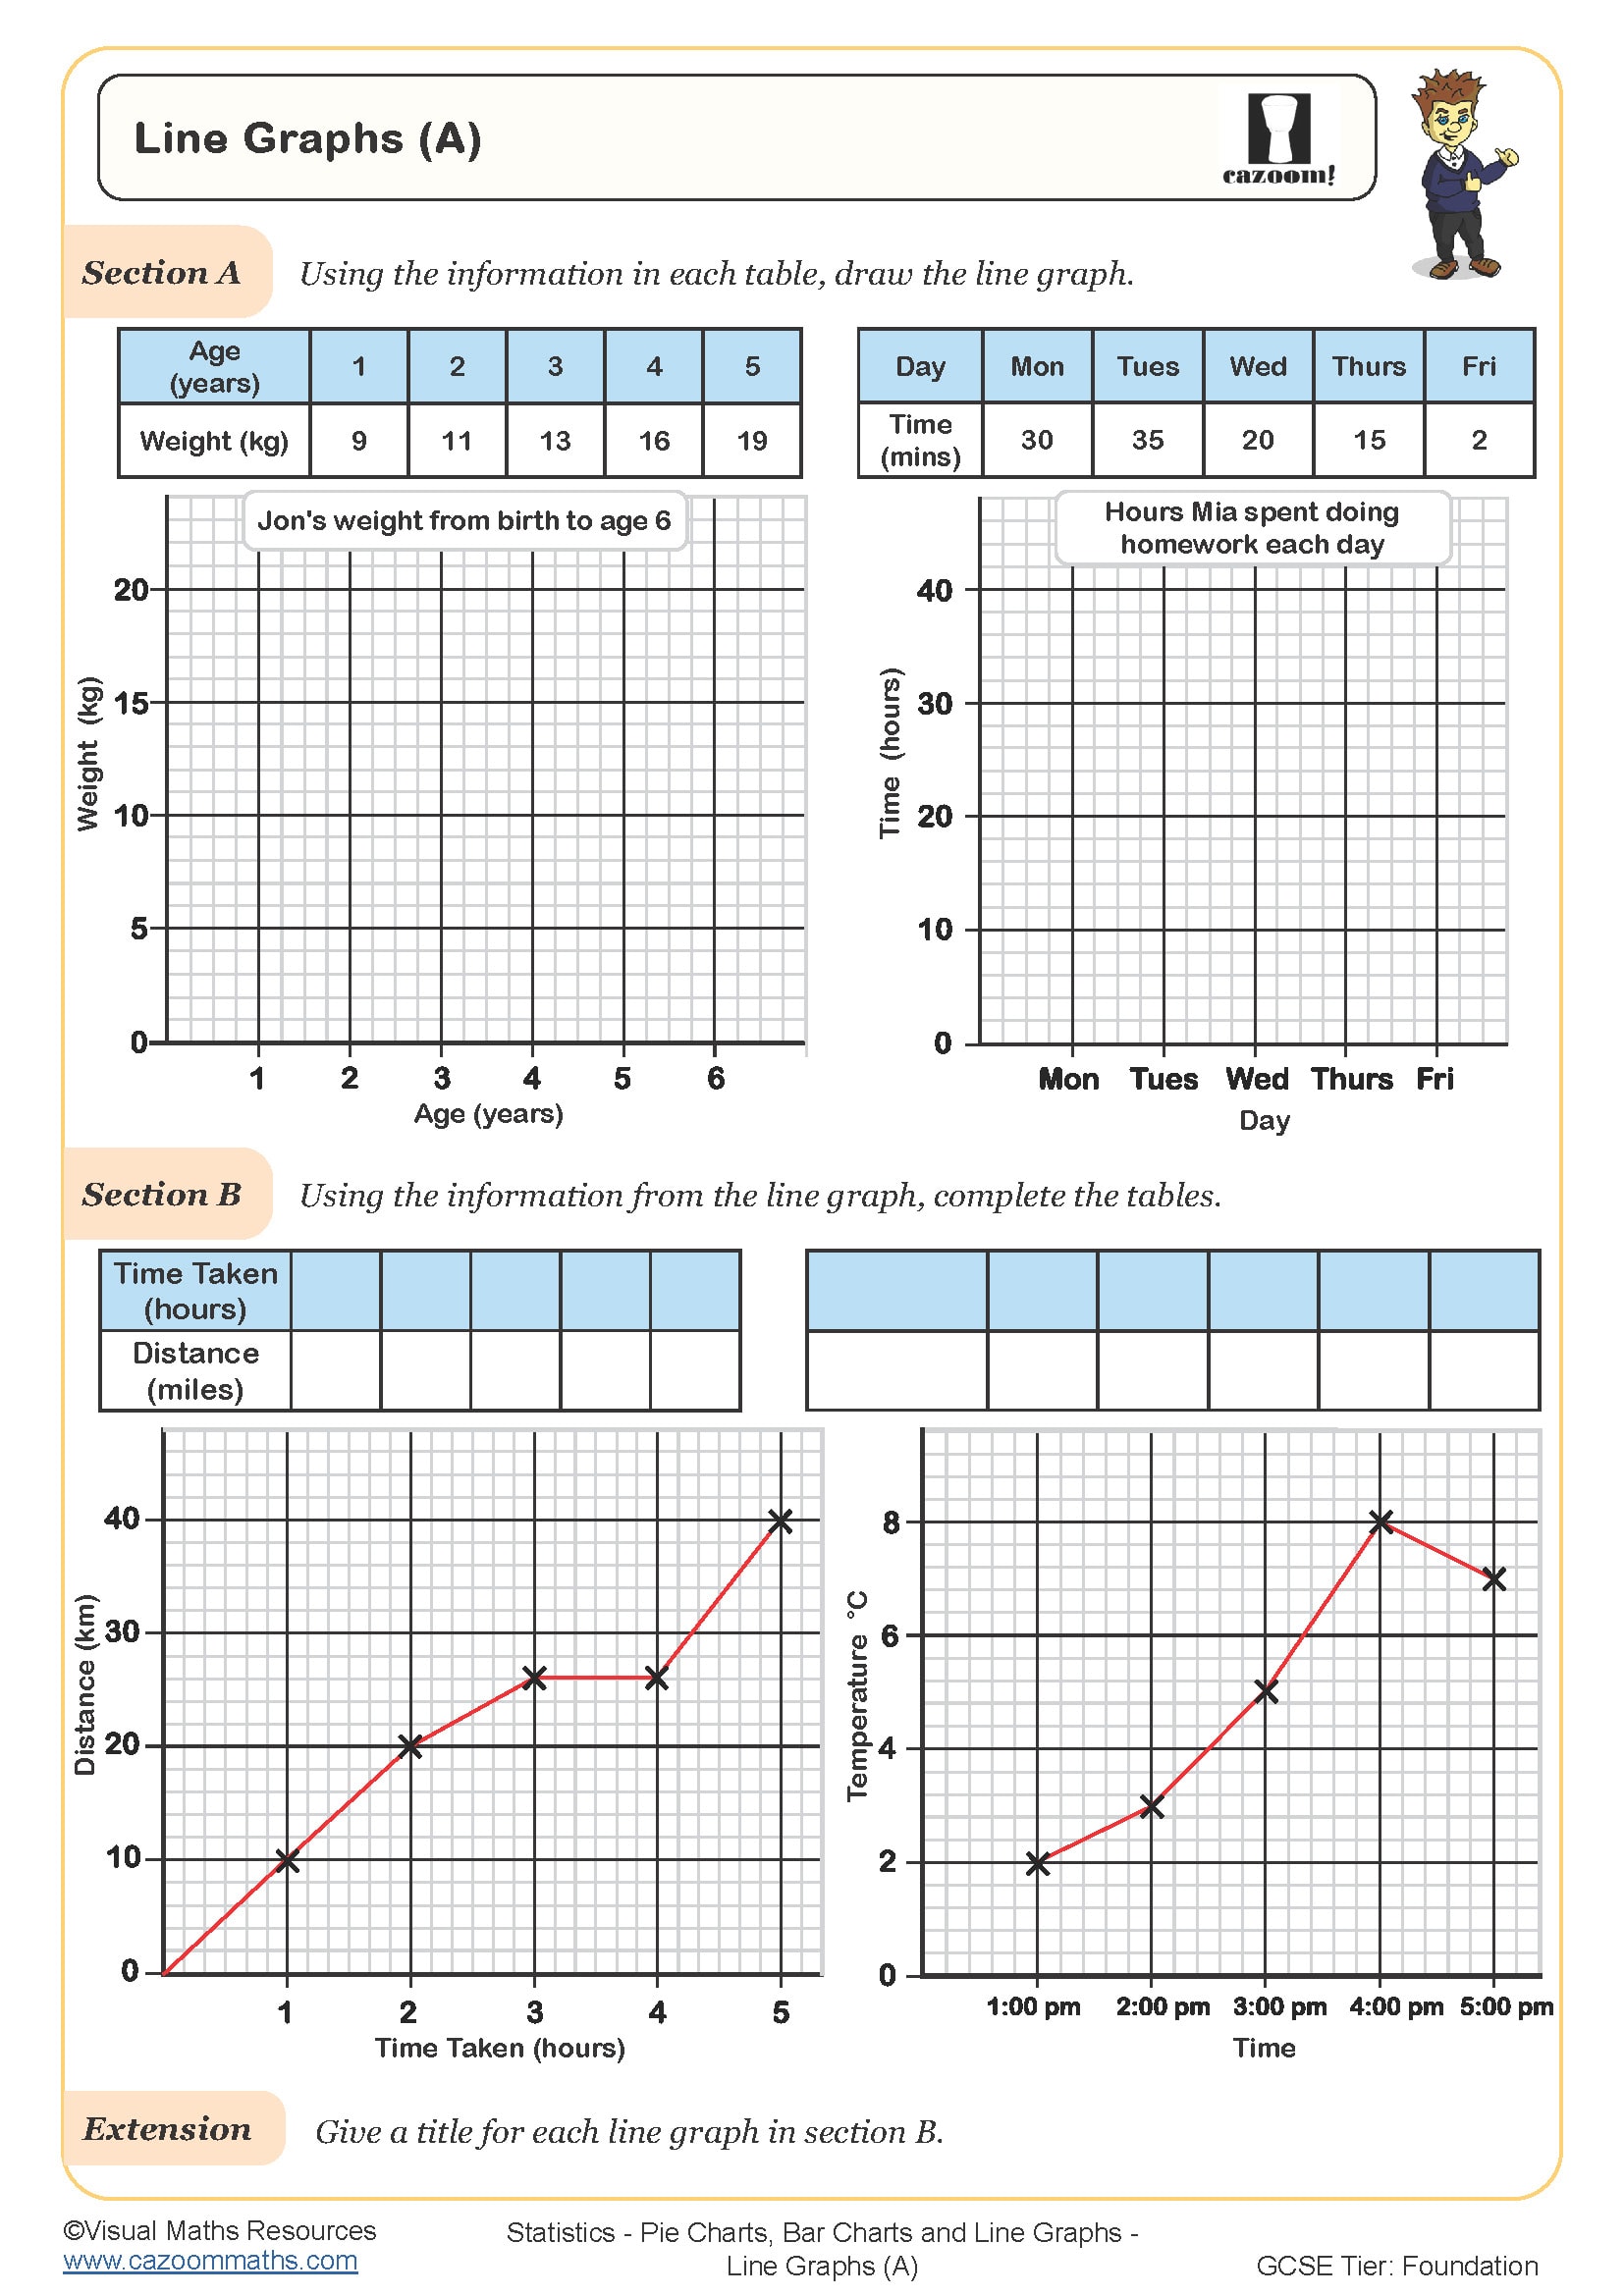
Line Graphs (A)
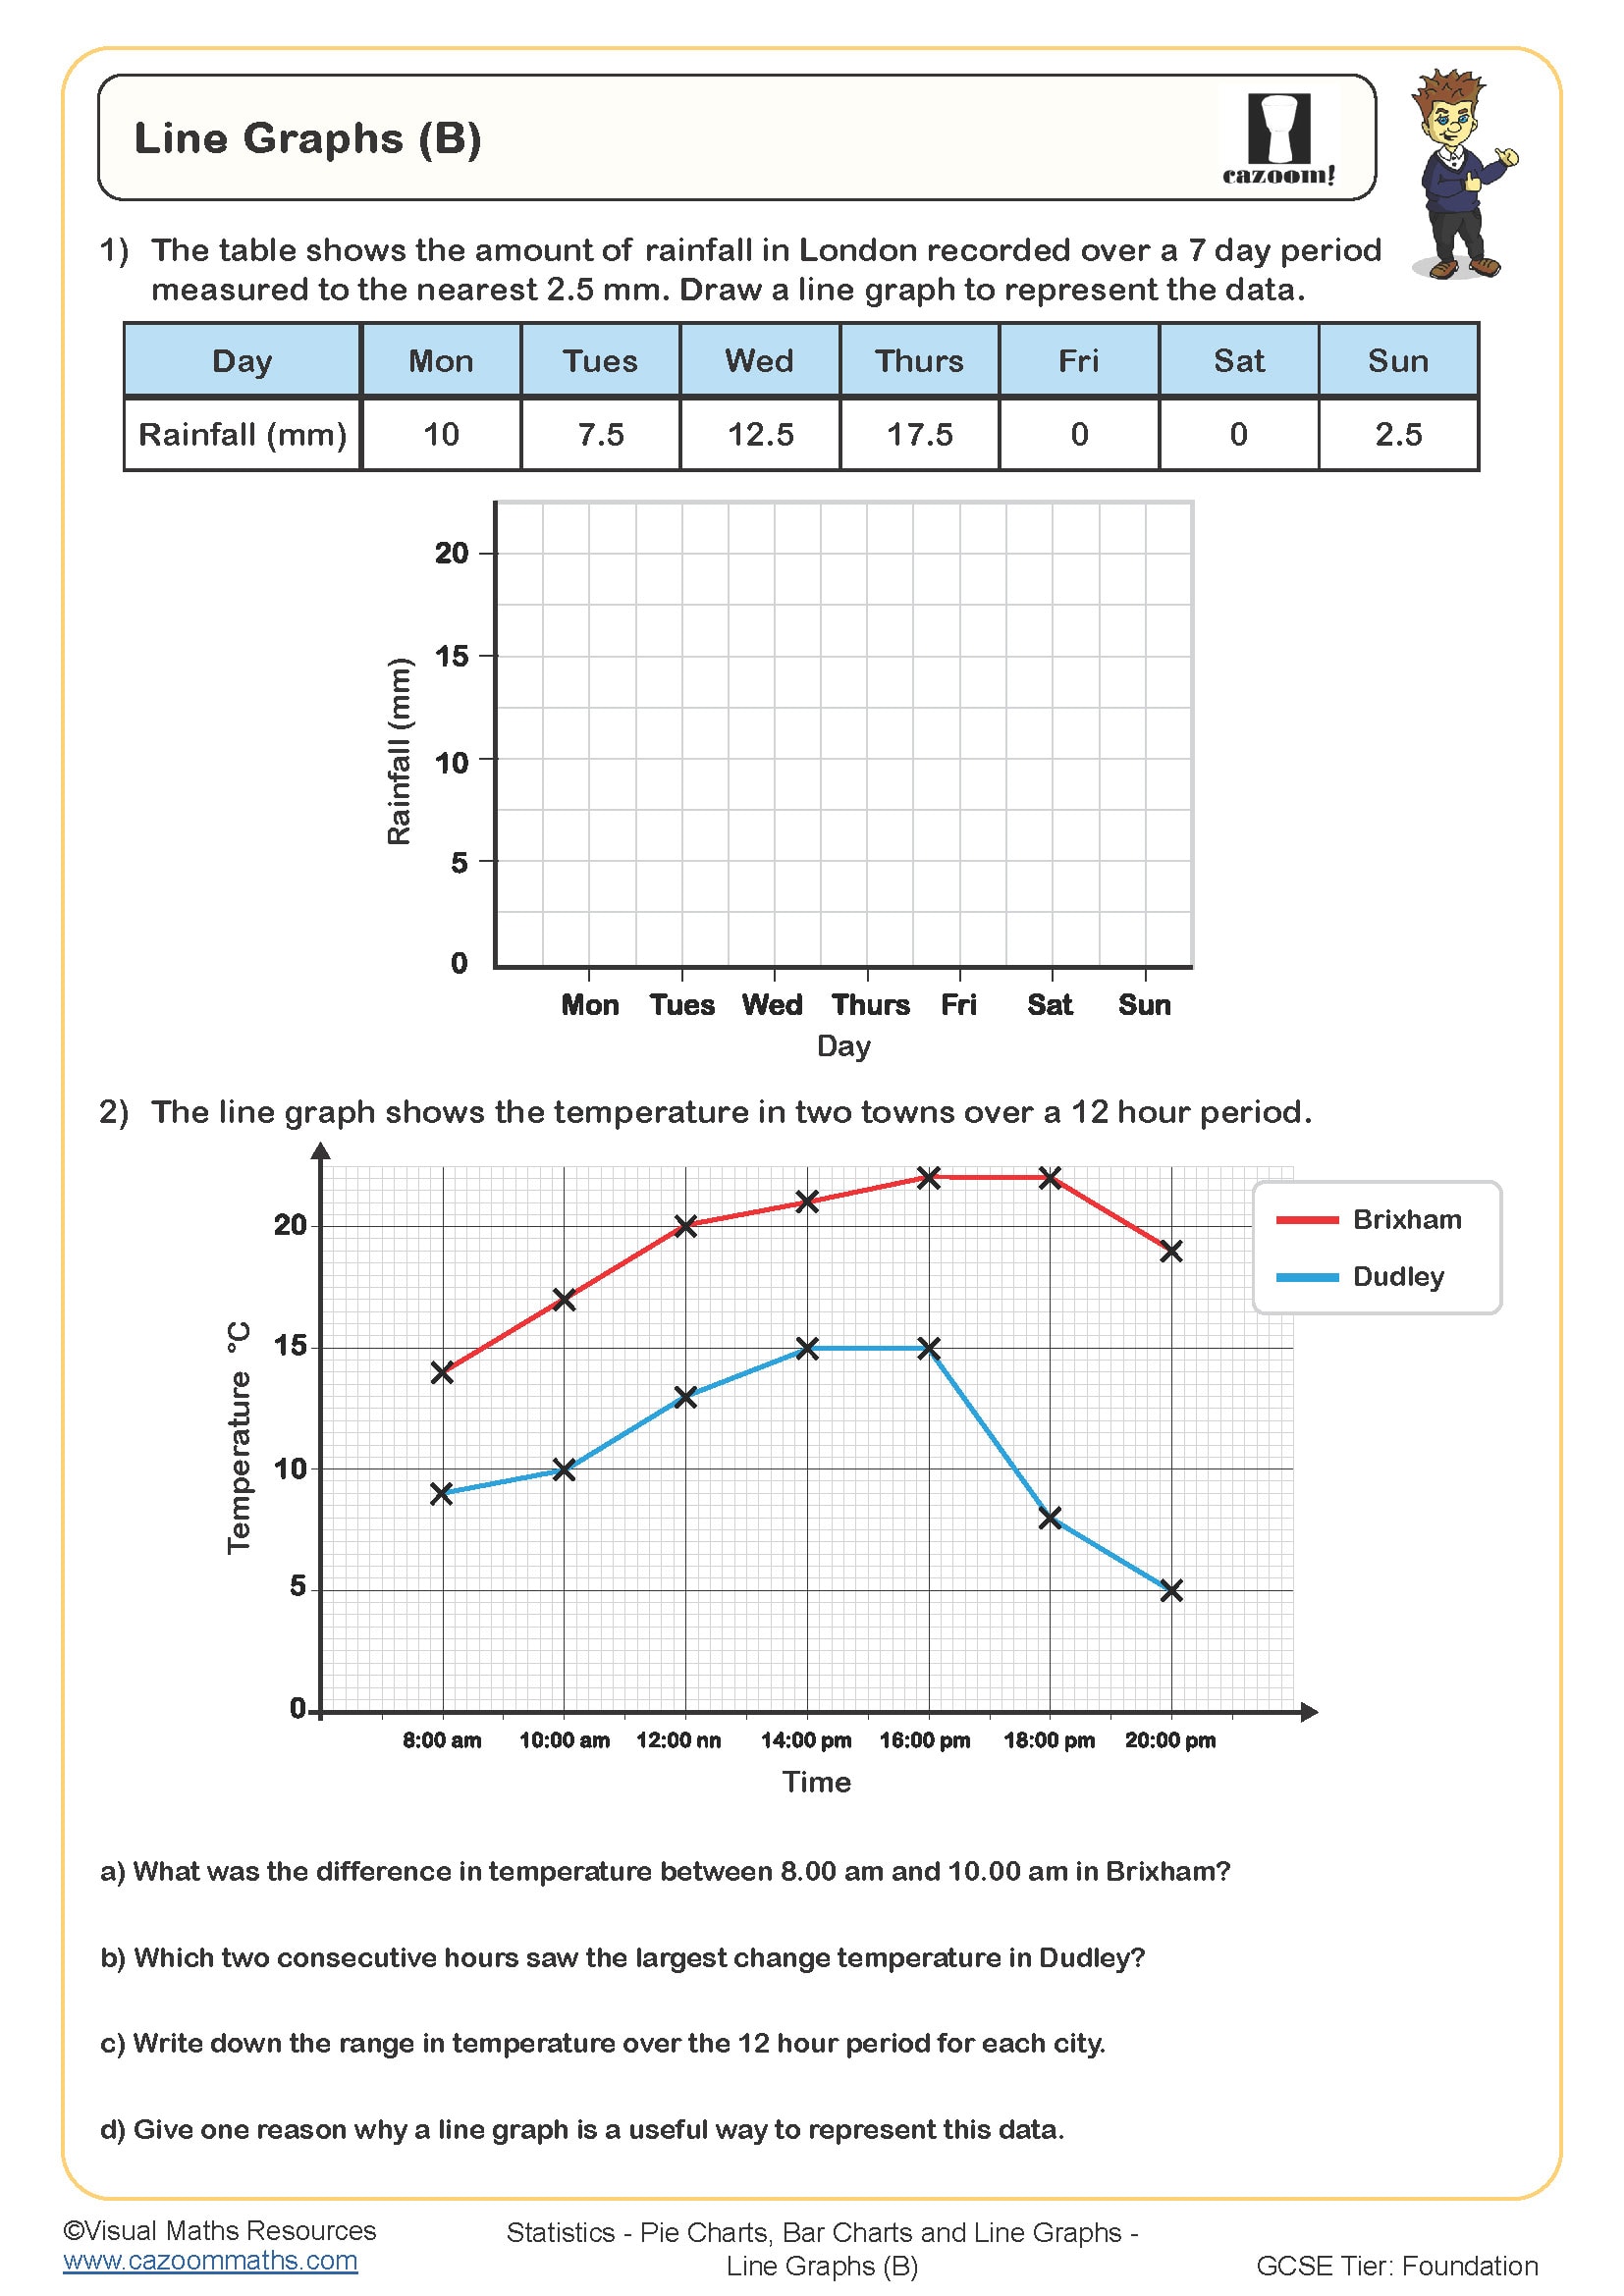
Line Graphs (B)
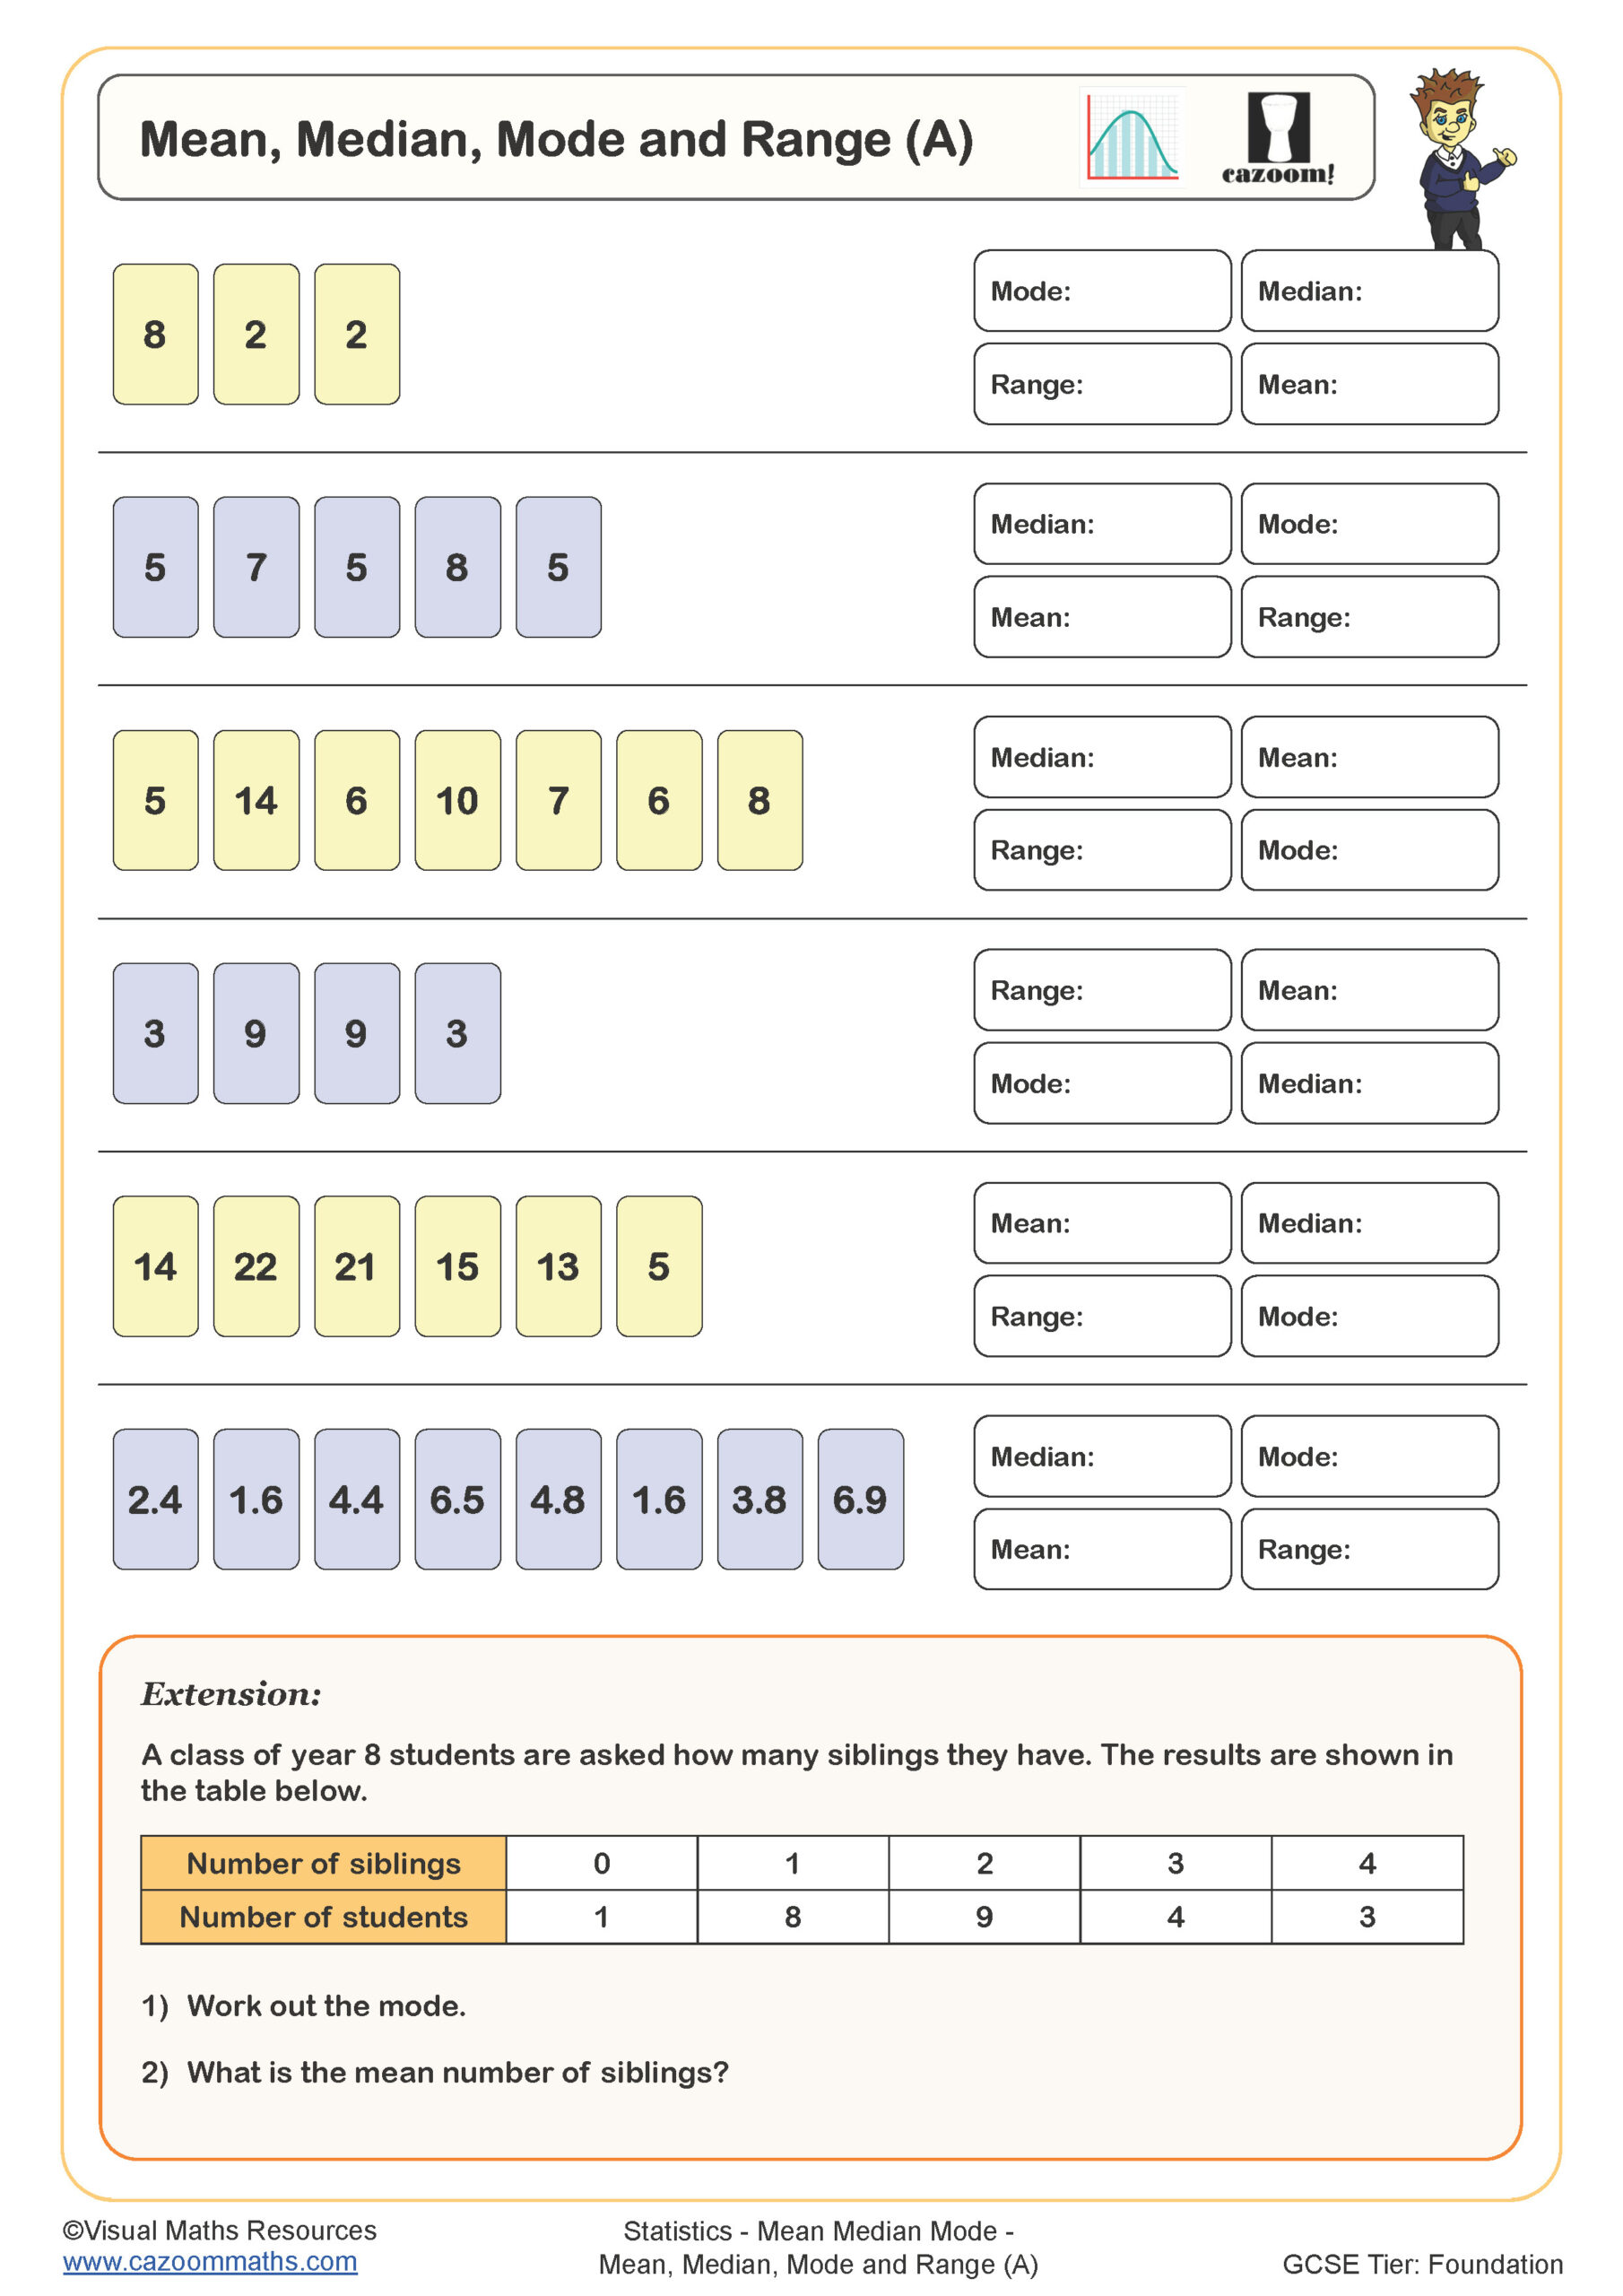
Mean, Median, Mode and Range (A)
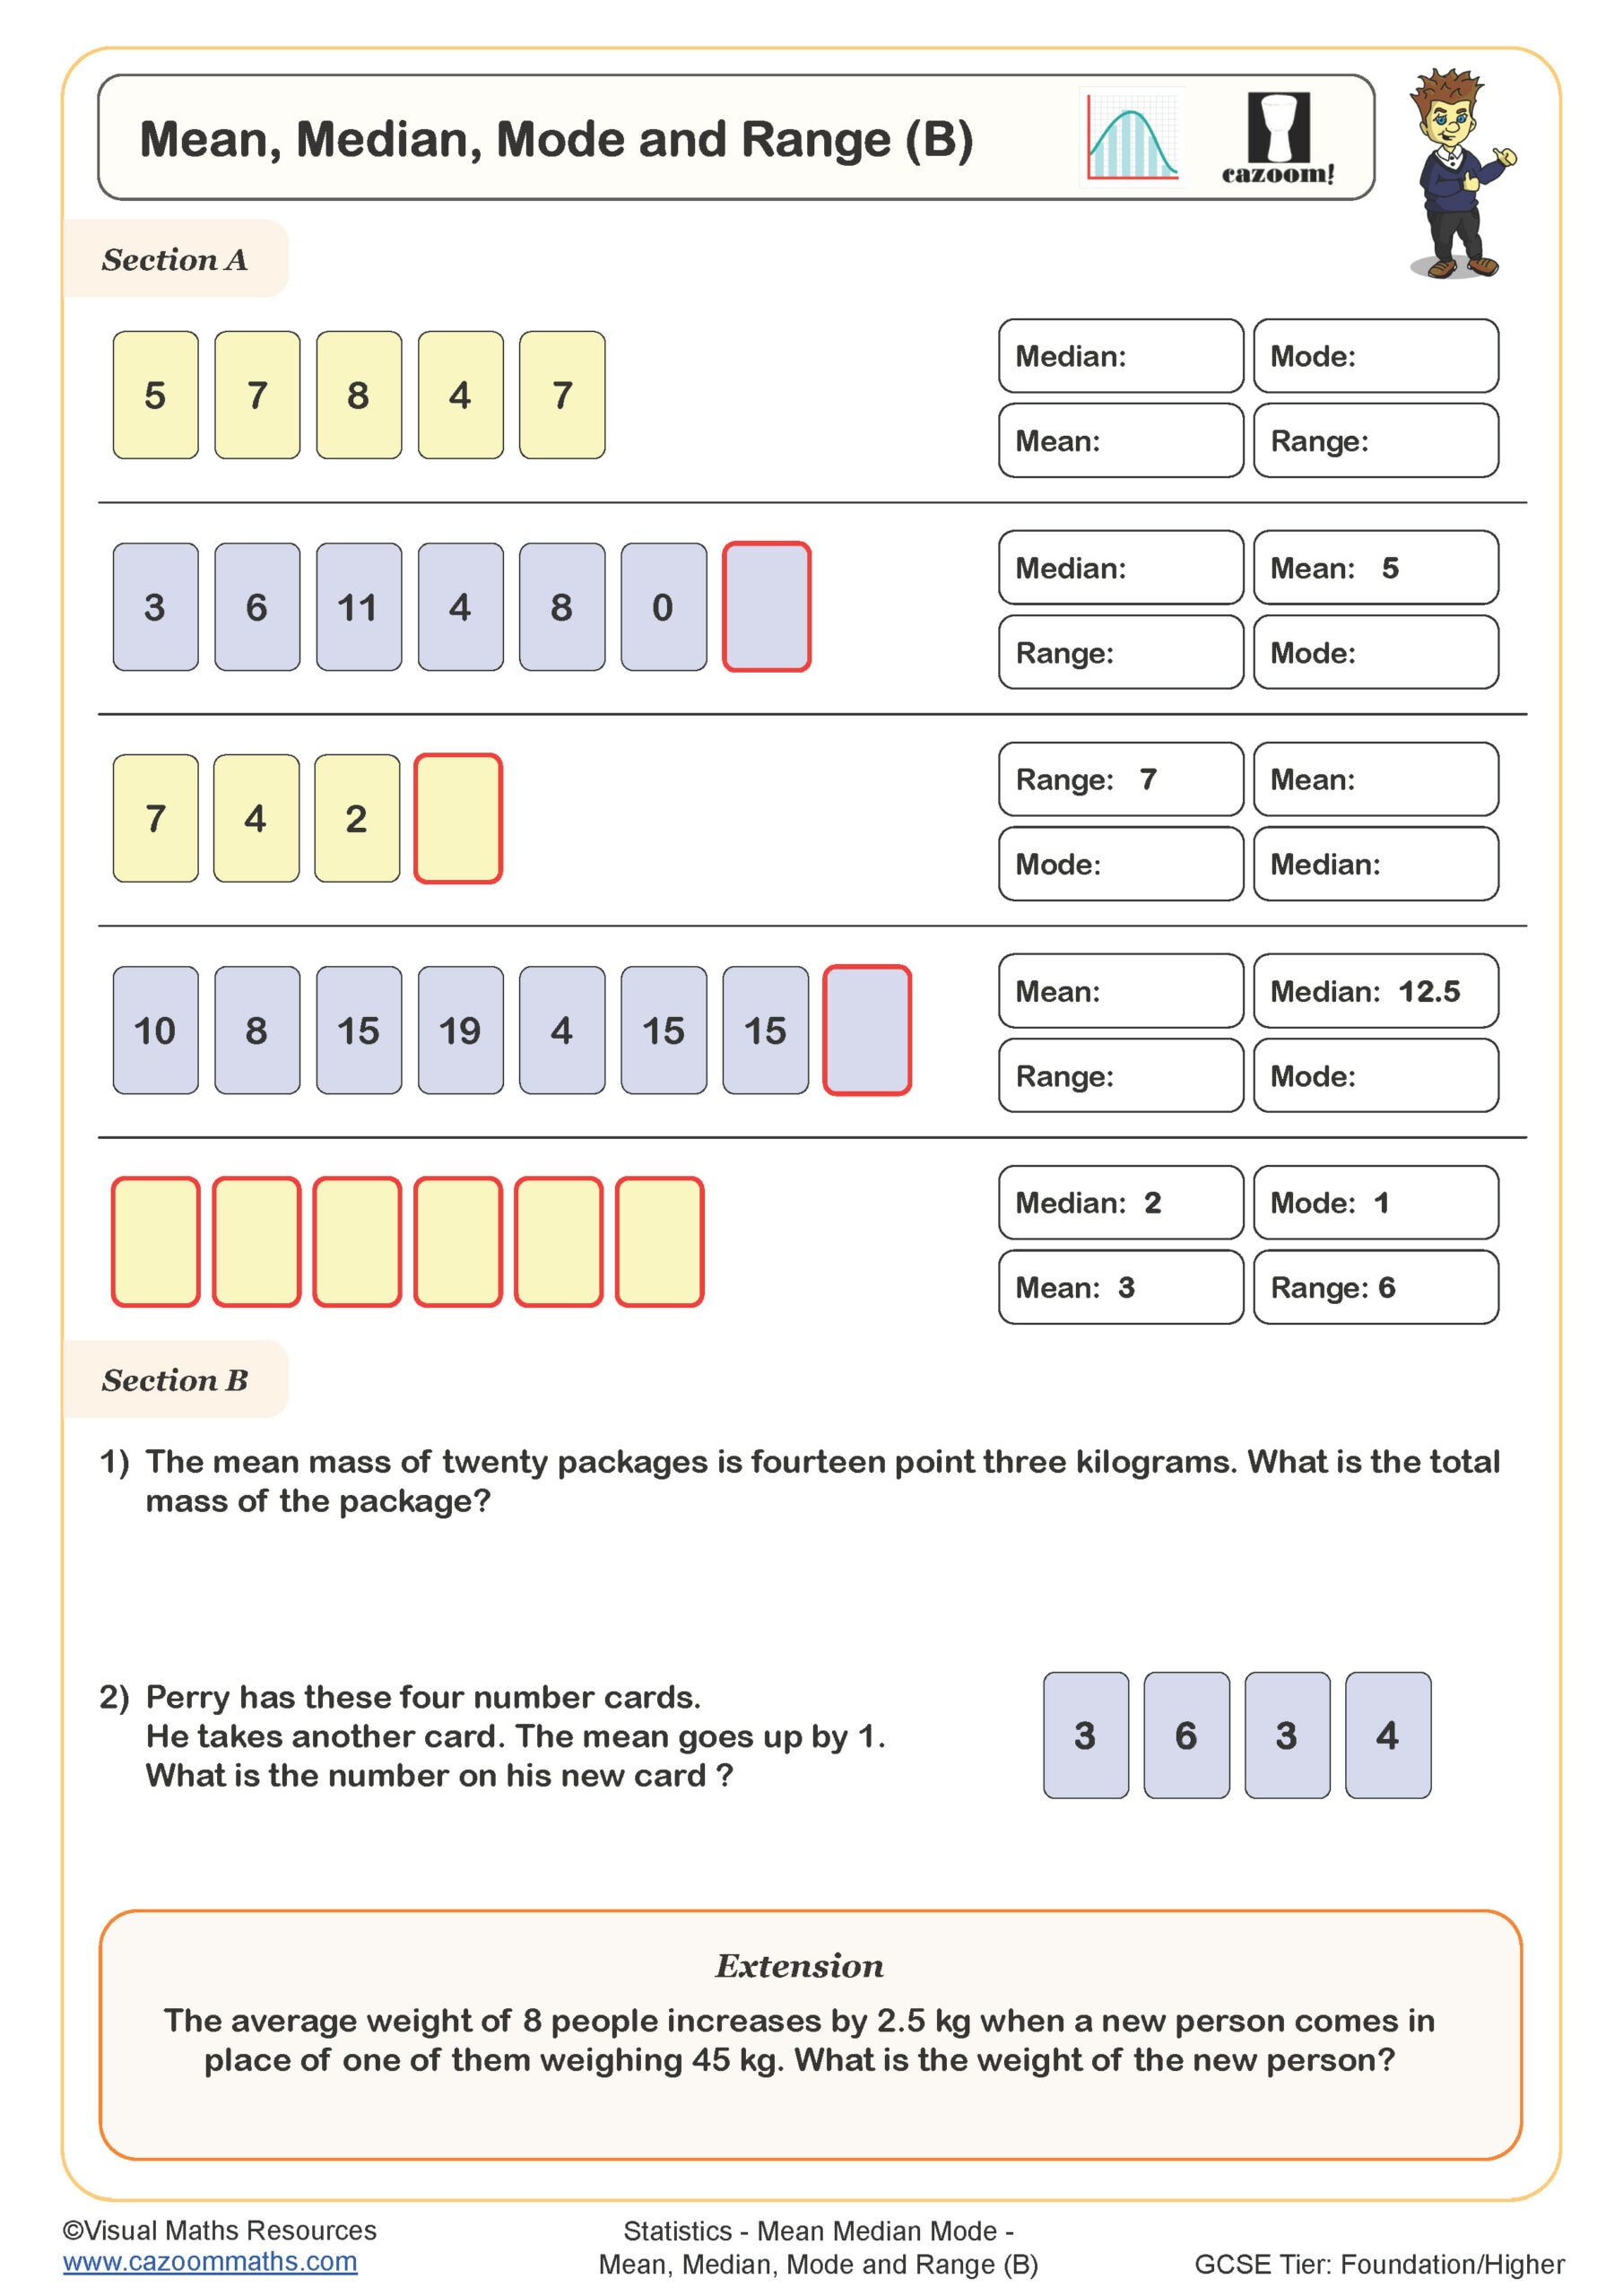
Mean, Median, Mode and Range (B)
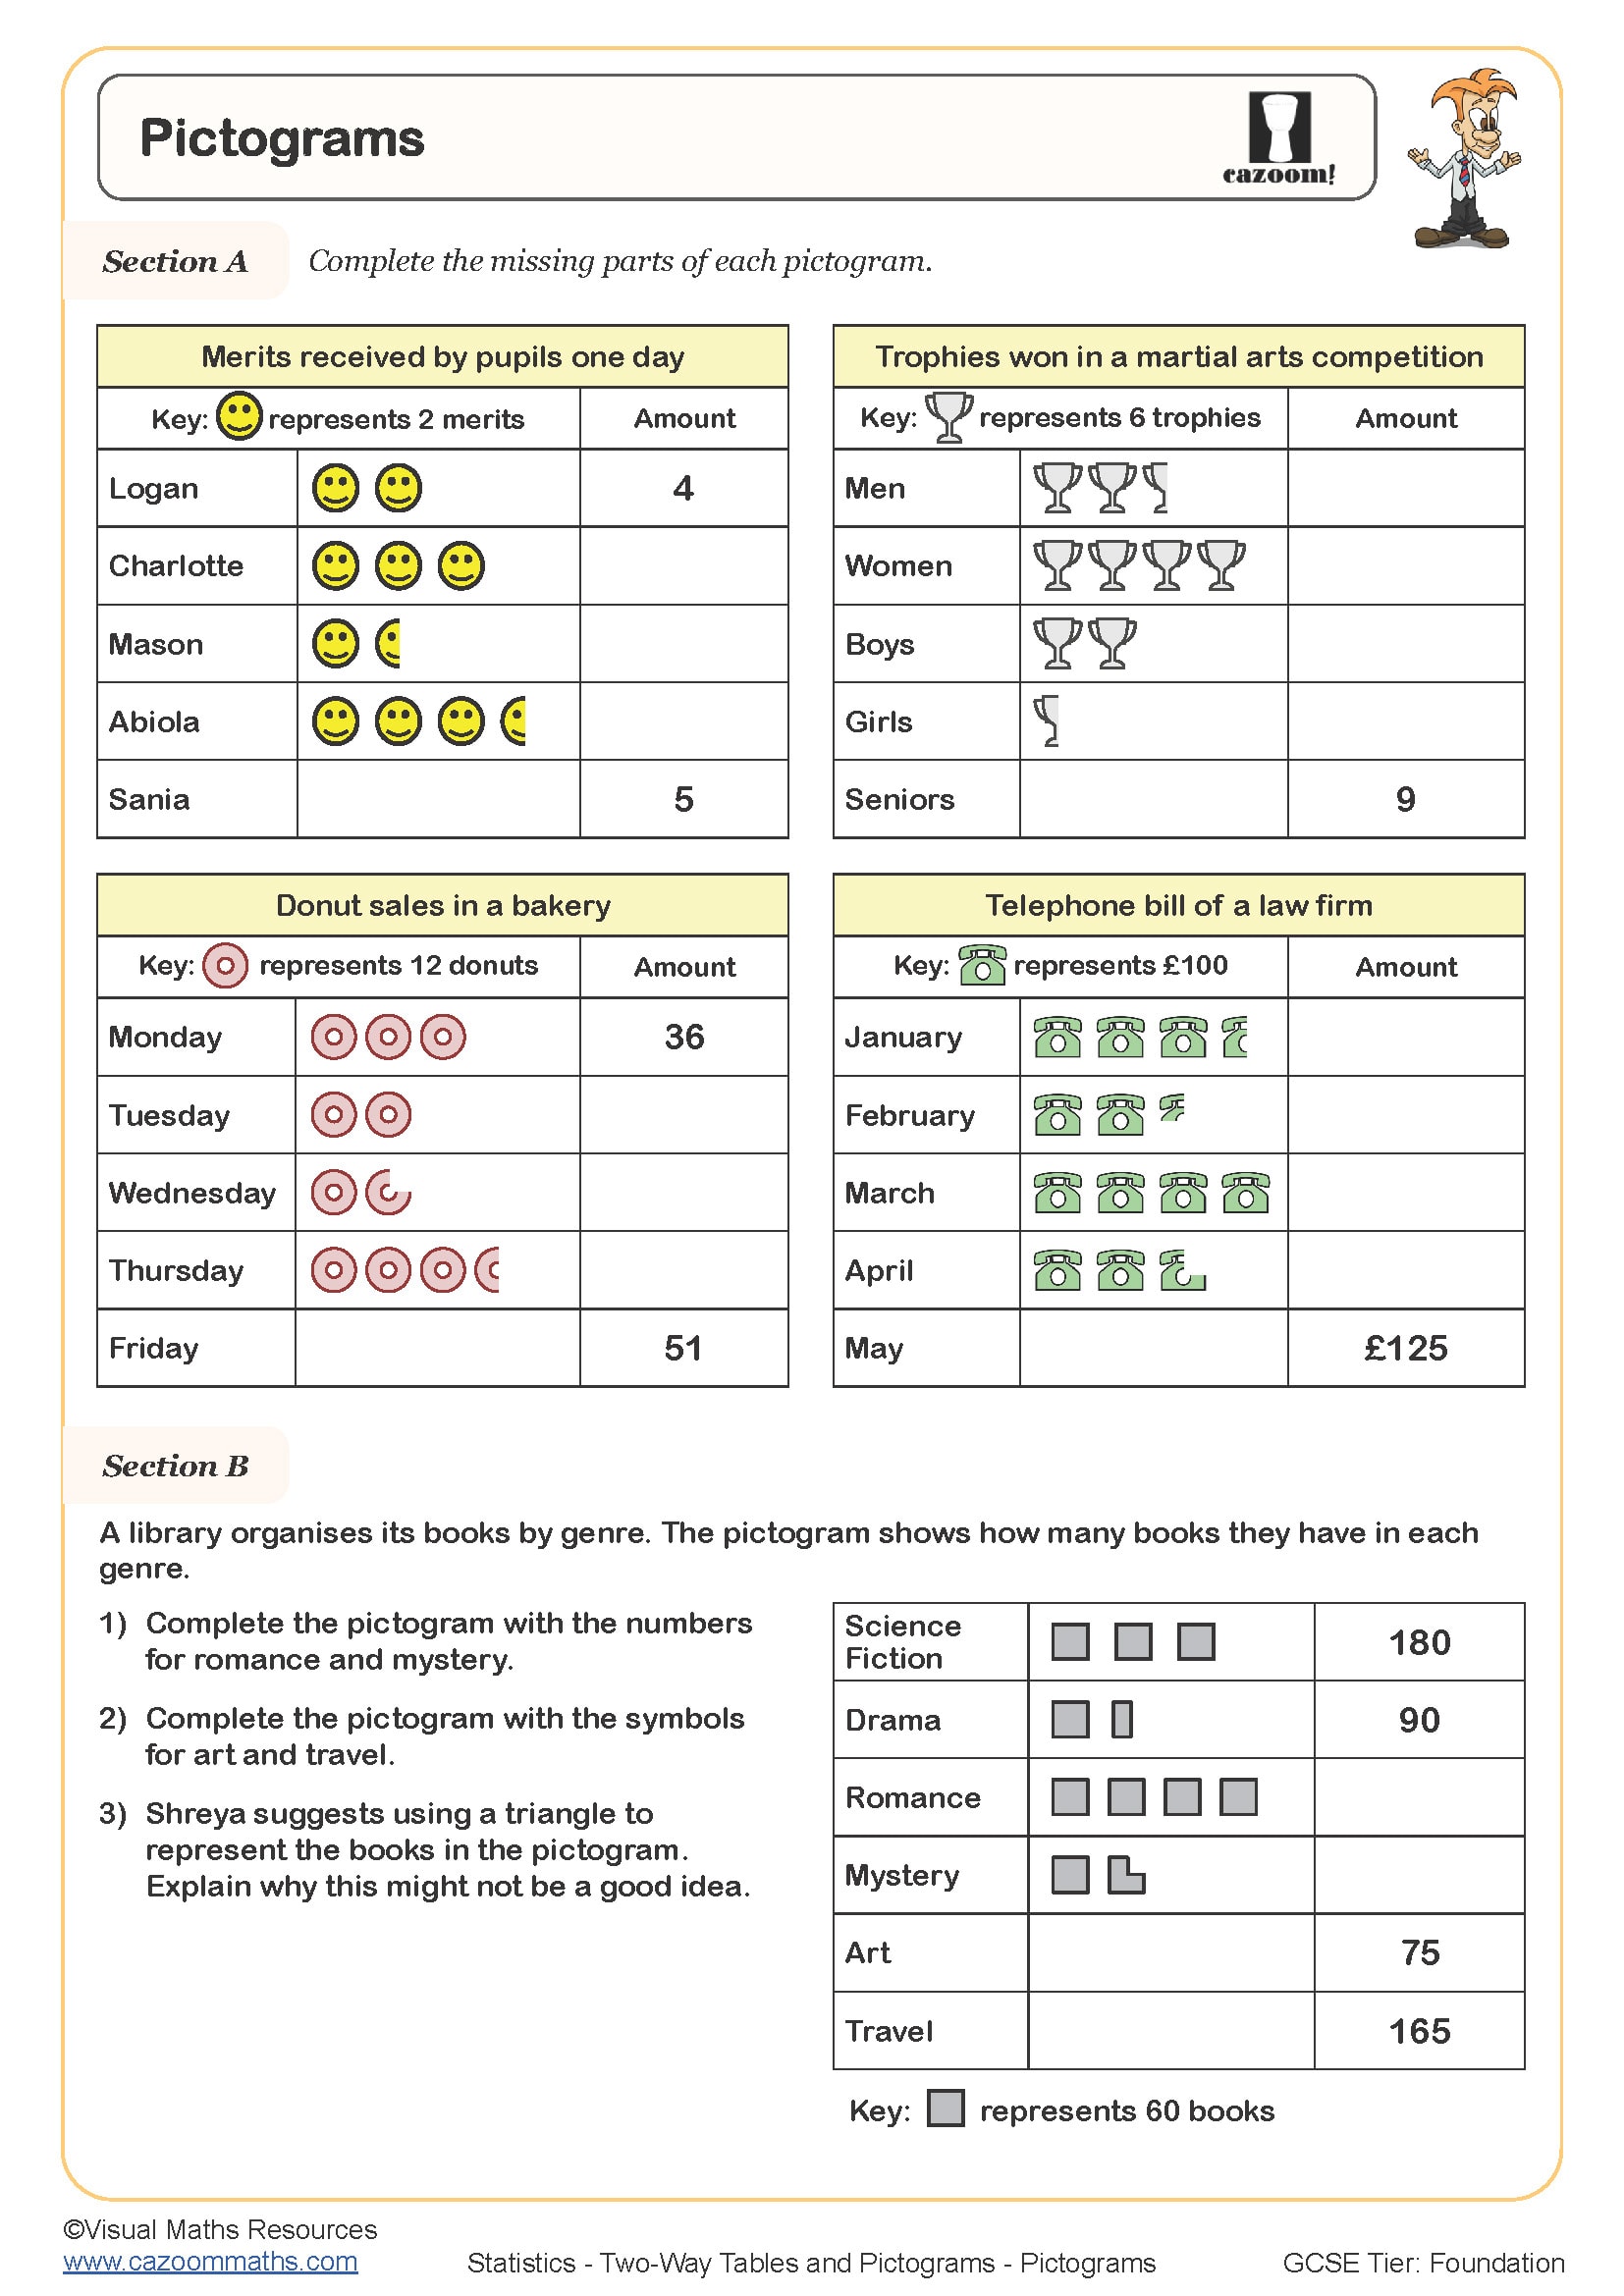
Pictograms
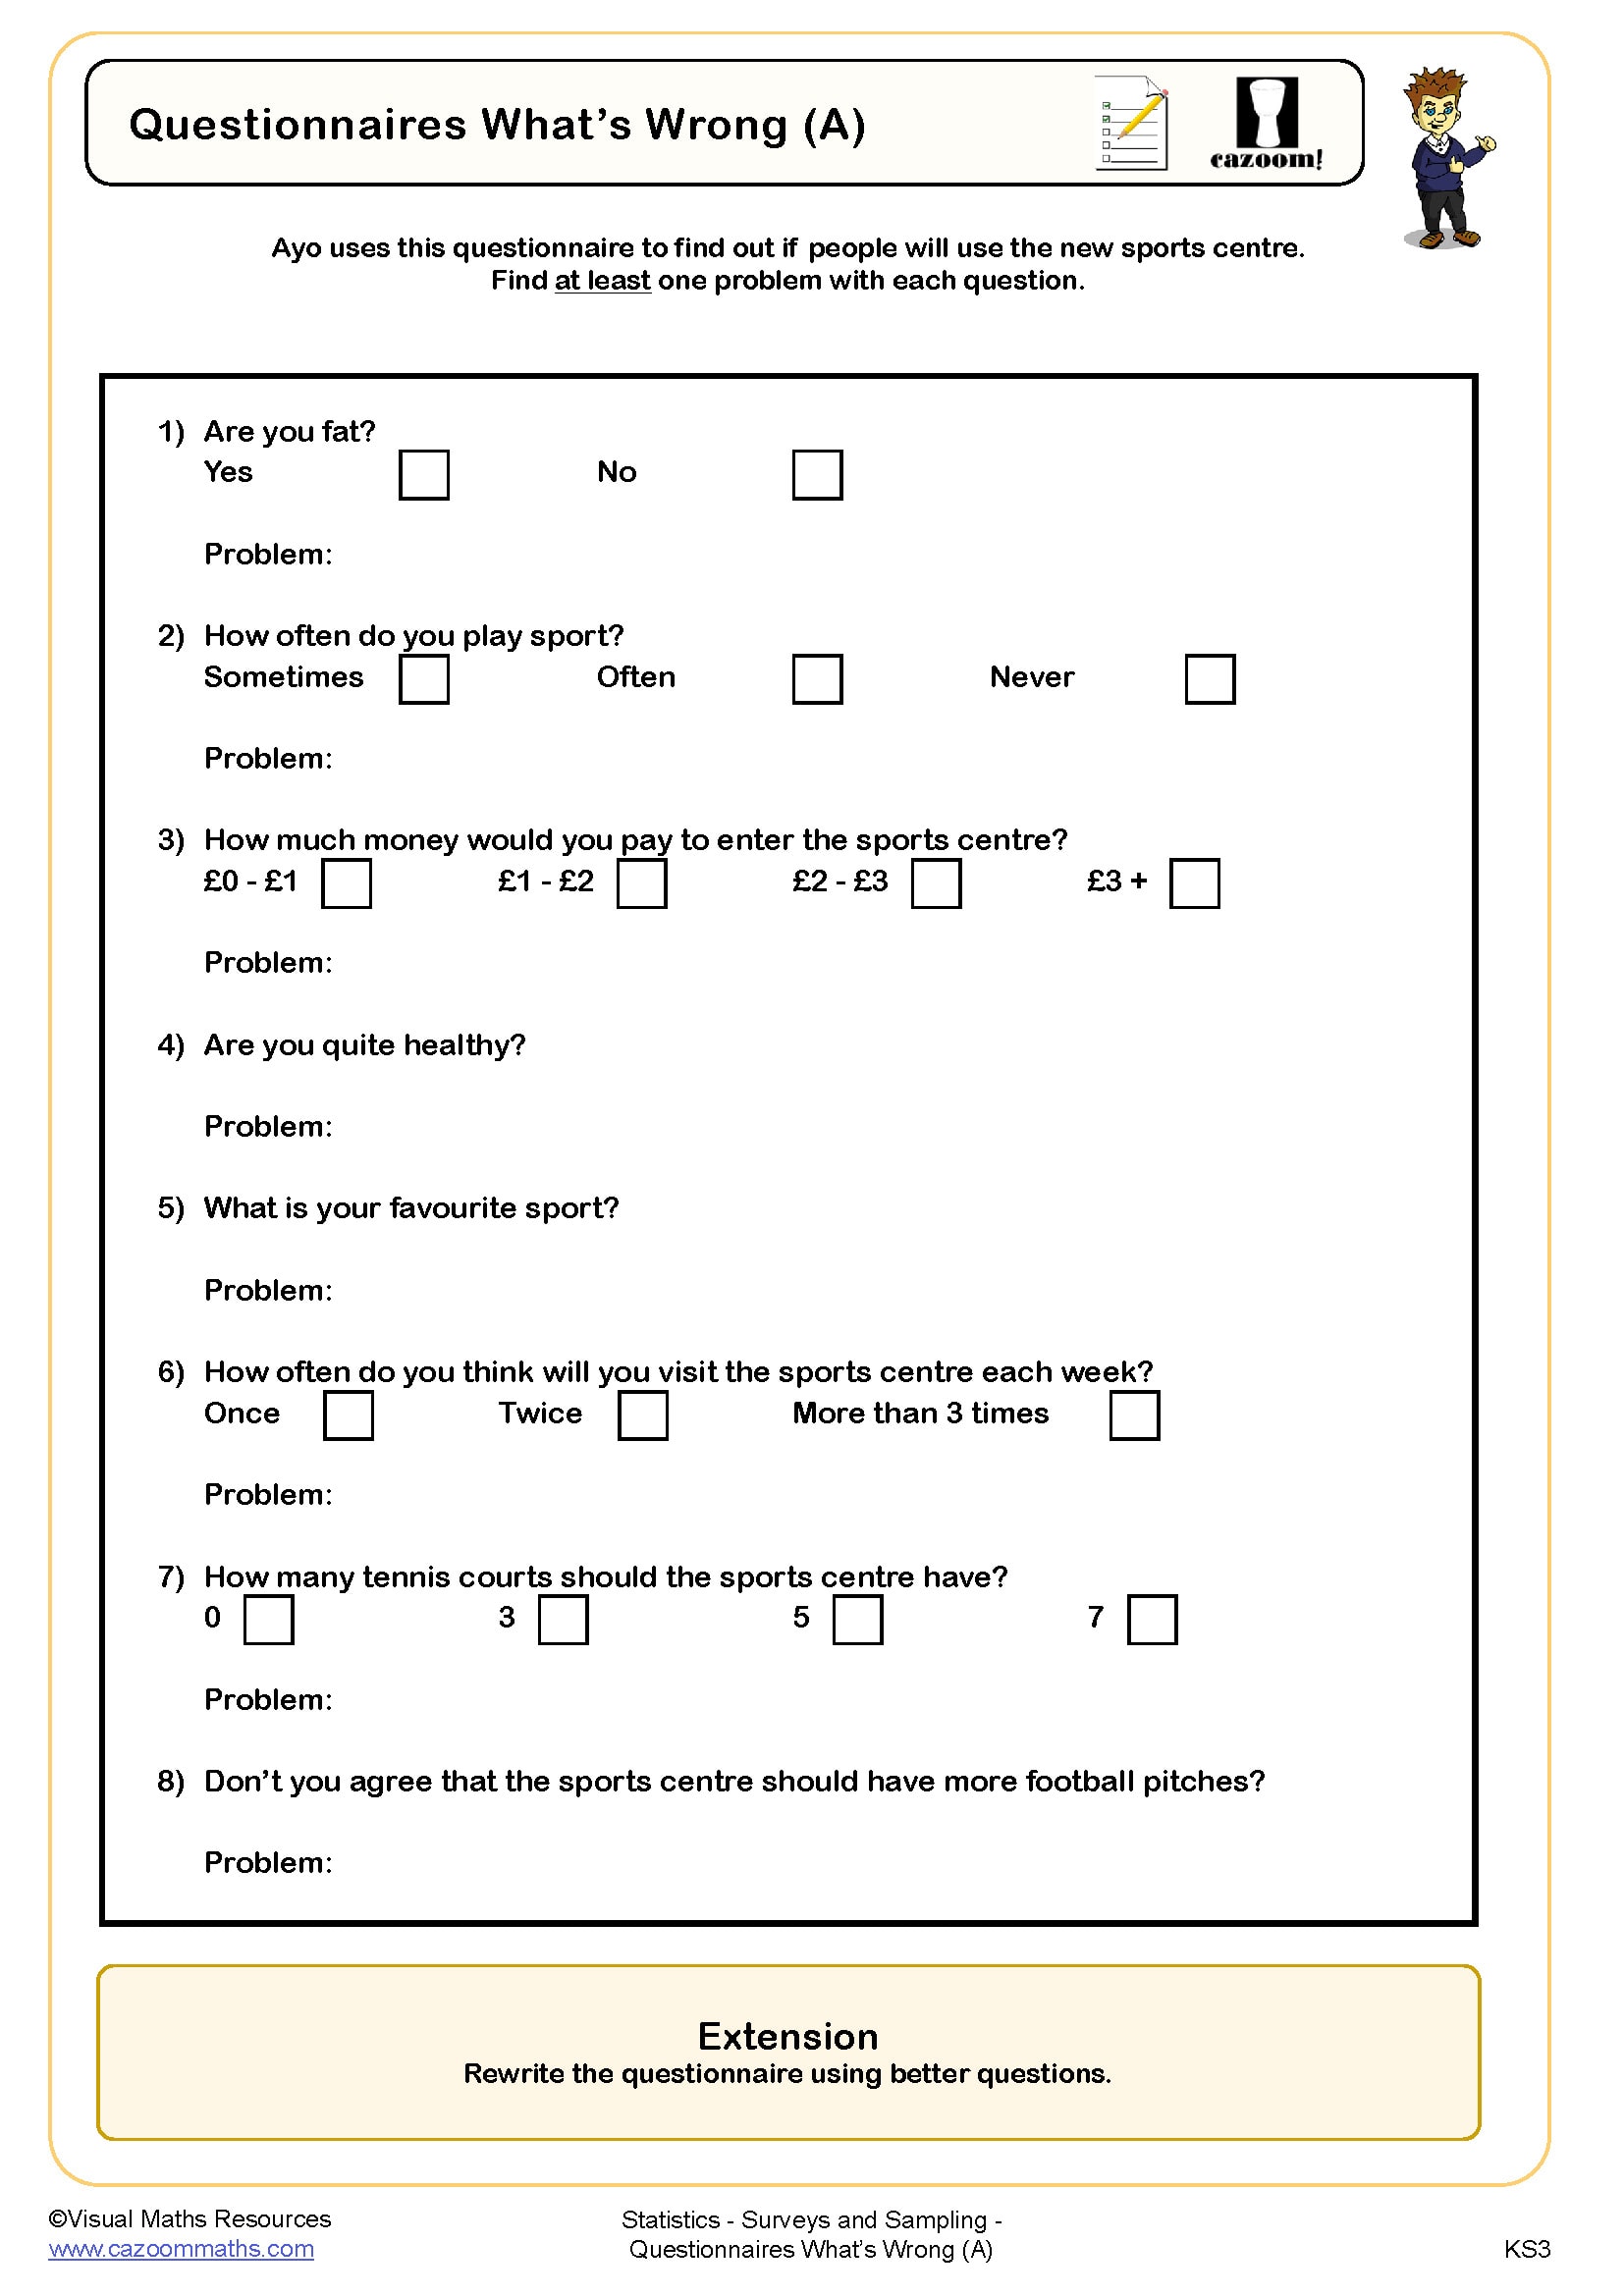
Questionnaires What's Wrong (A)
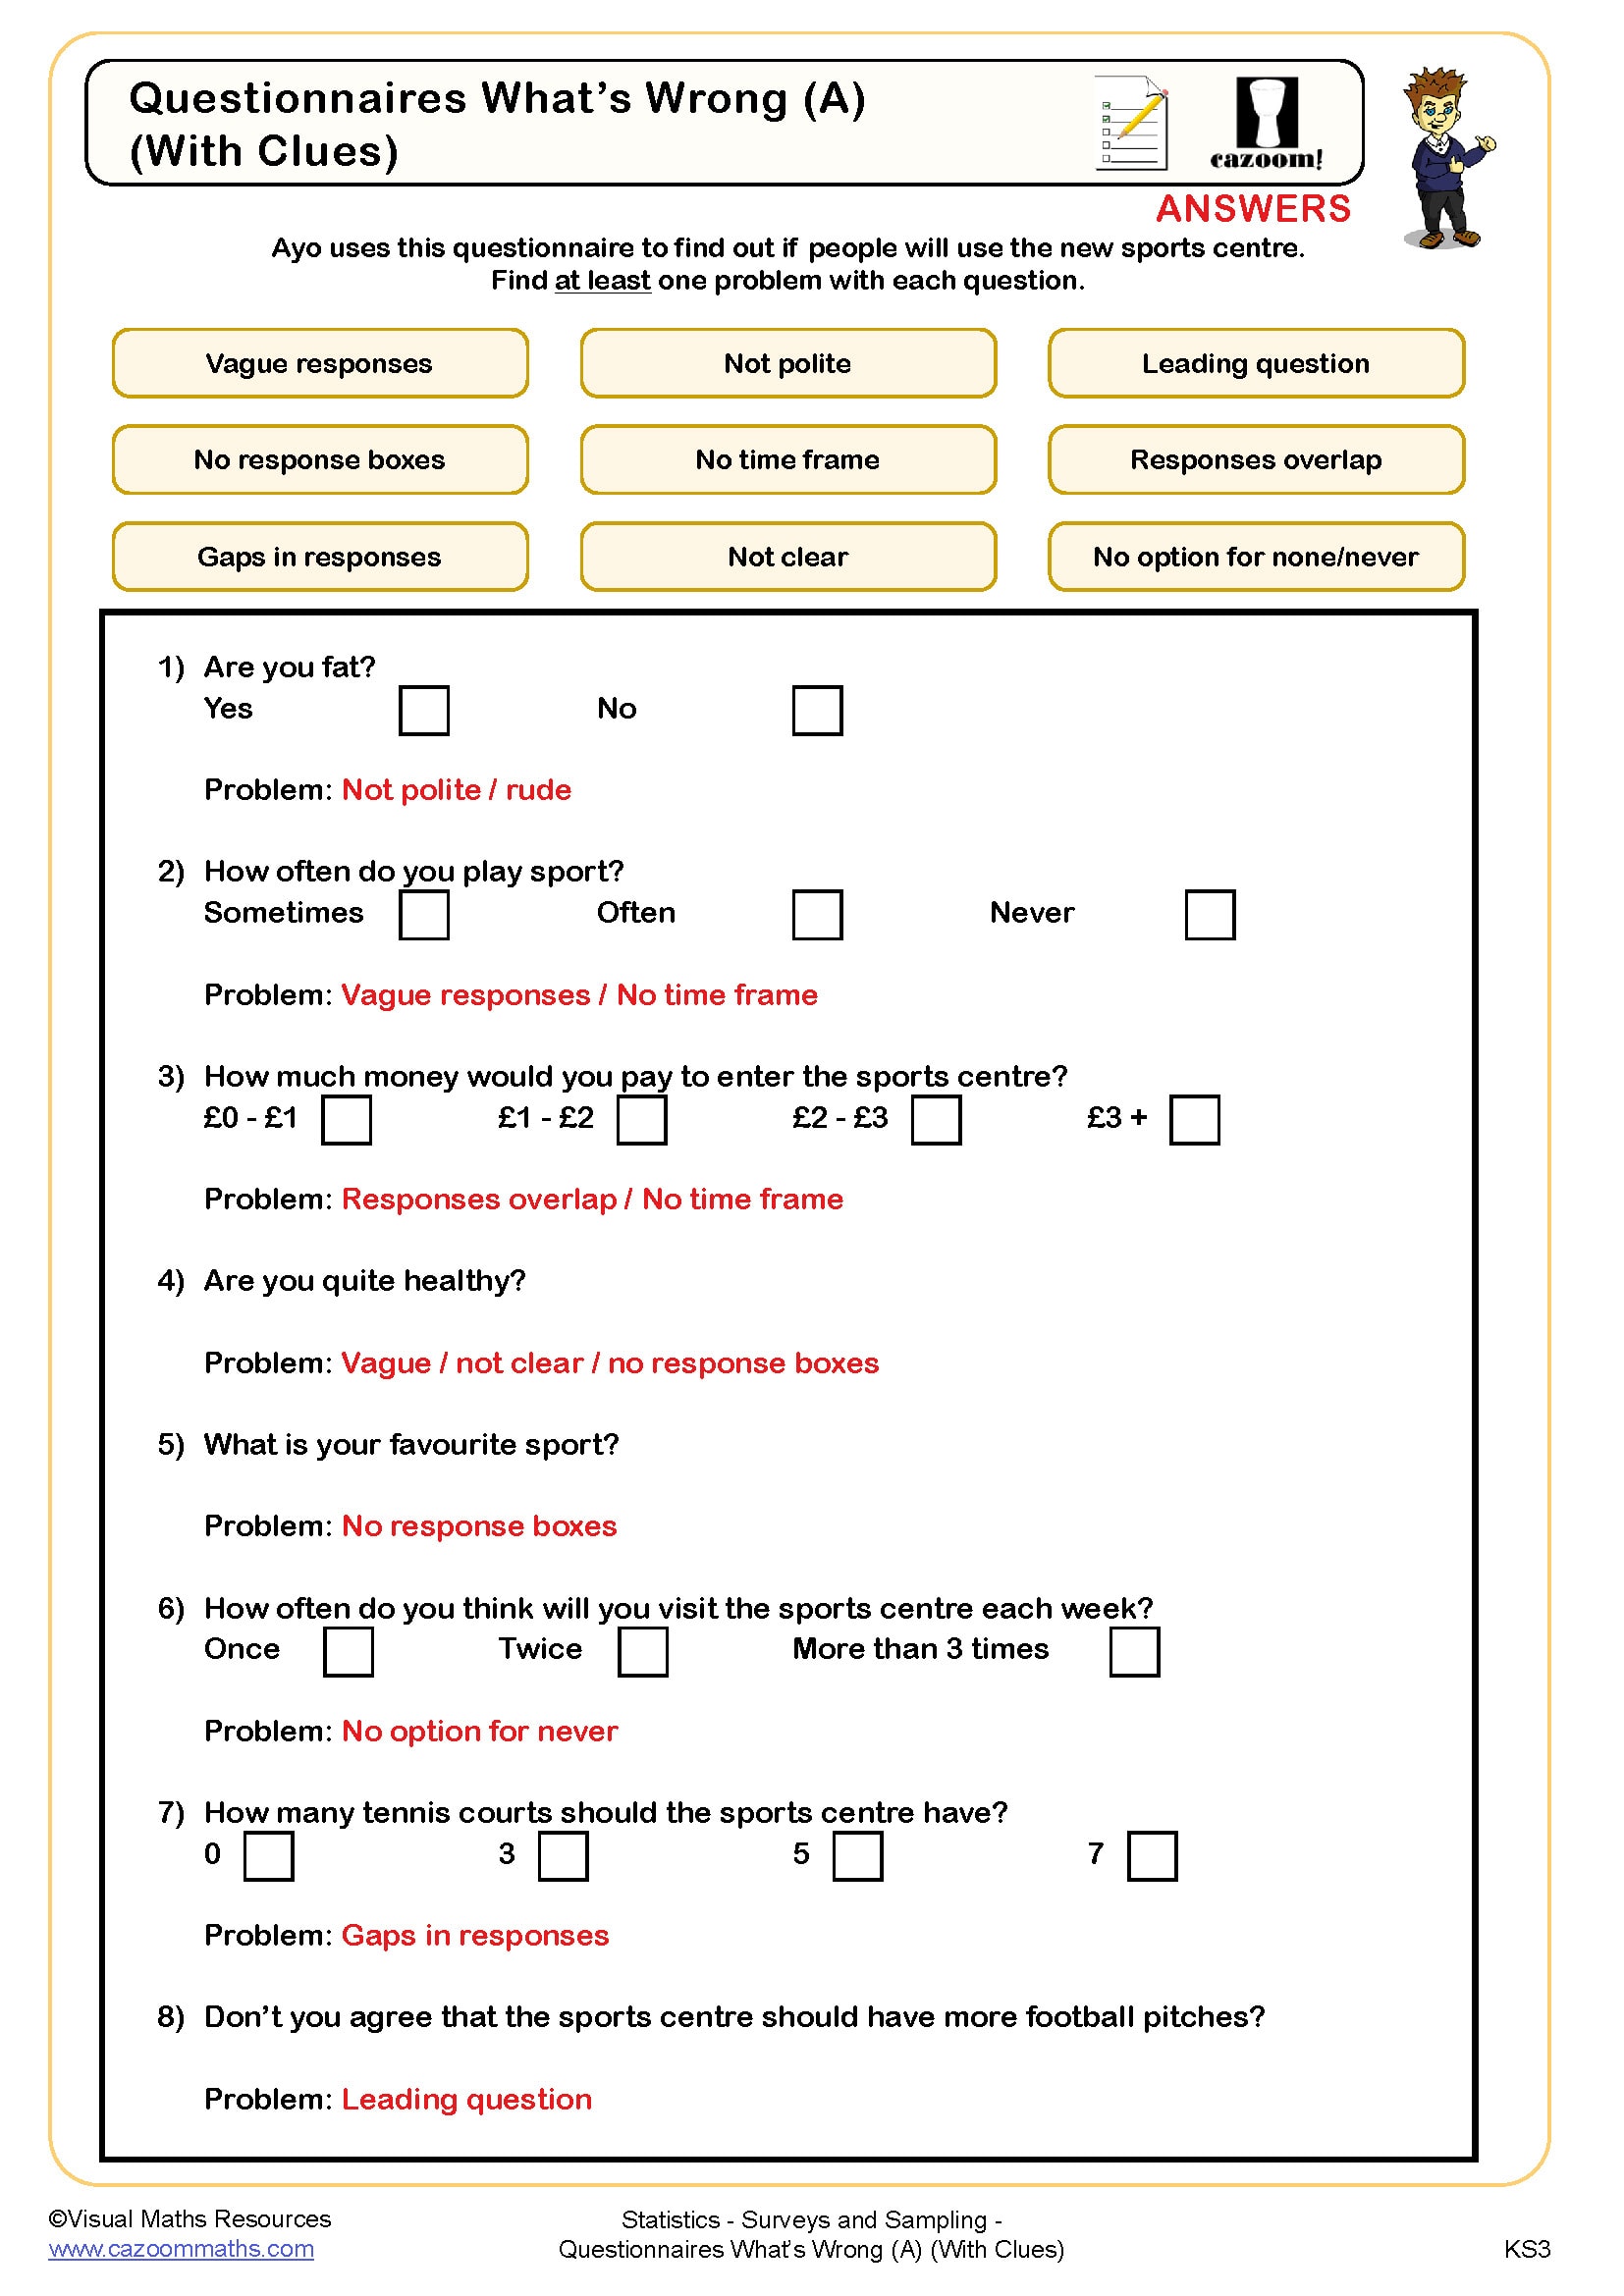
Questionnaires What's Wrong (A) (With Clues)
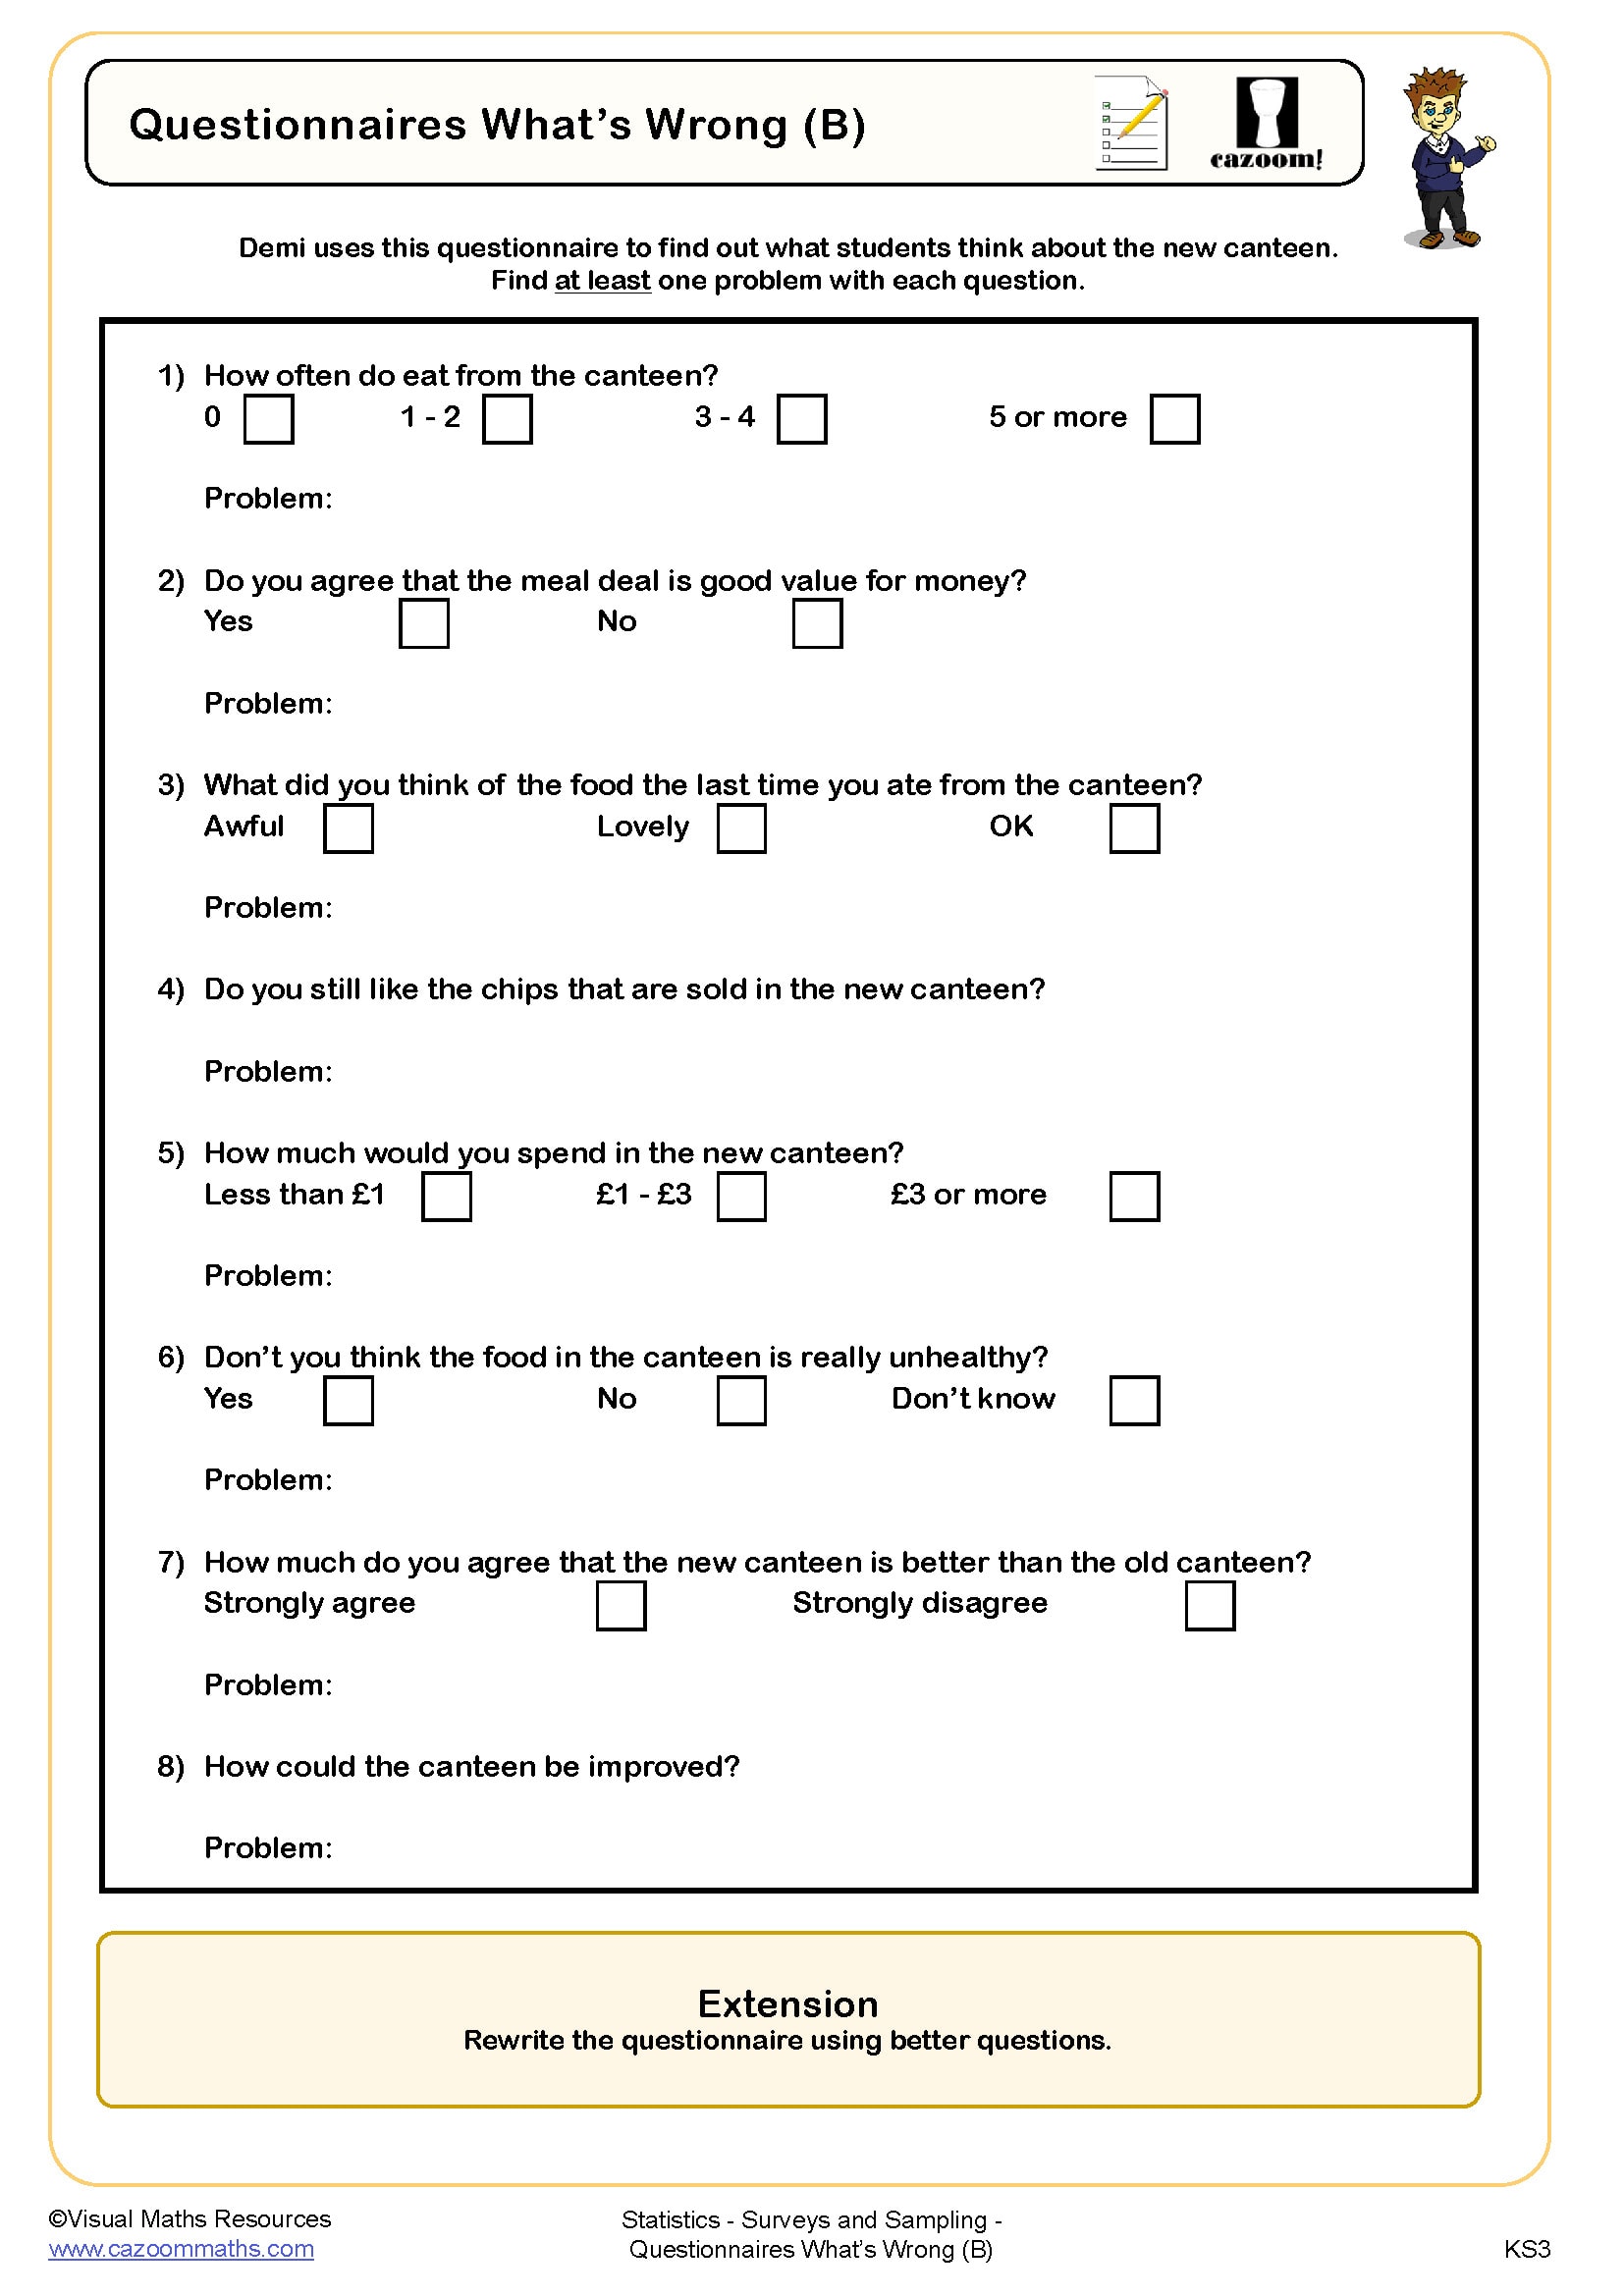
Questionnaires What's Wrong (B)
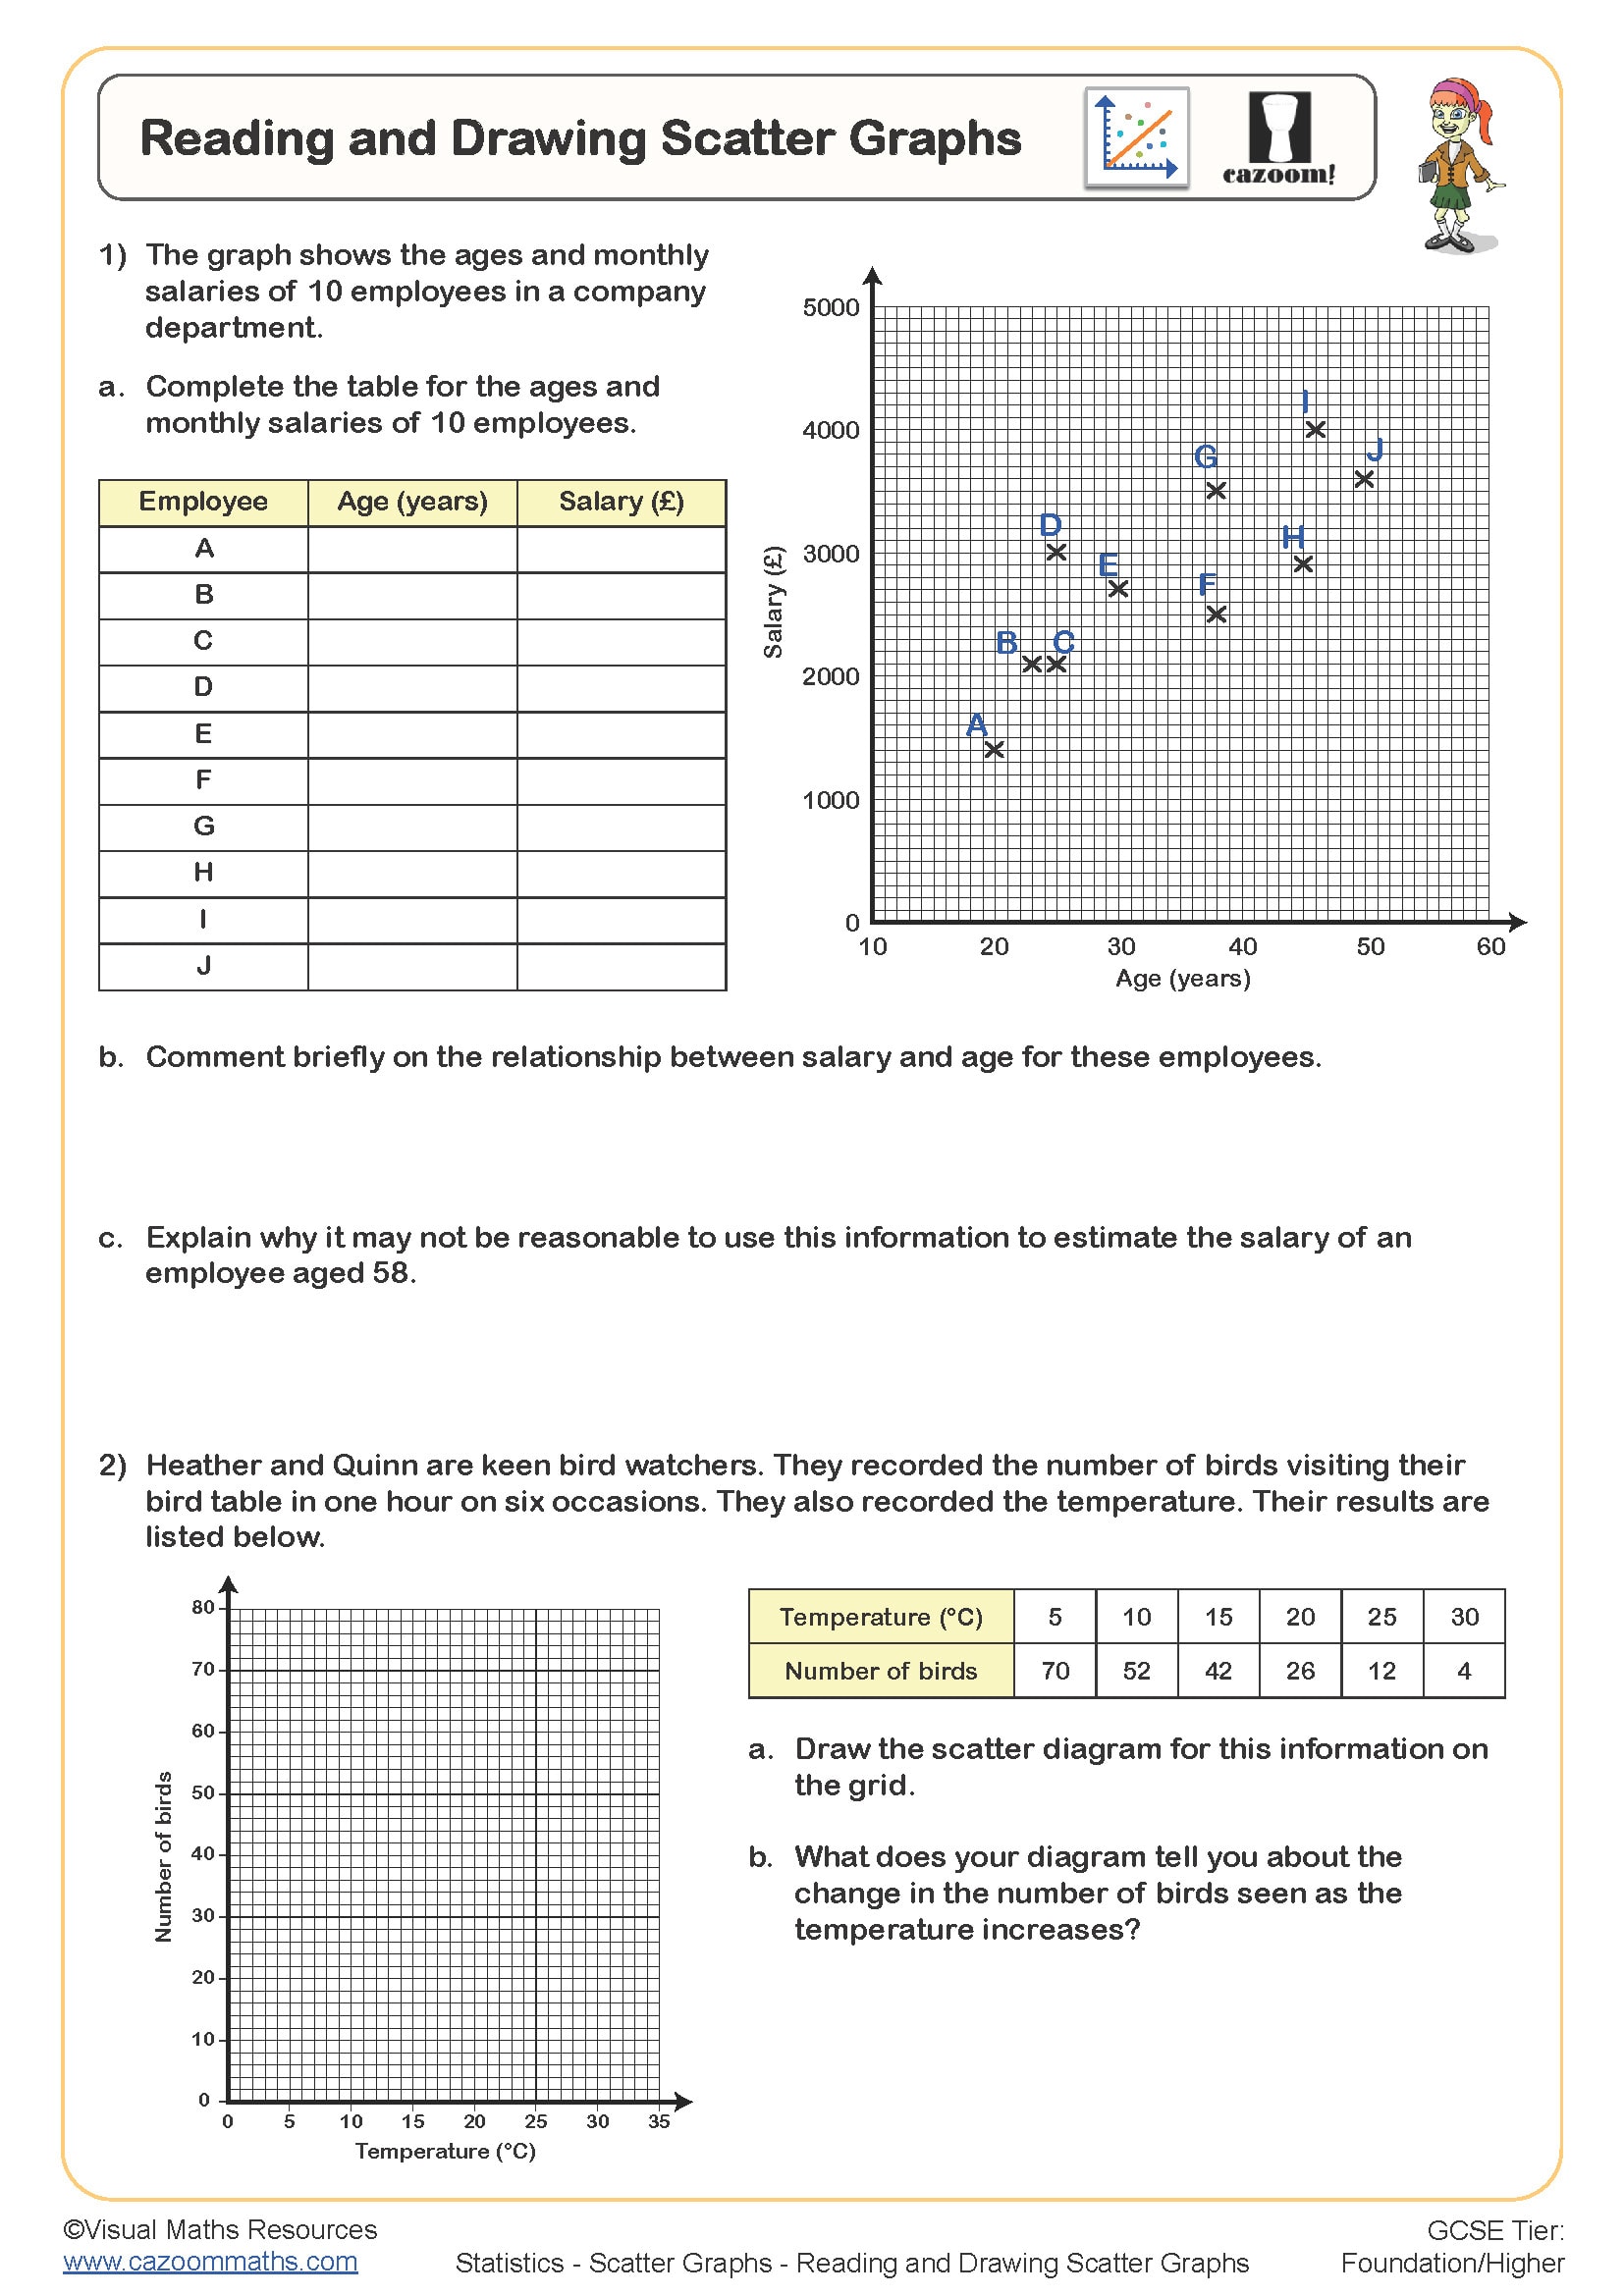
Reading and Drawing Scatter Graphs
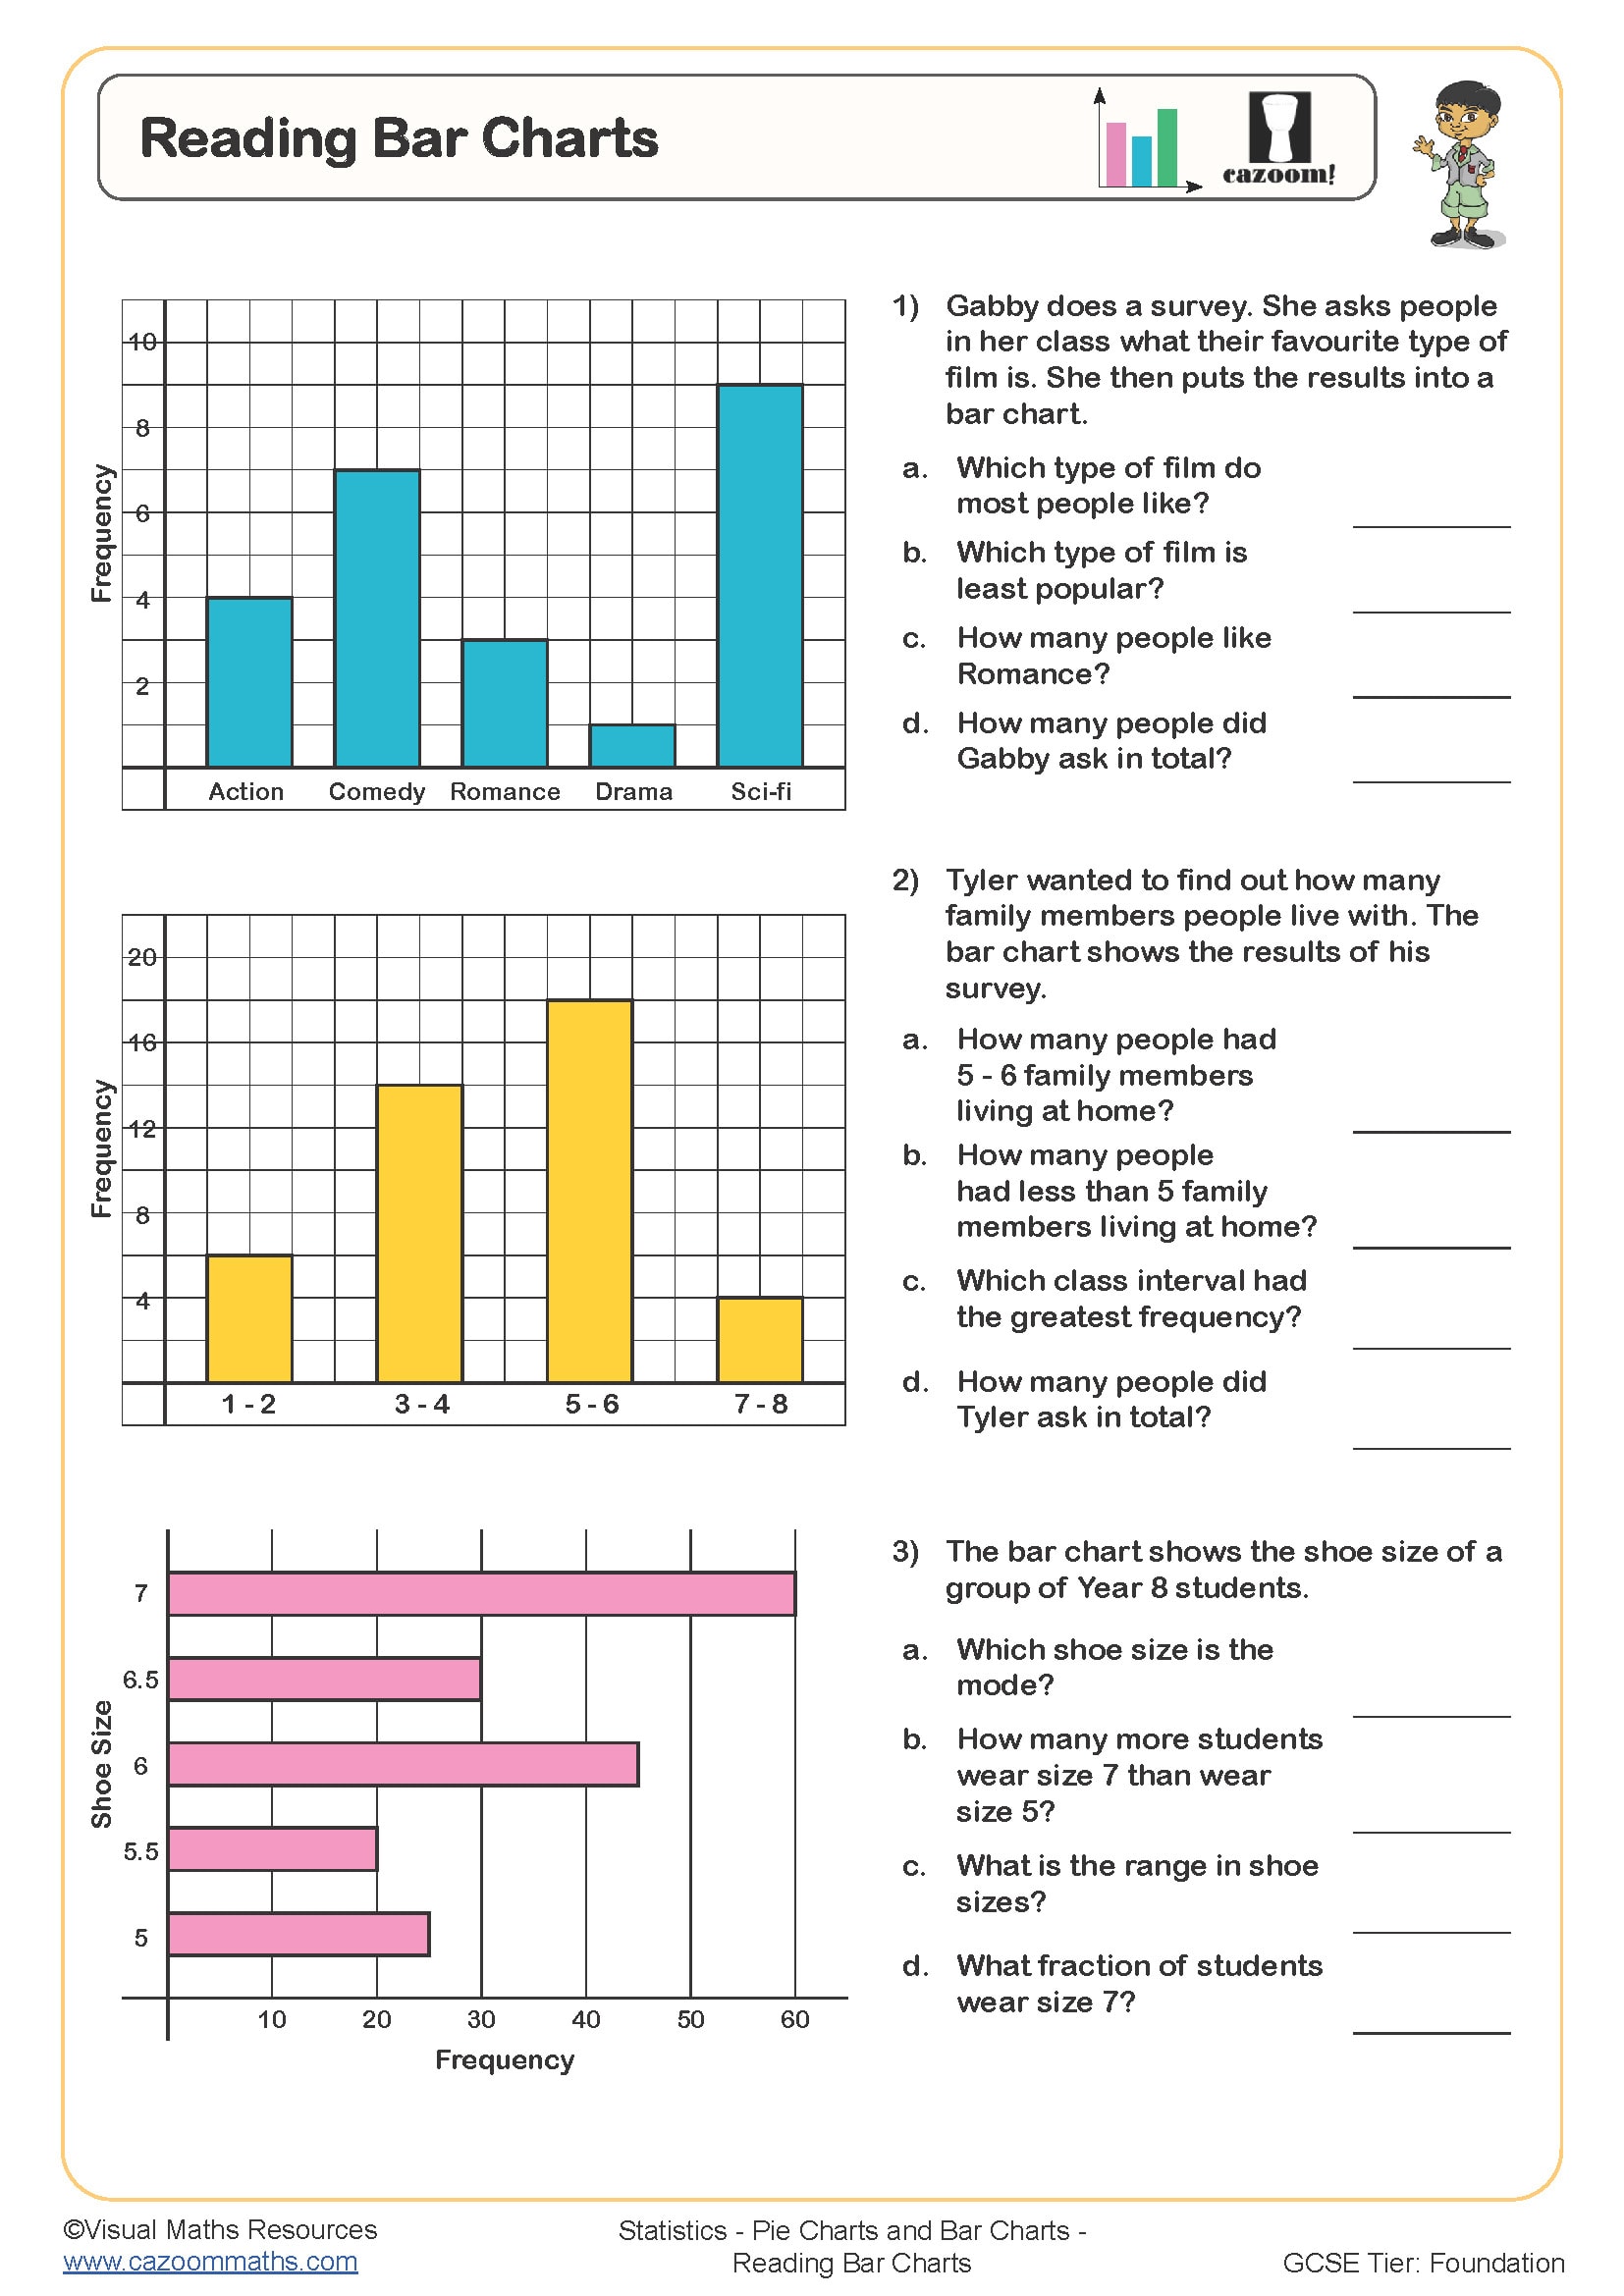
Reading Bar Charts
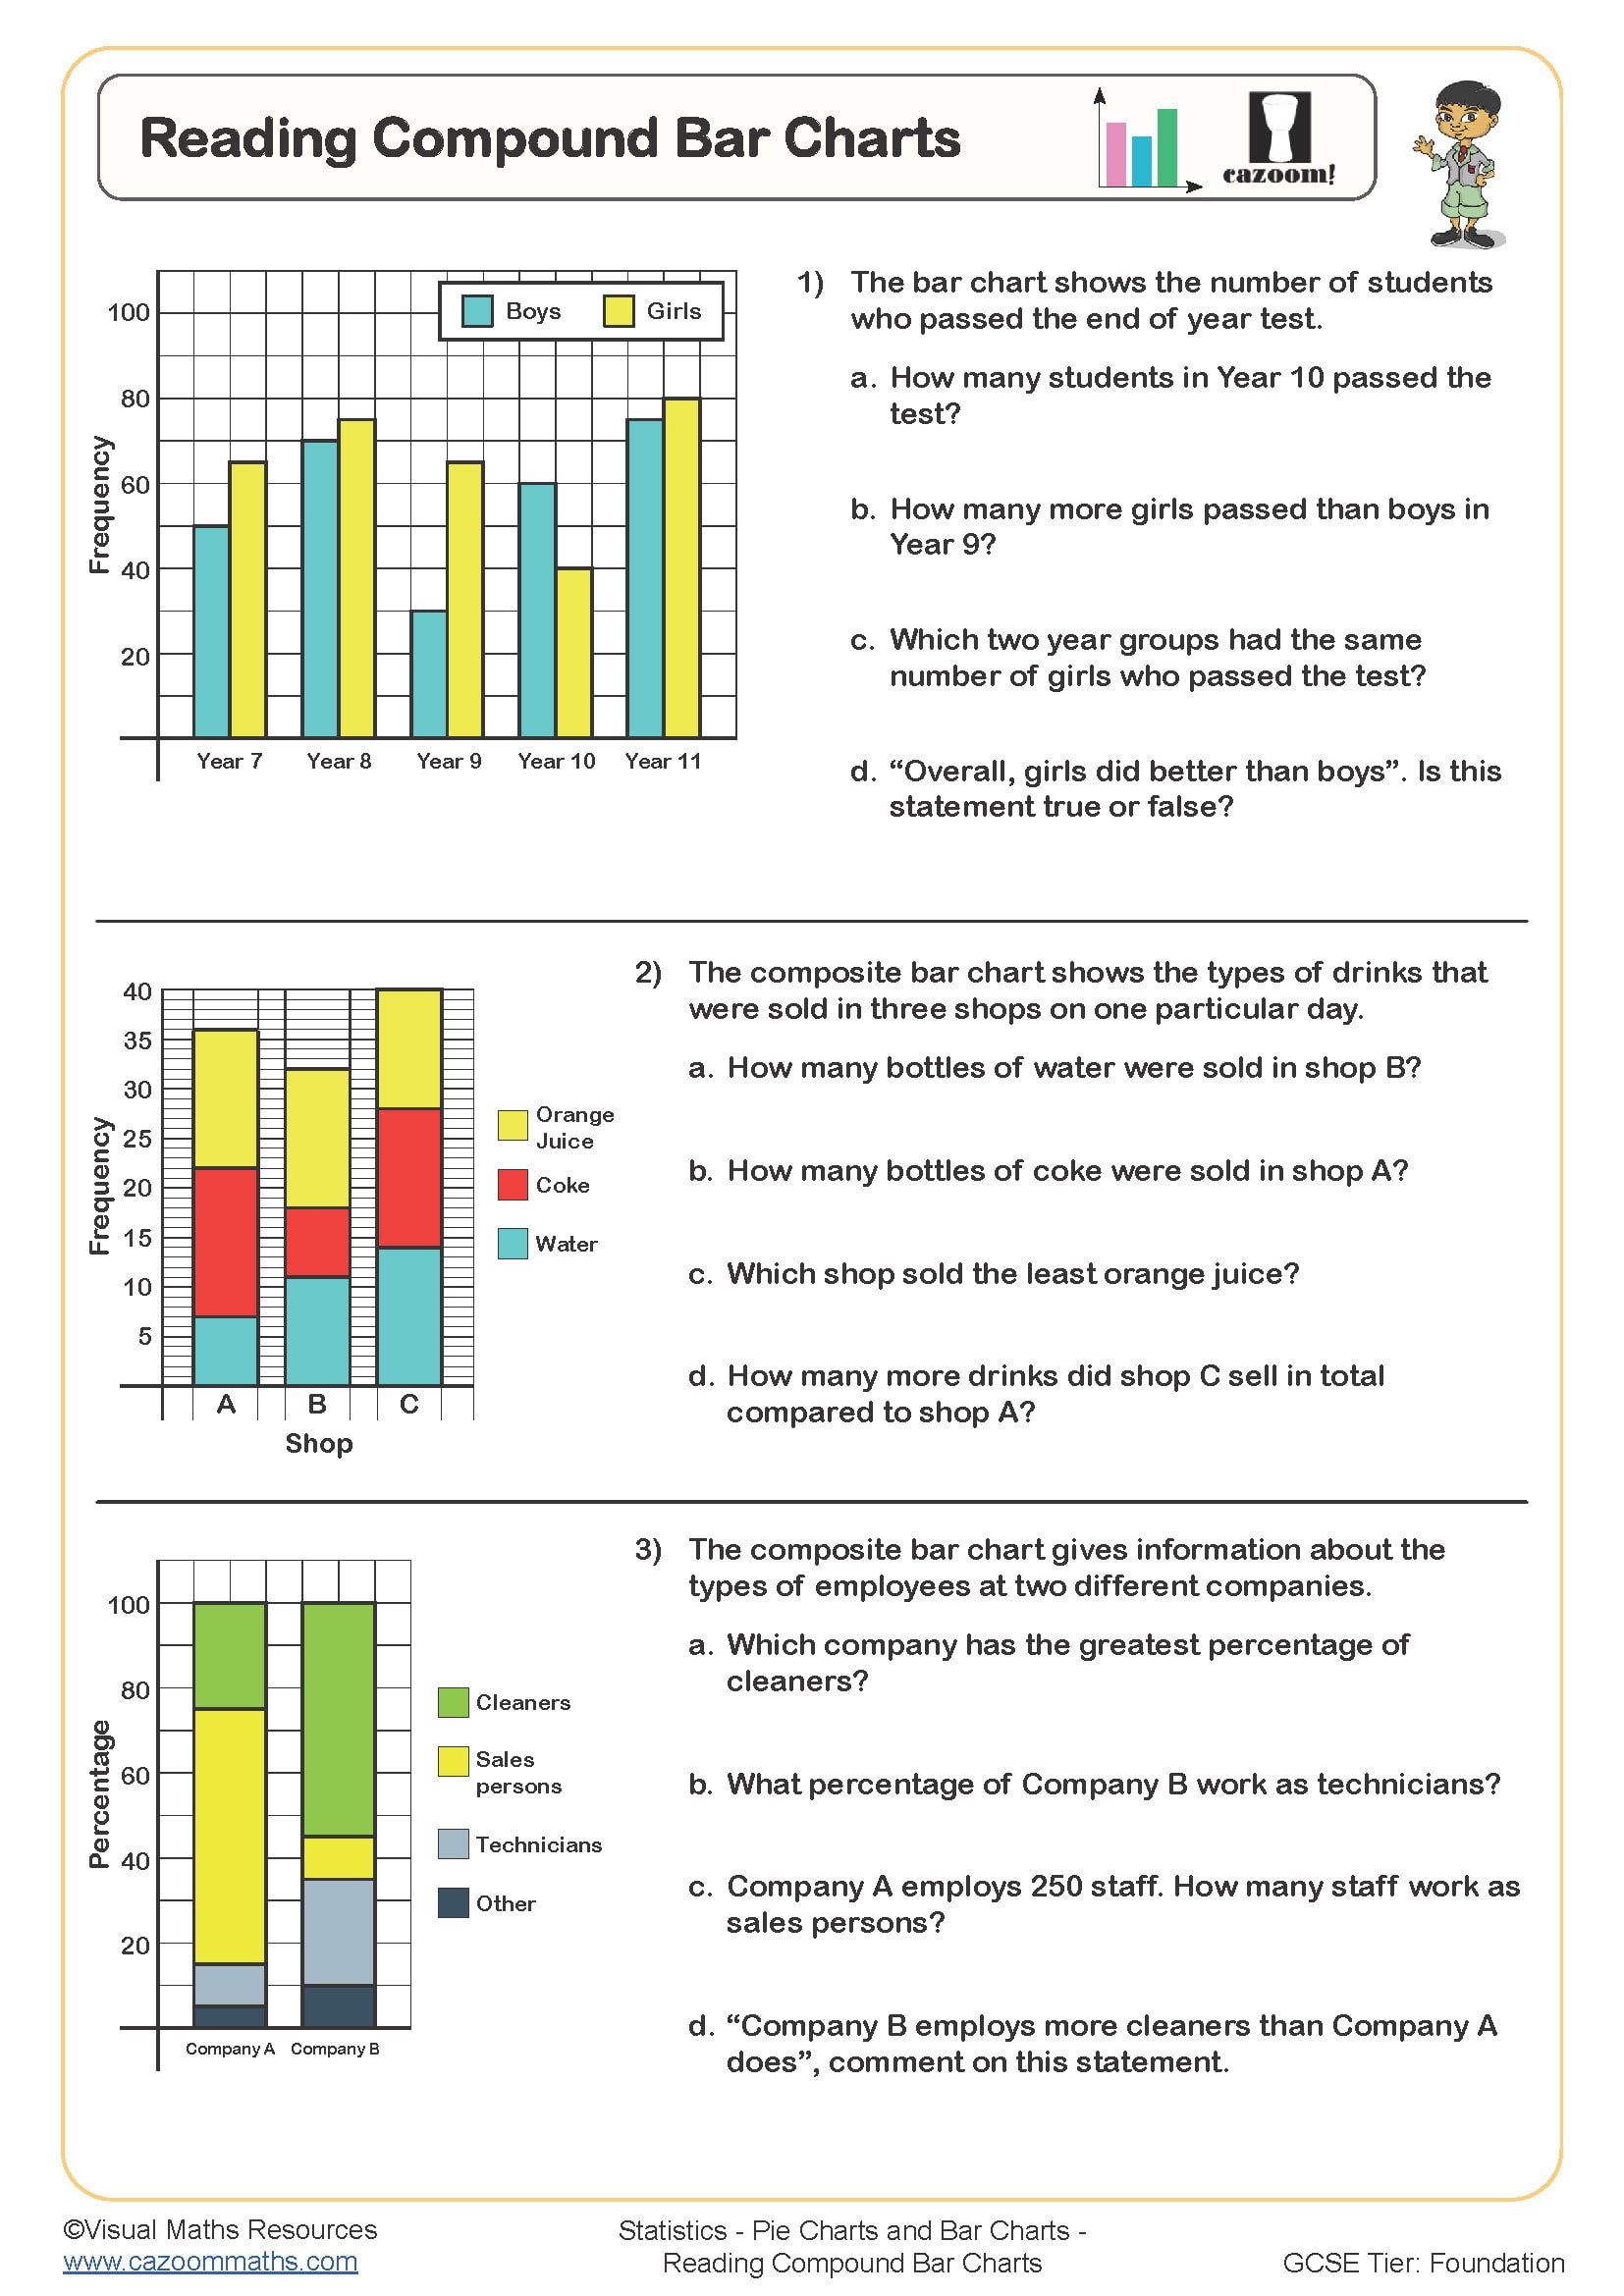
Reading Compound Bar Charts
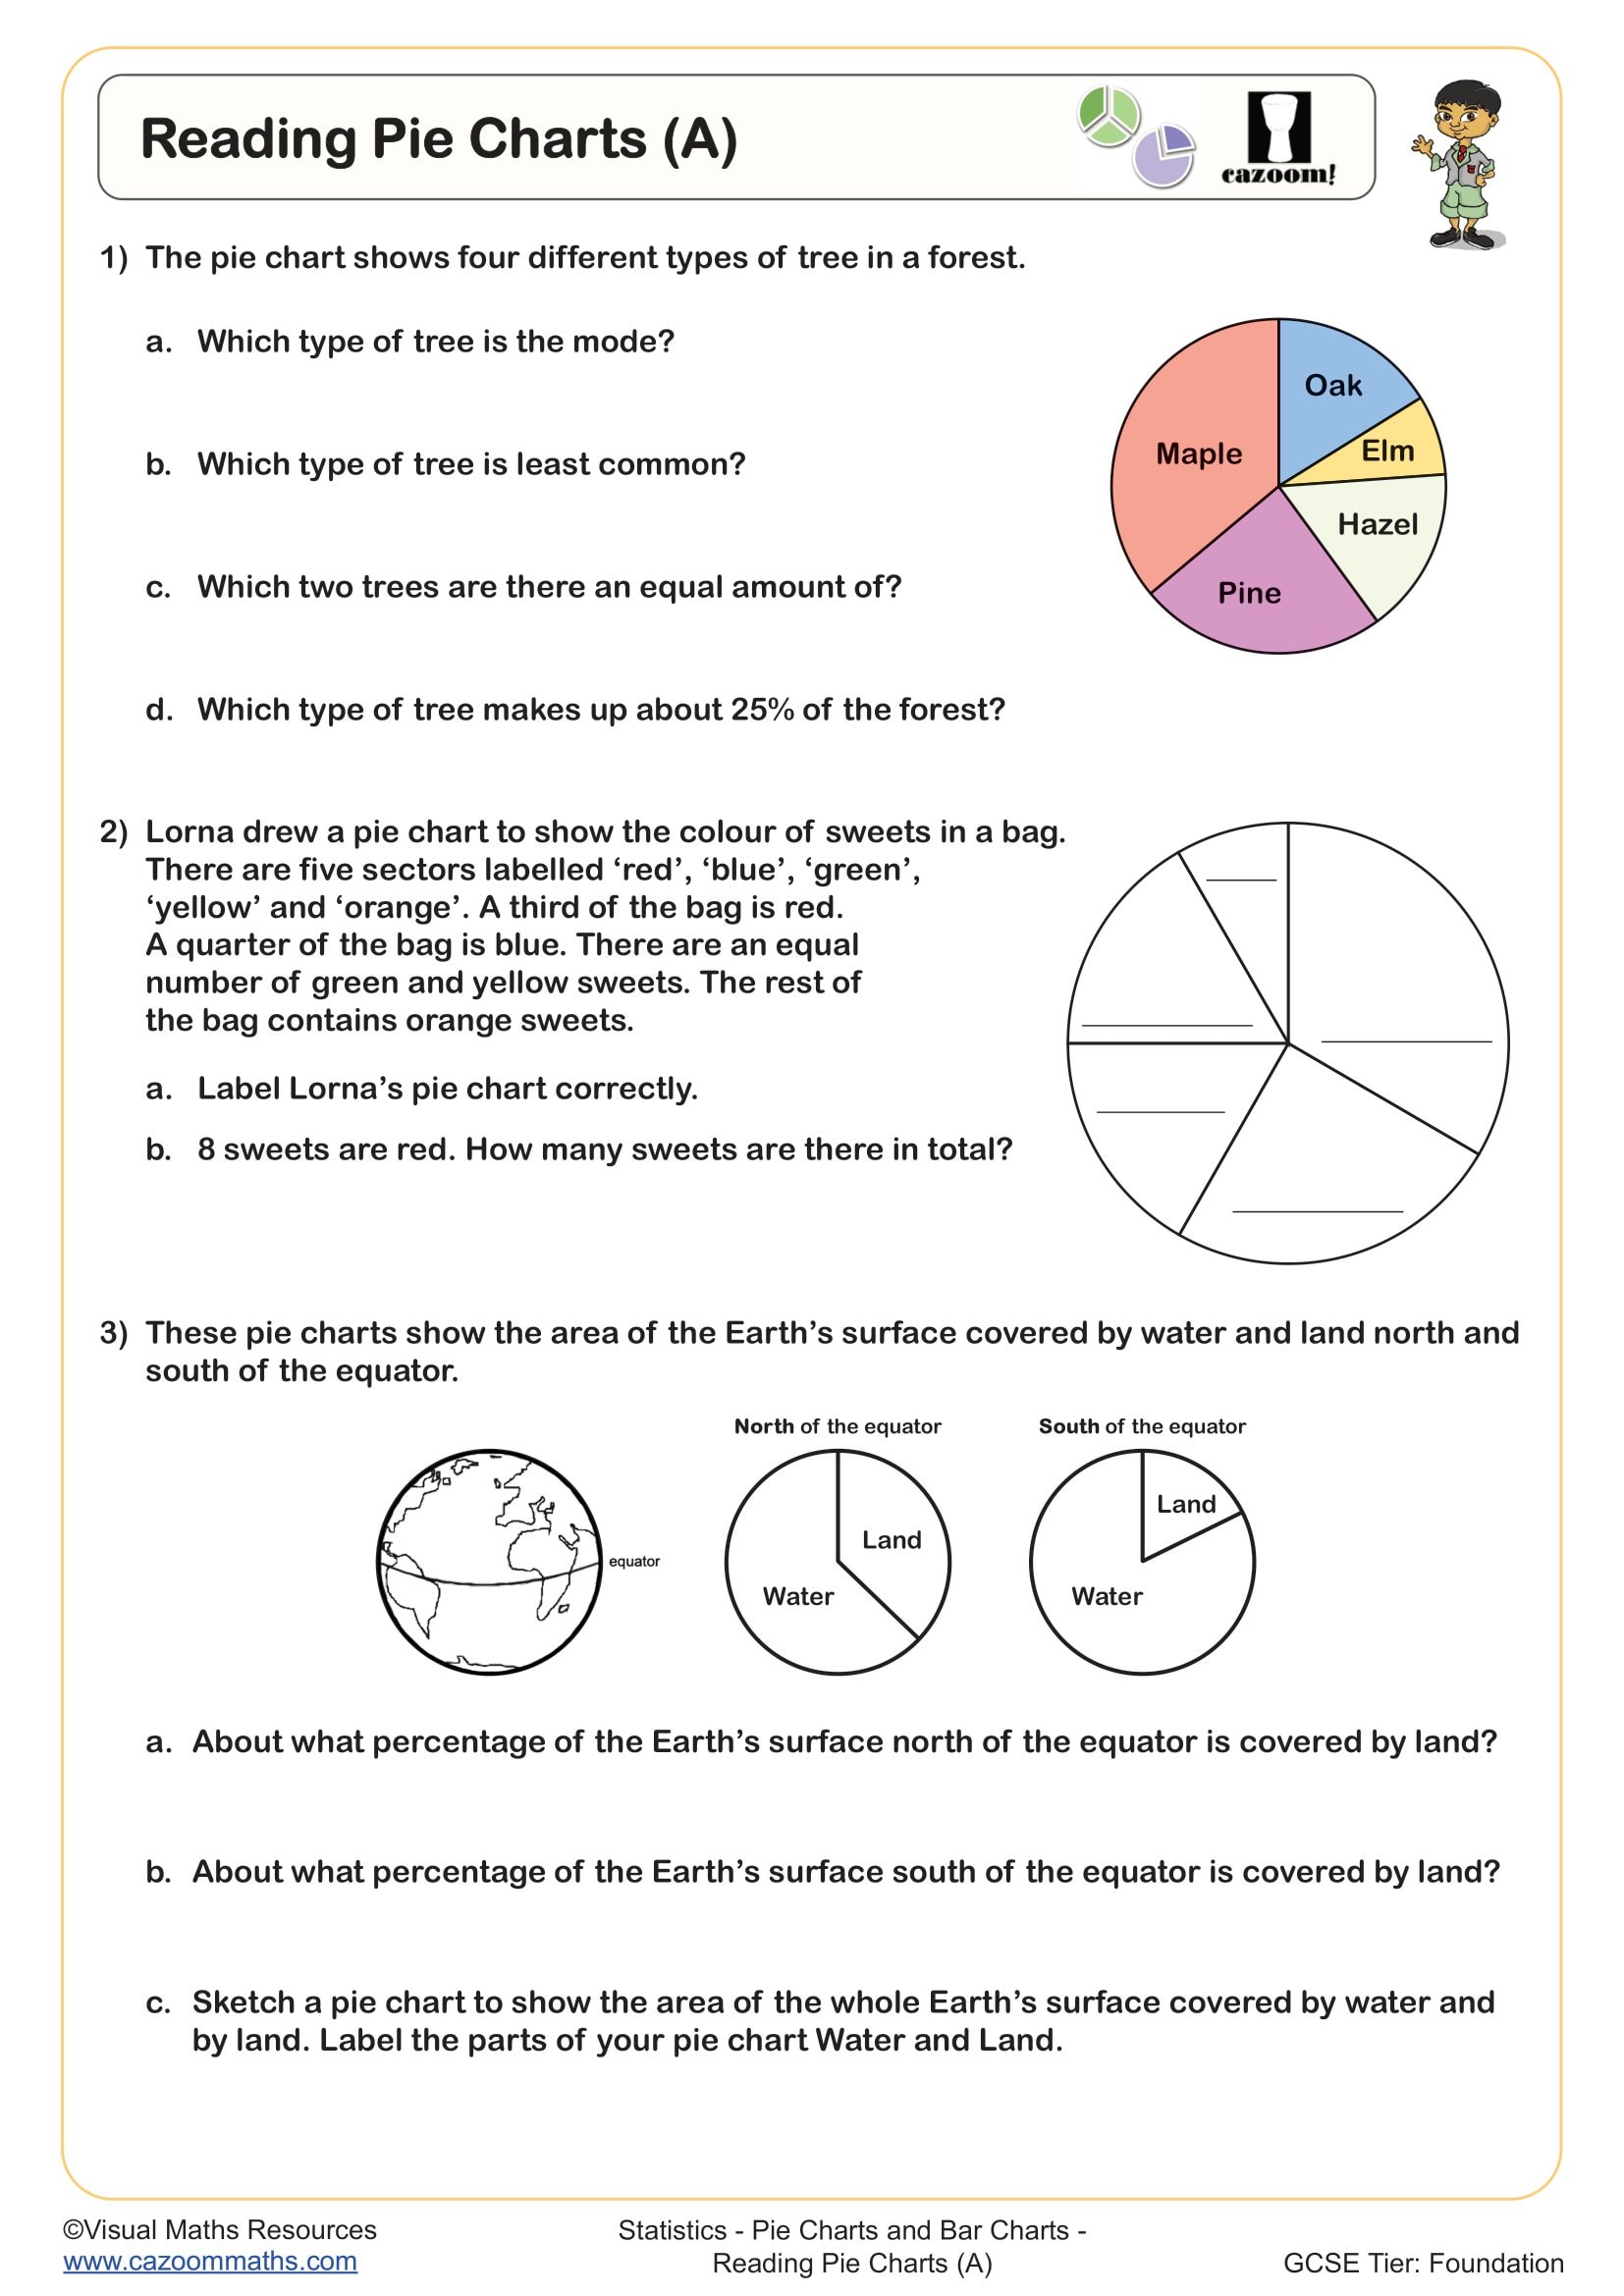
Reading Pie Charts (A)
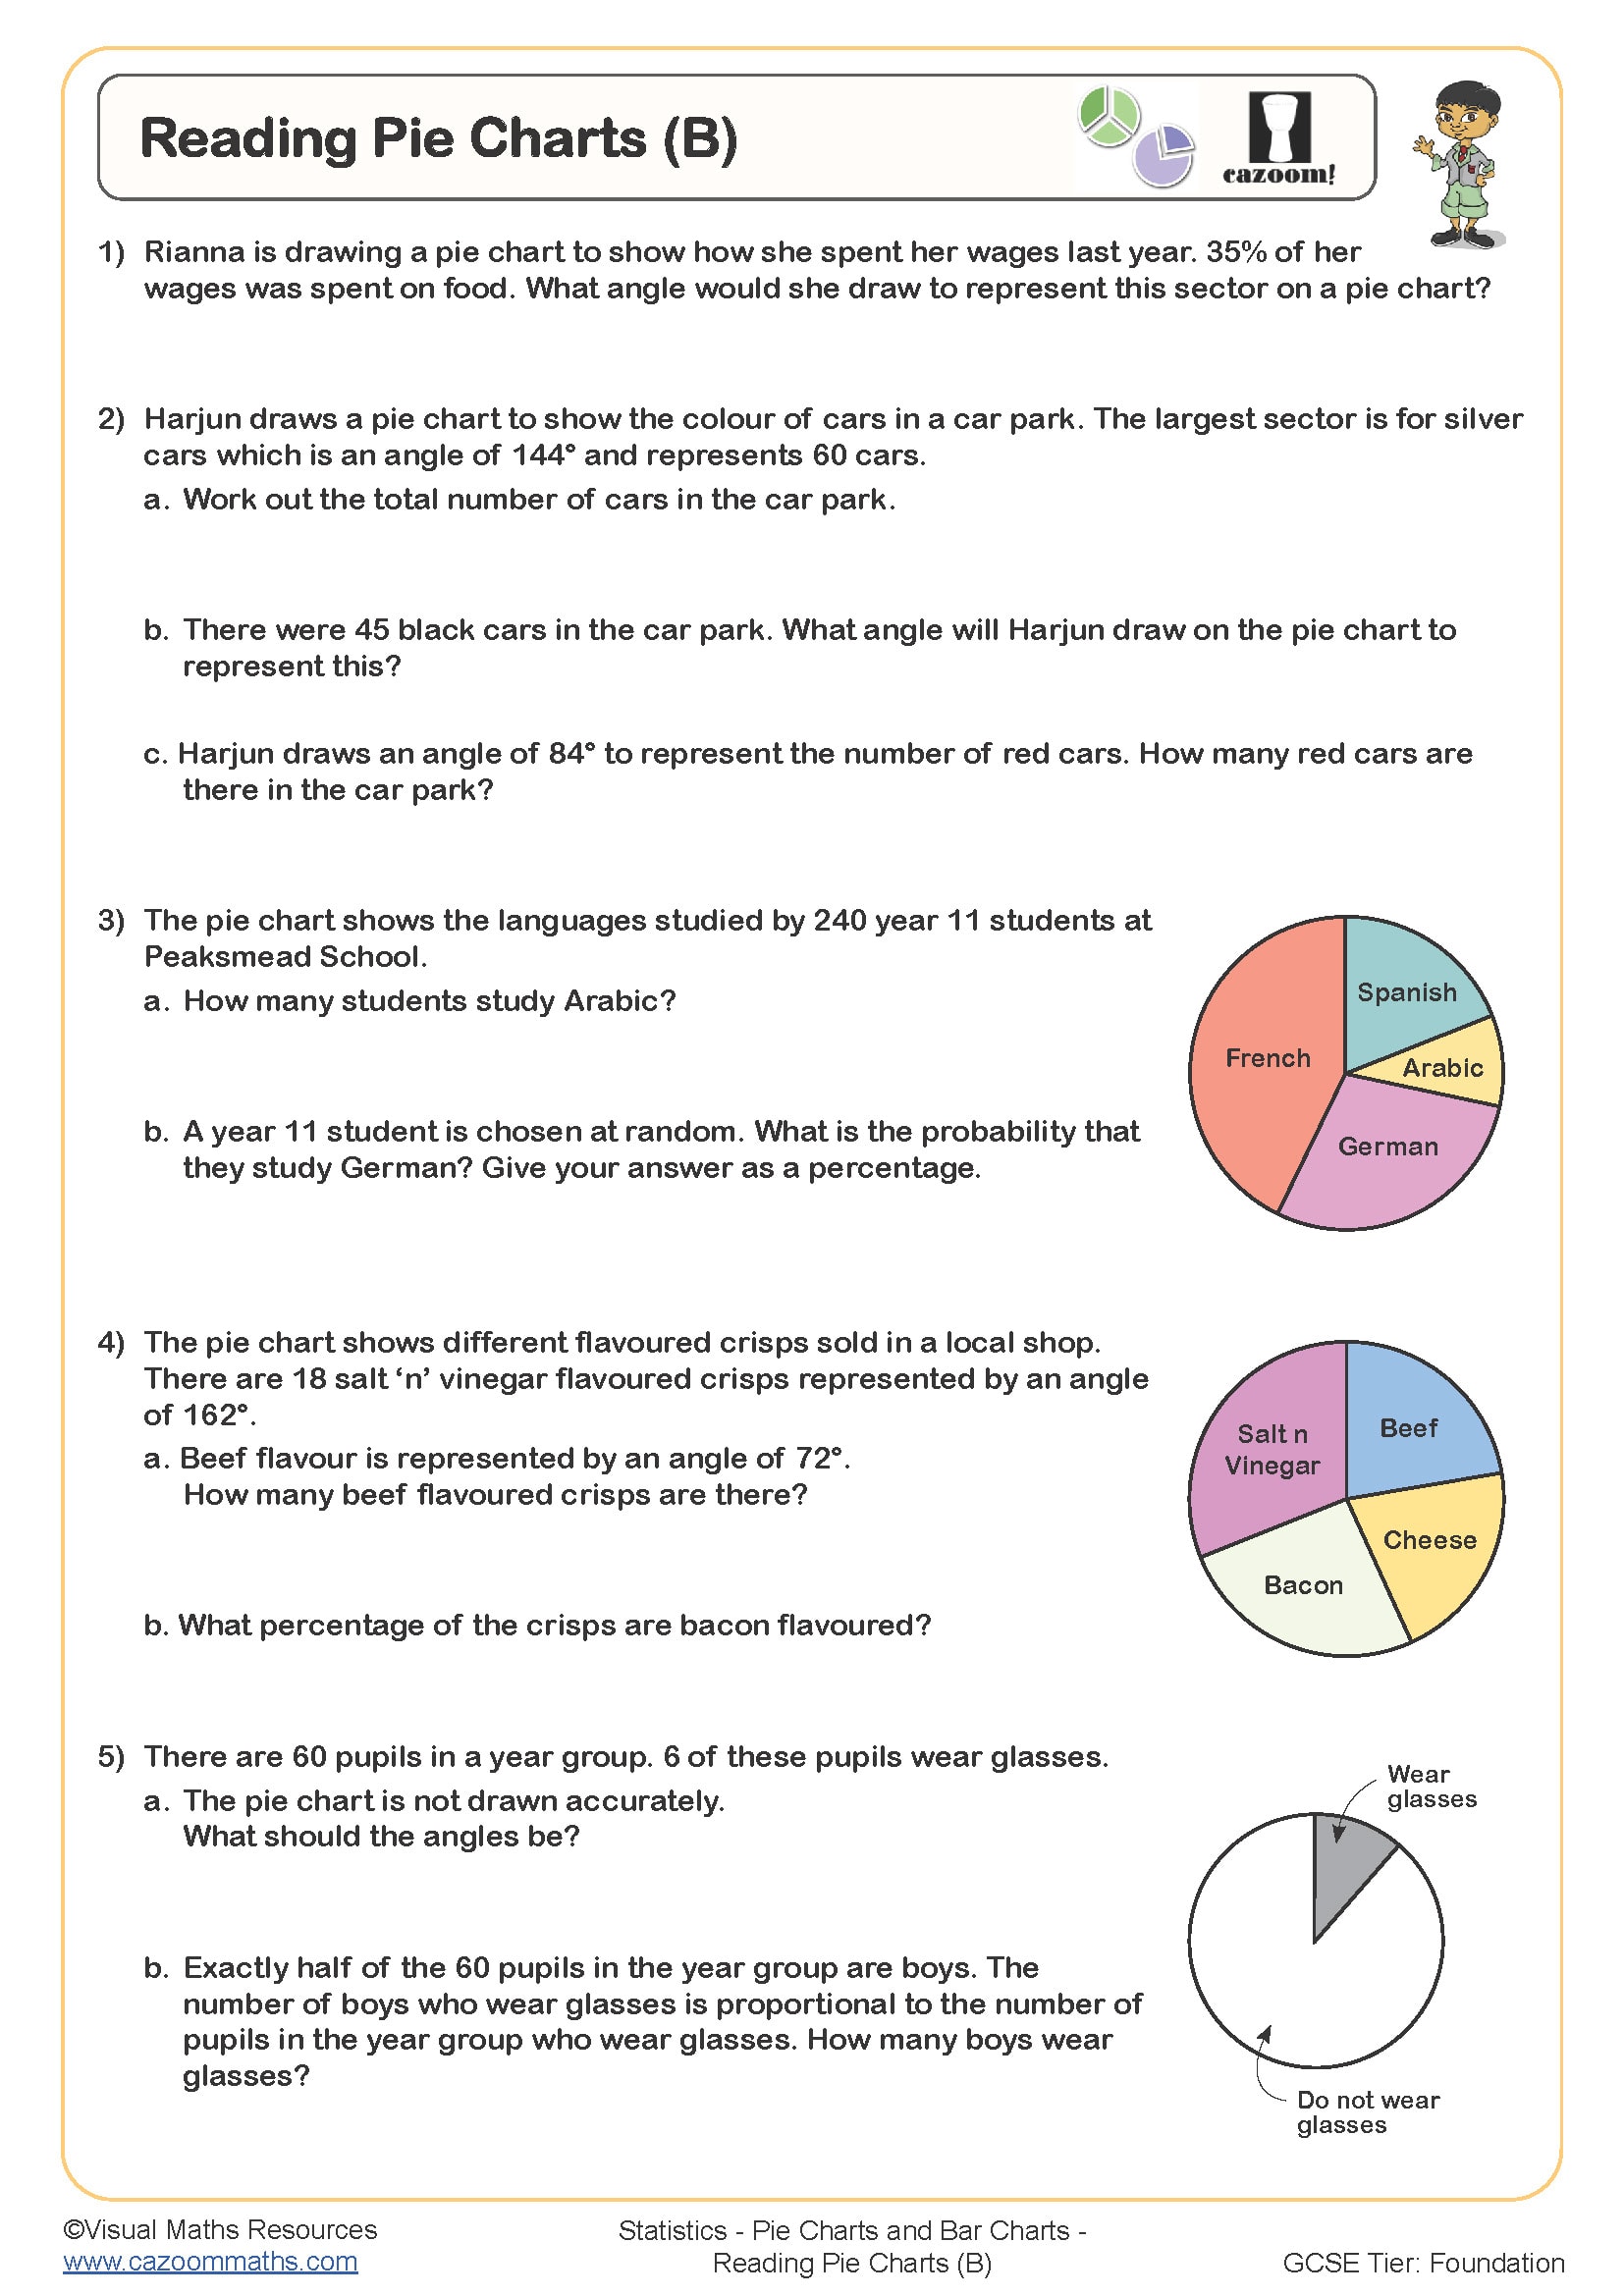
Reading Pie Charts (B)
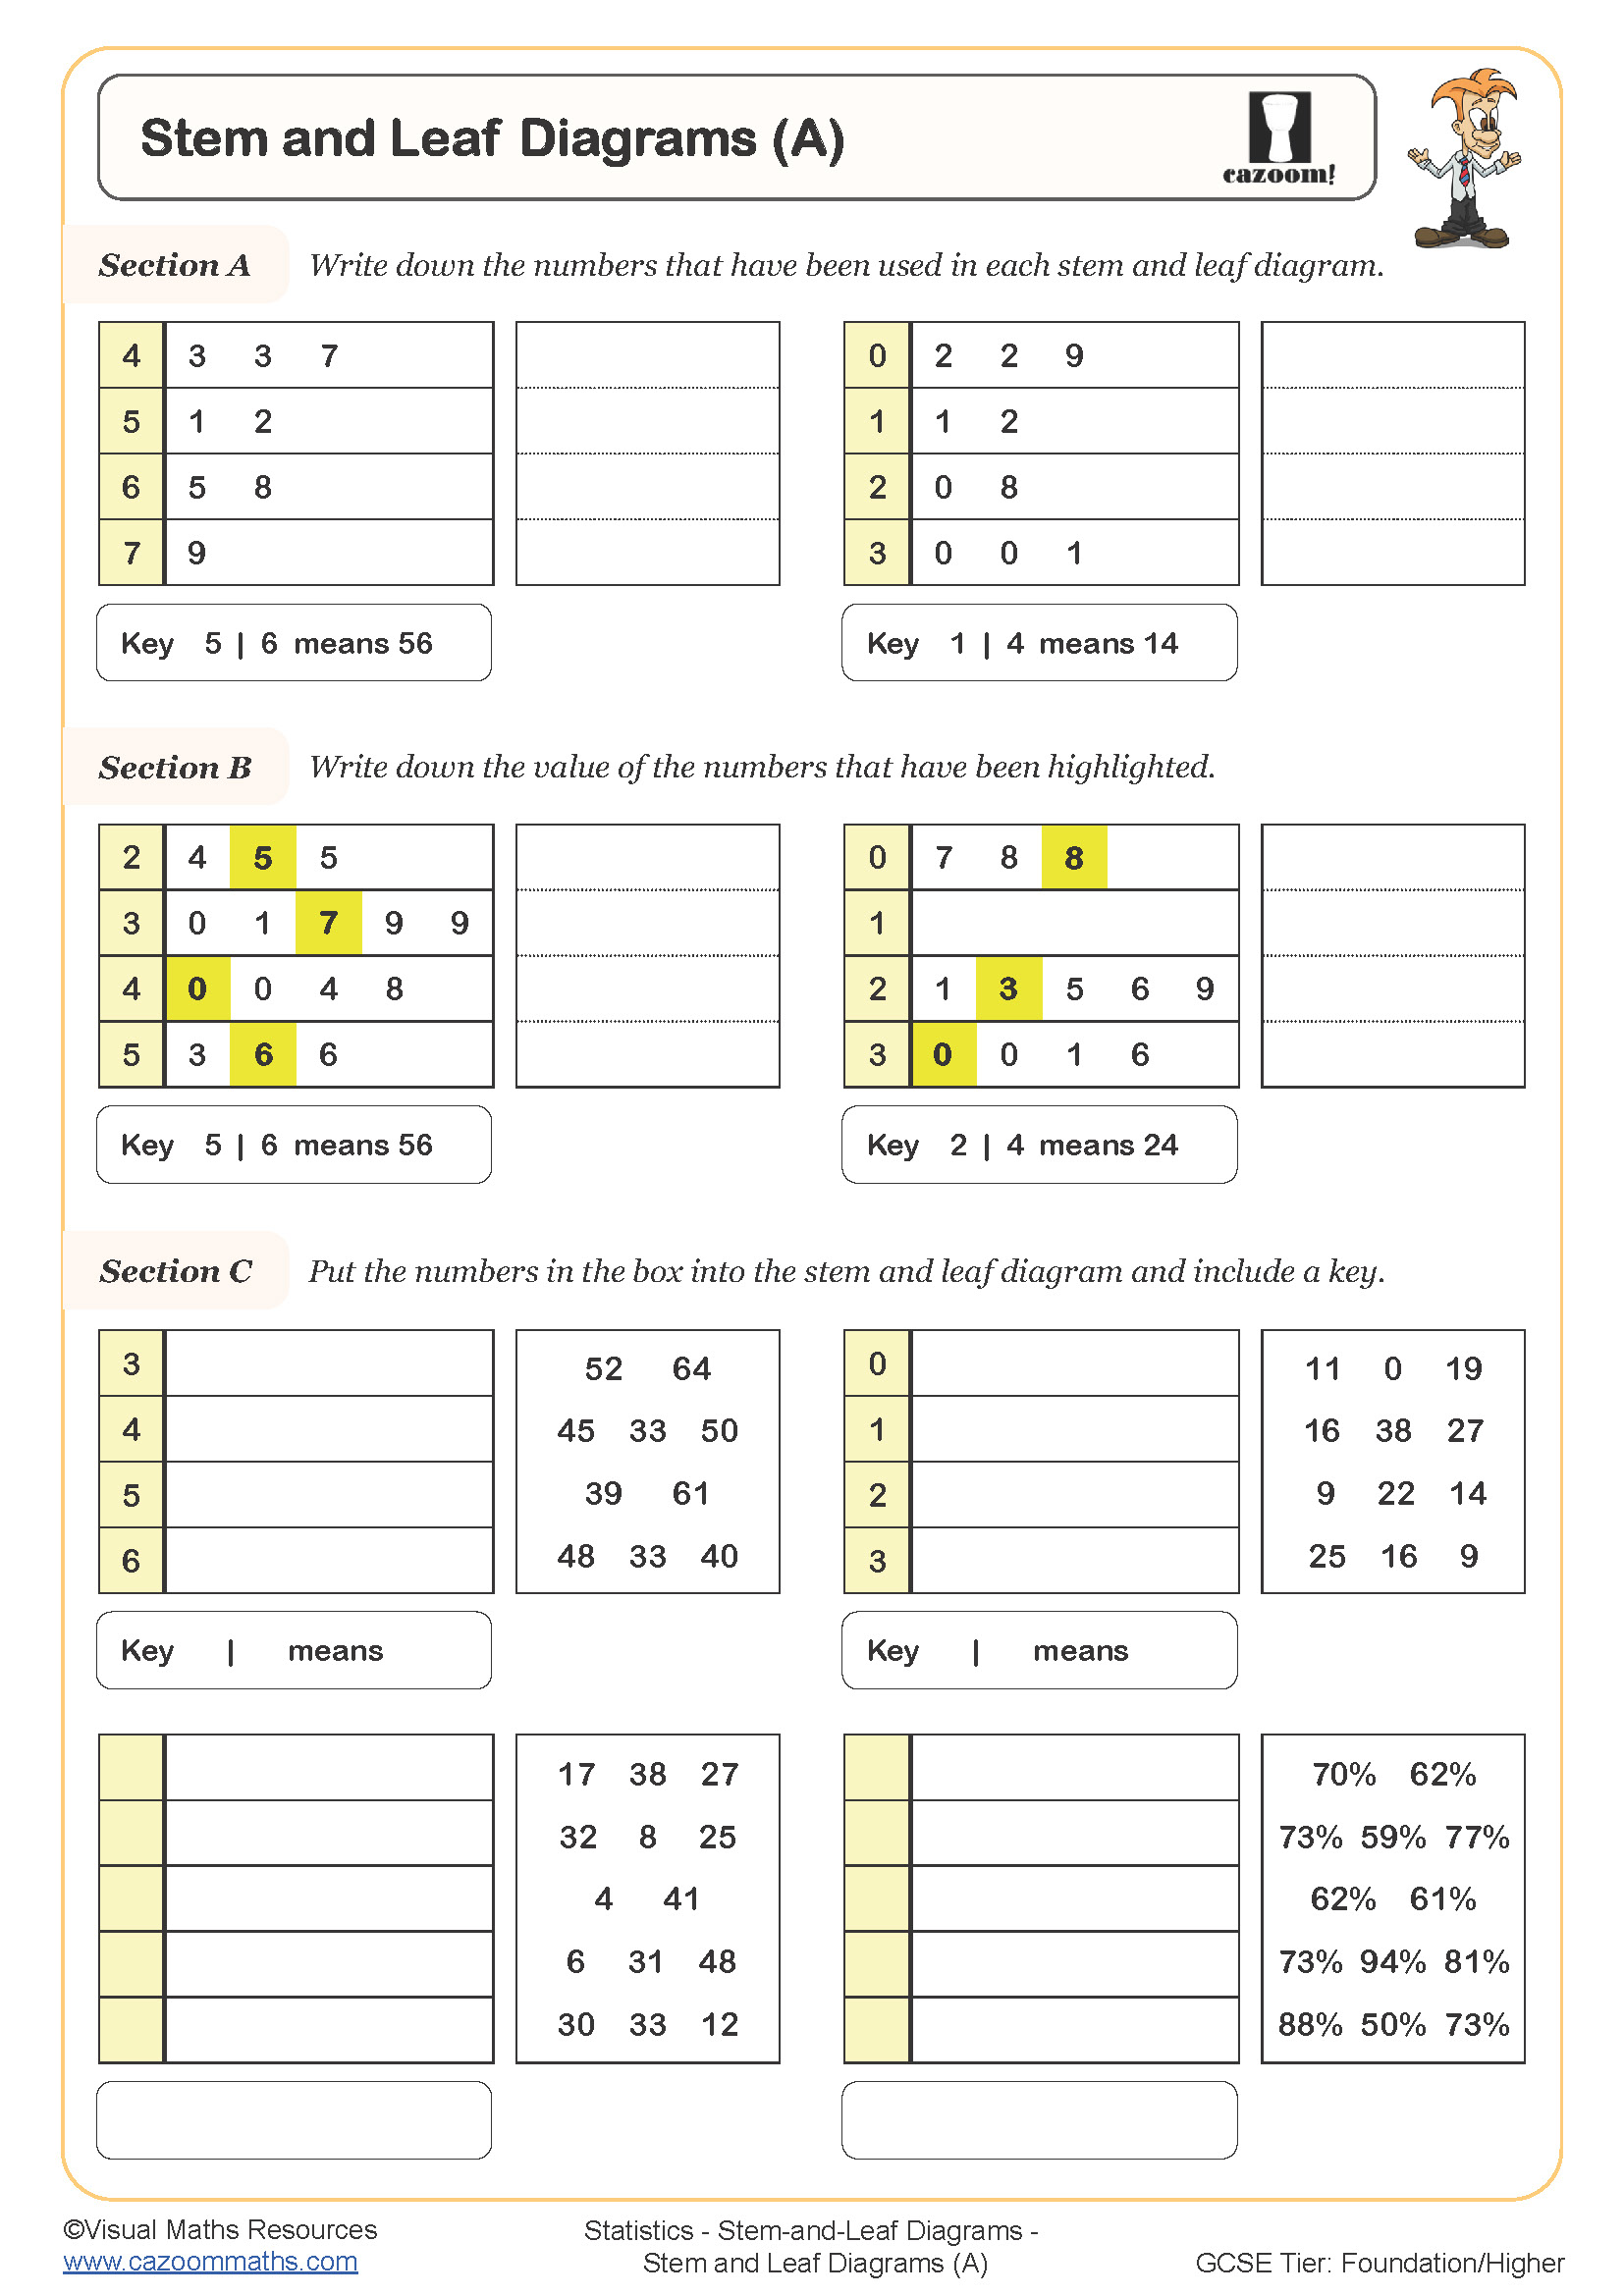
Stem and Leaf Diagrams (A)
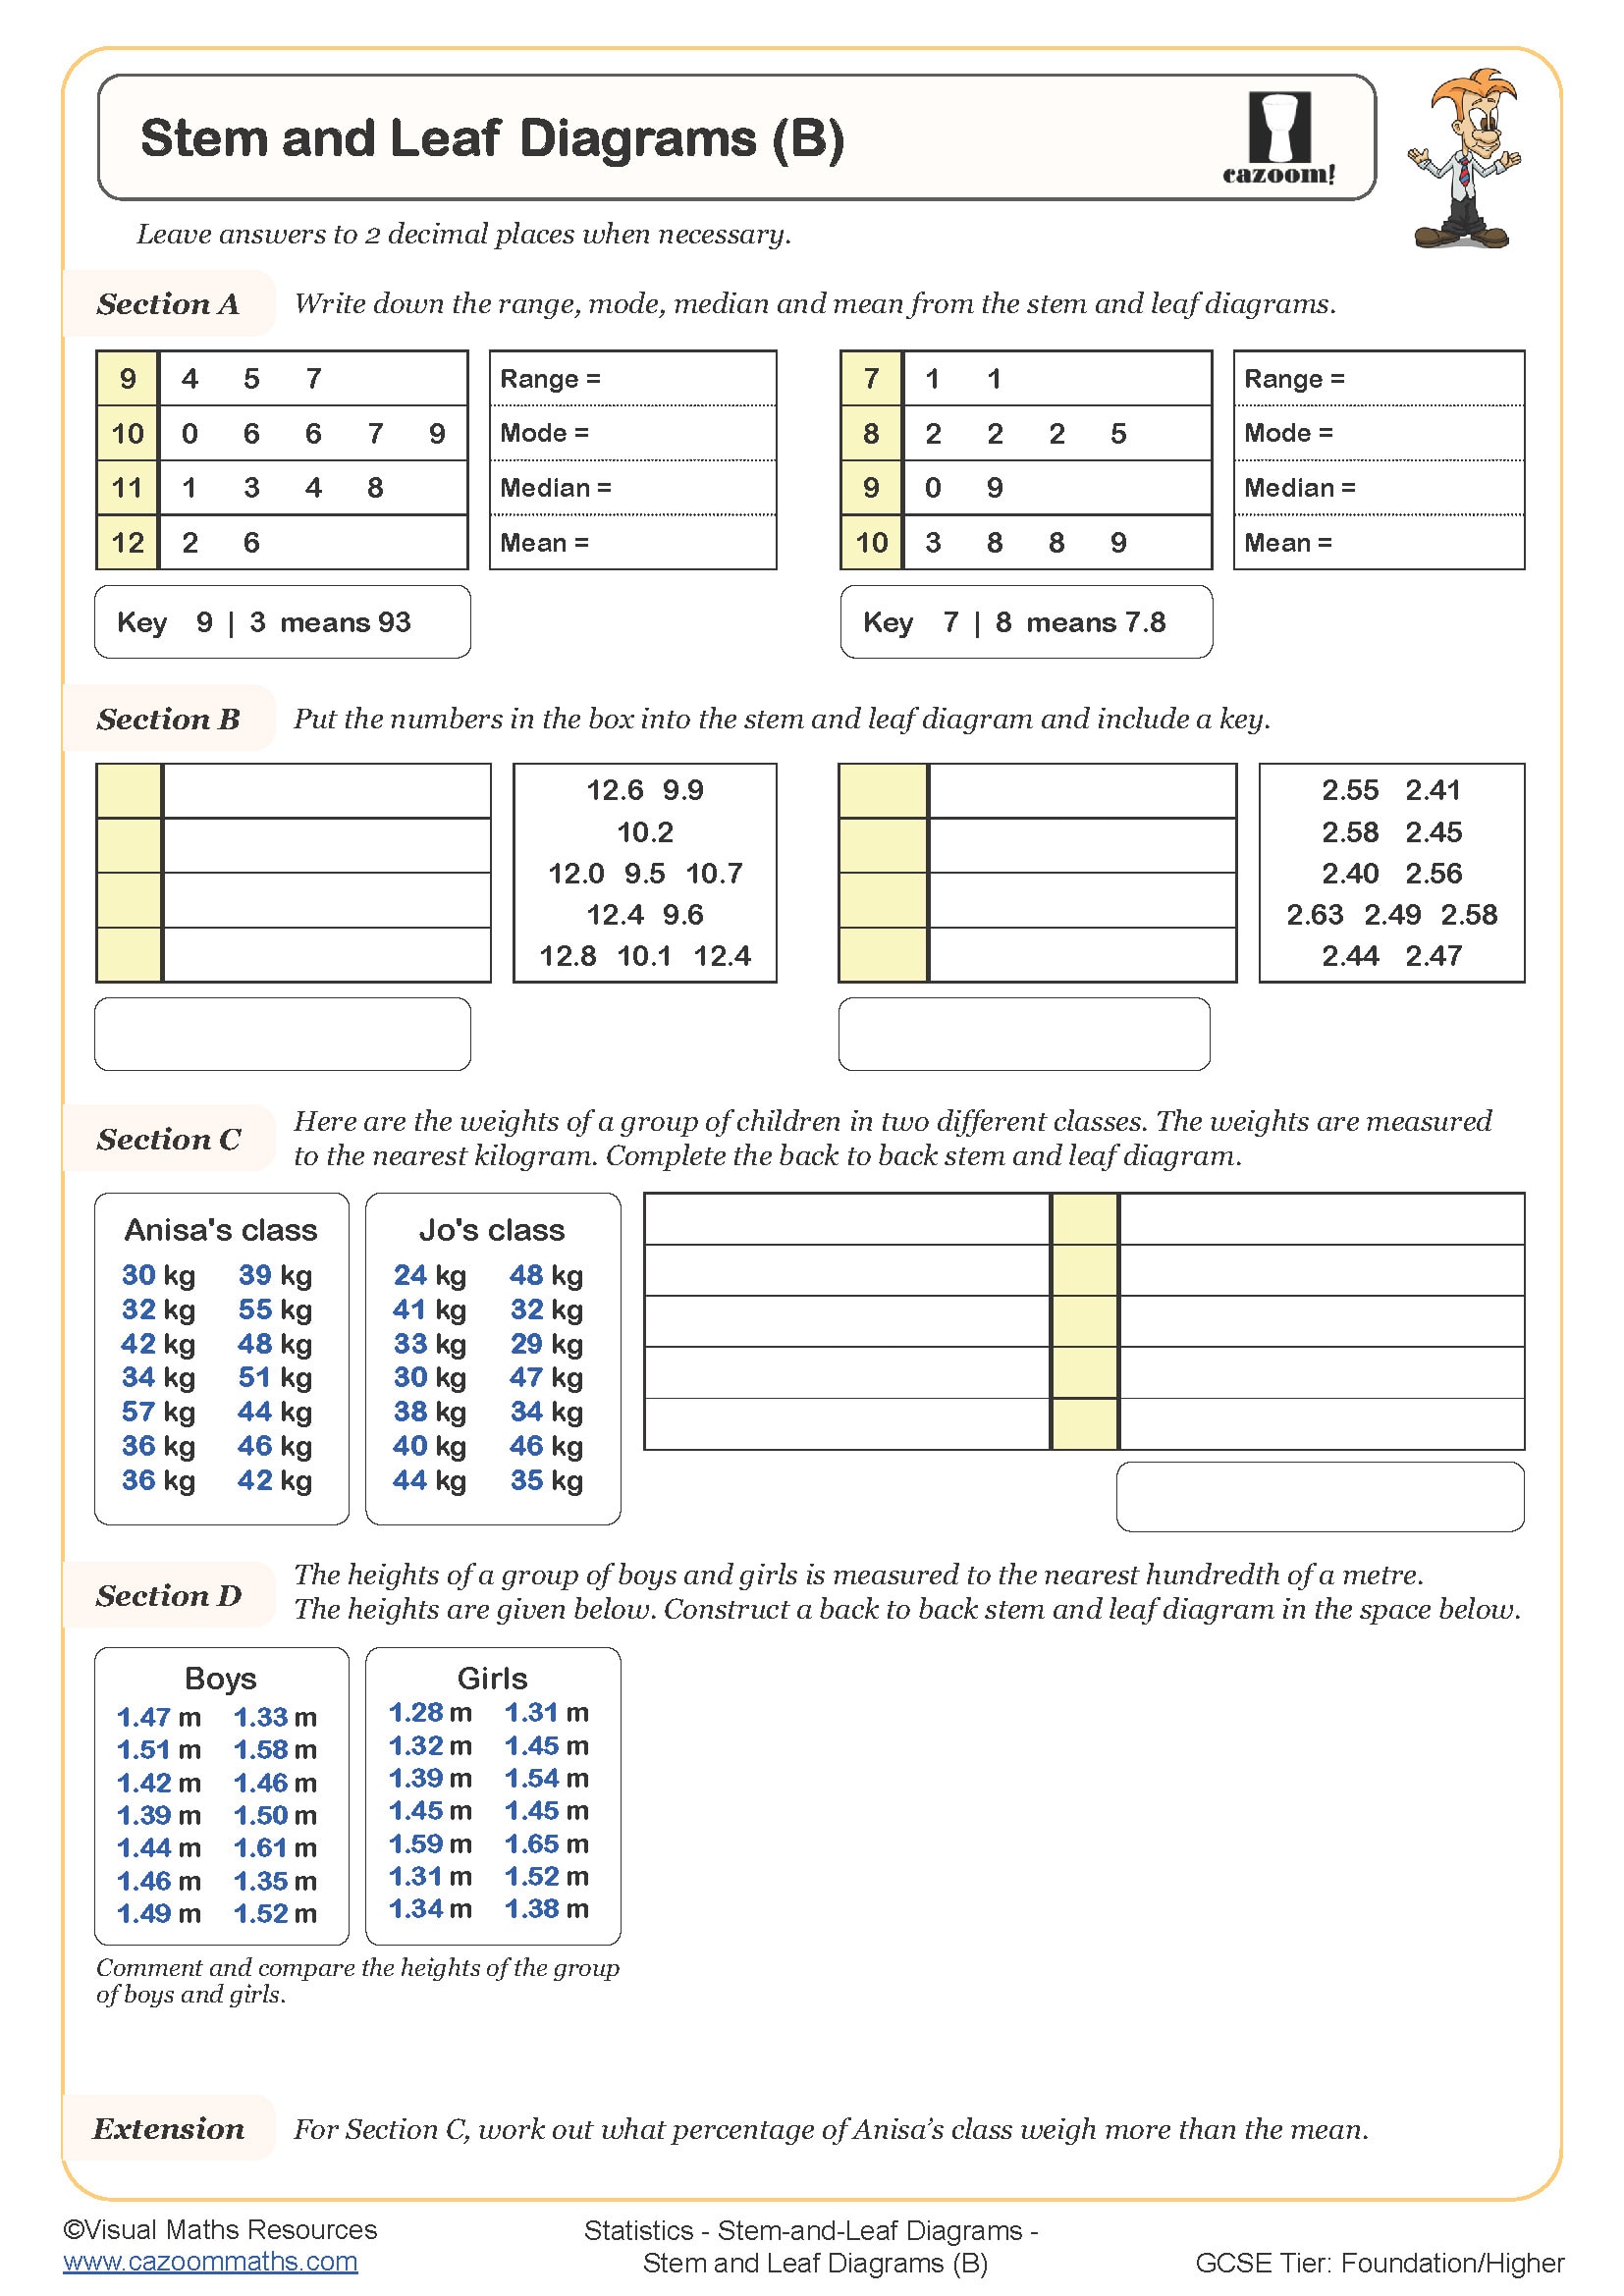
Stem and Leaf Diagrams (B)
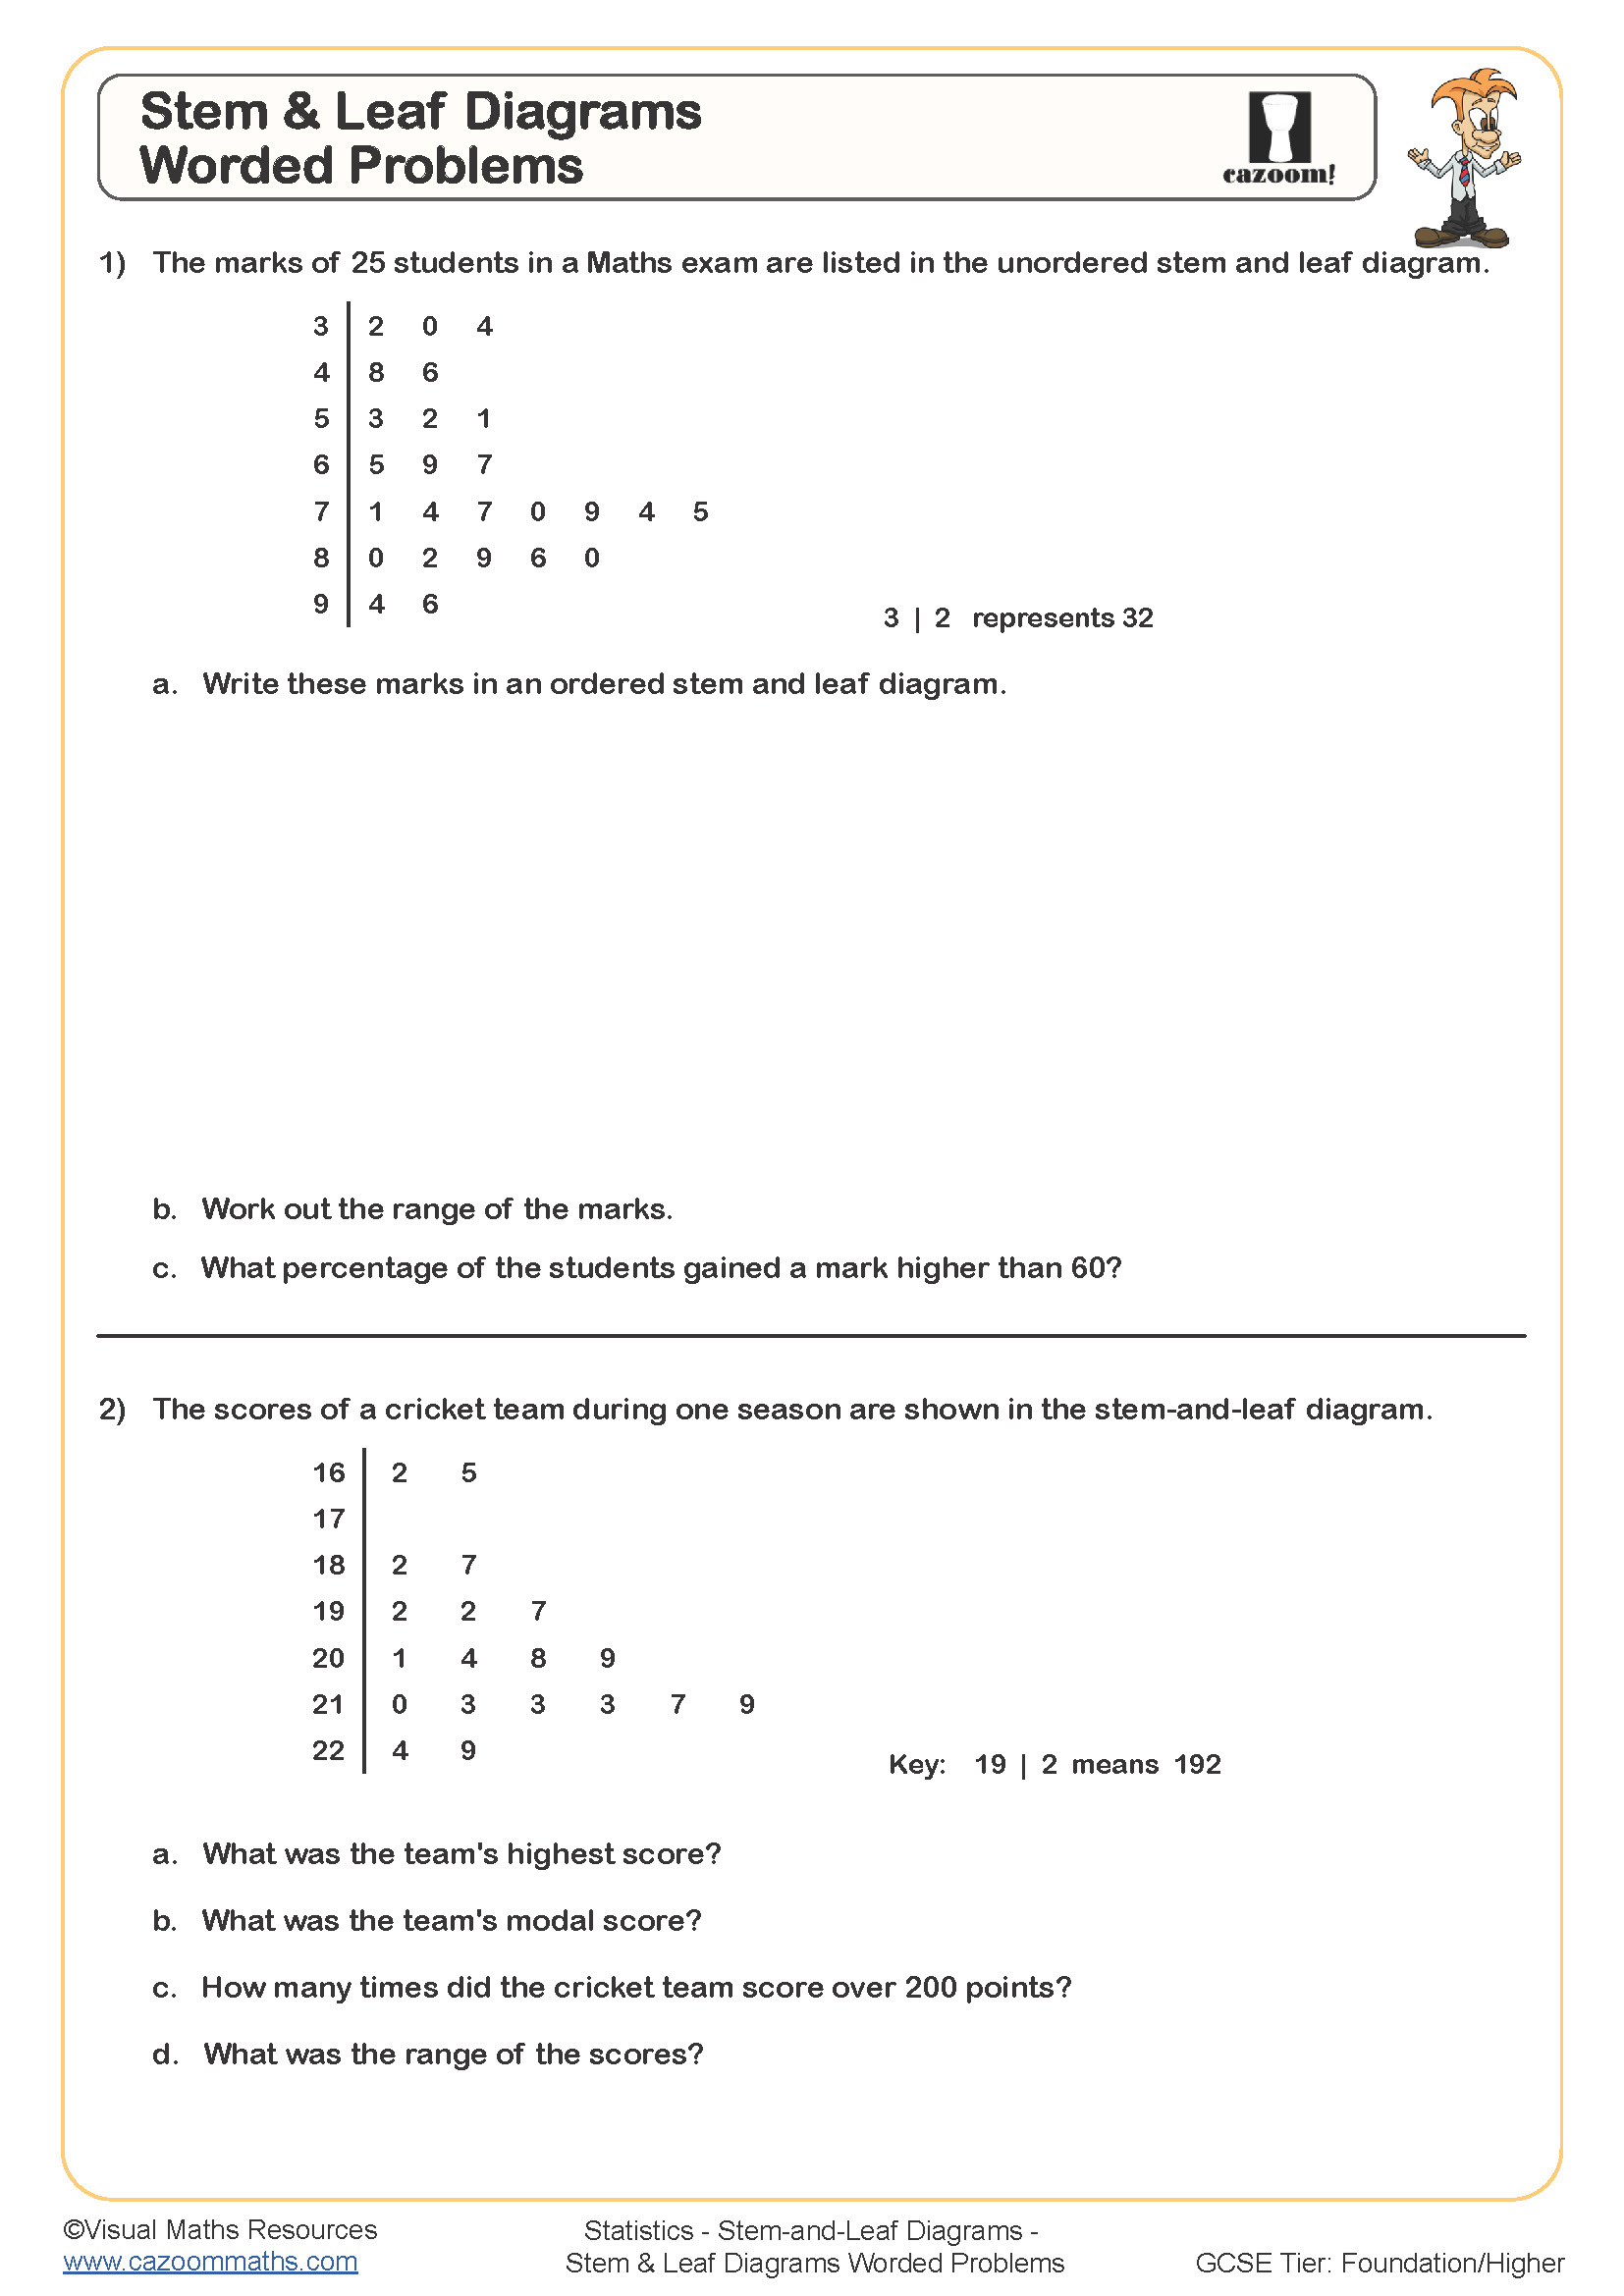
Stem and Leaf Word Problems
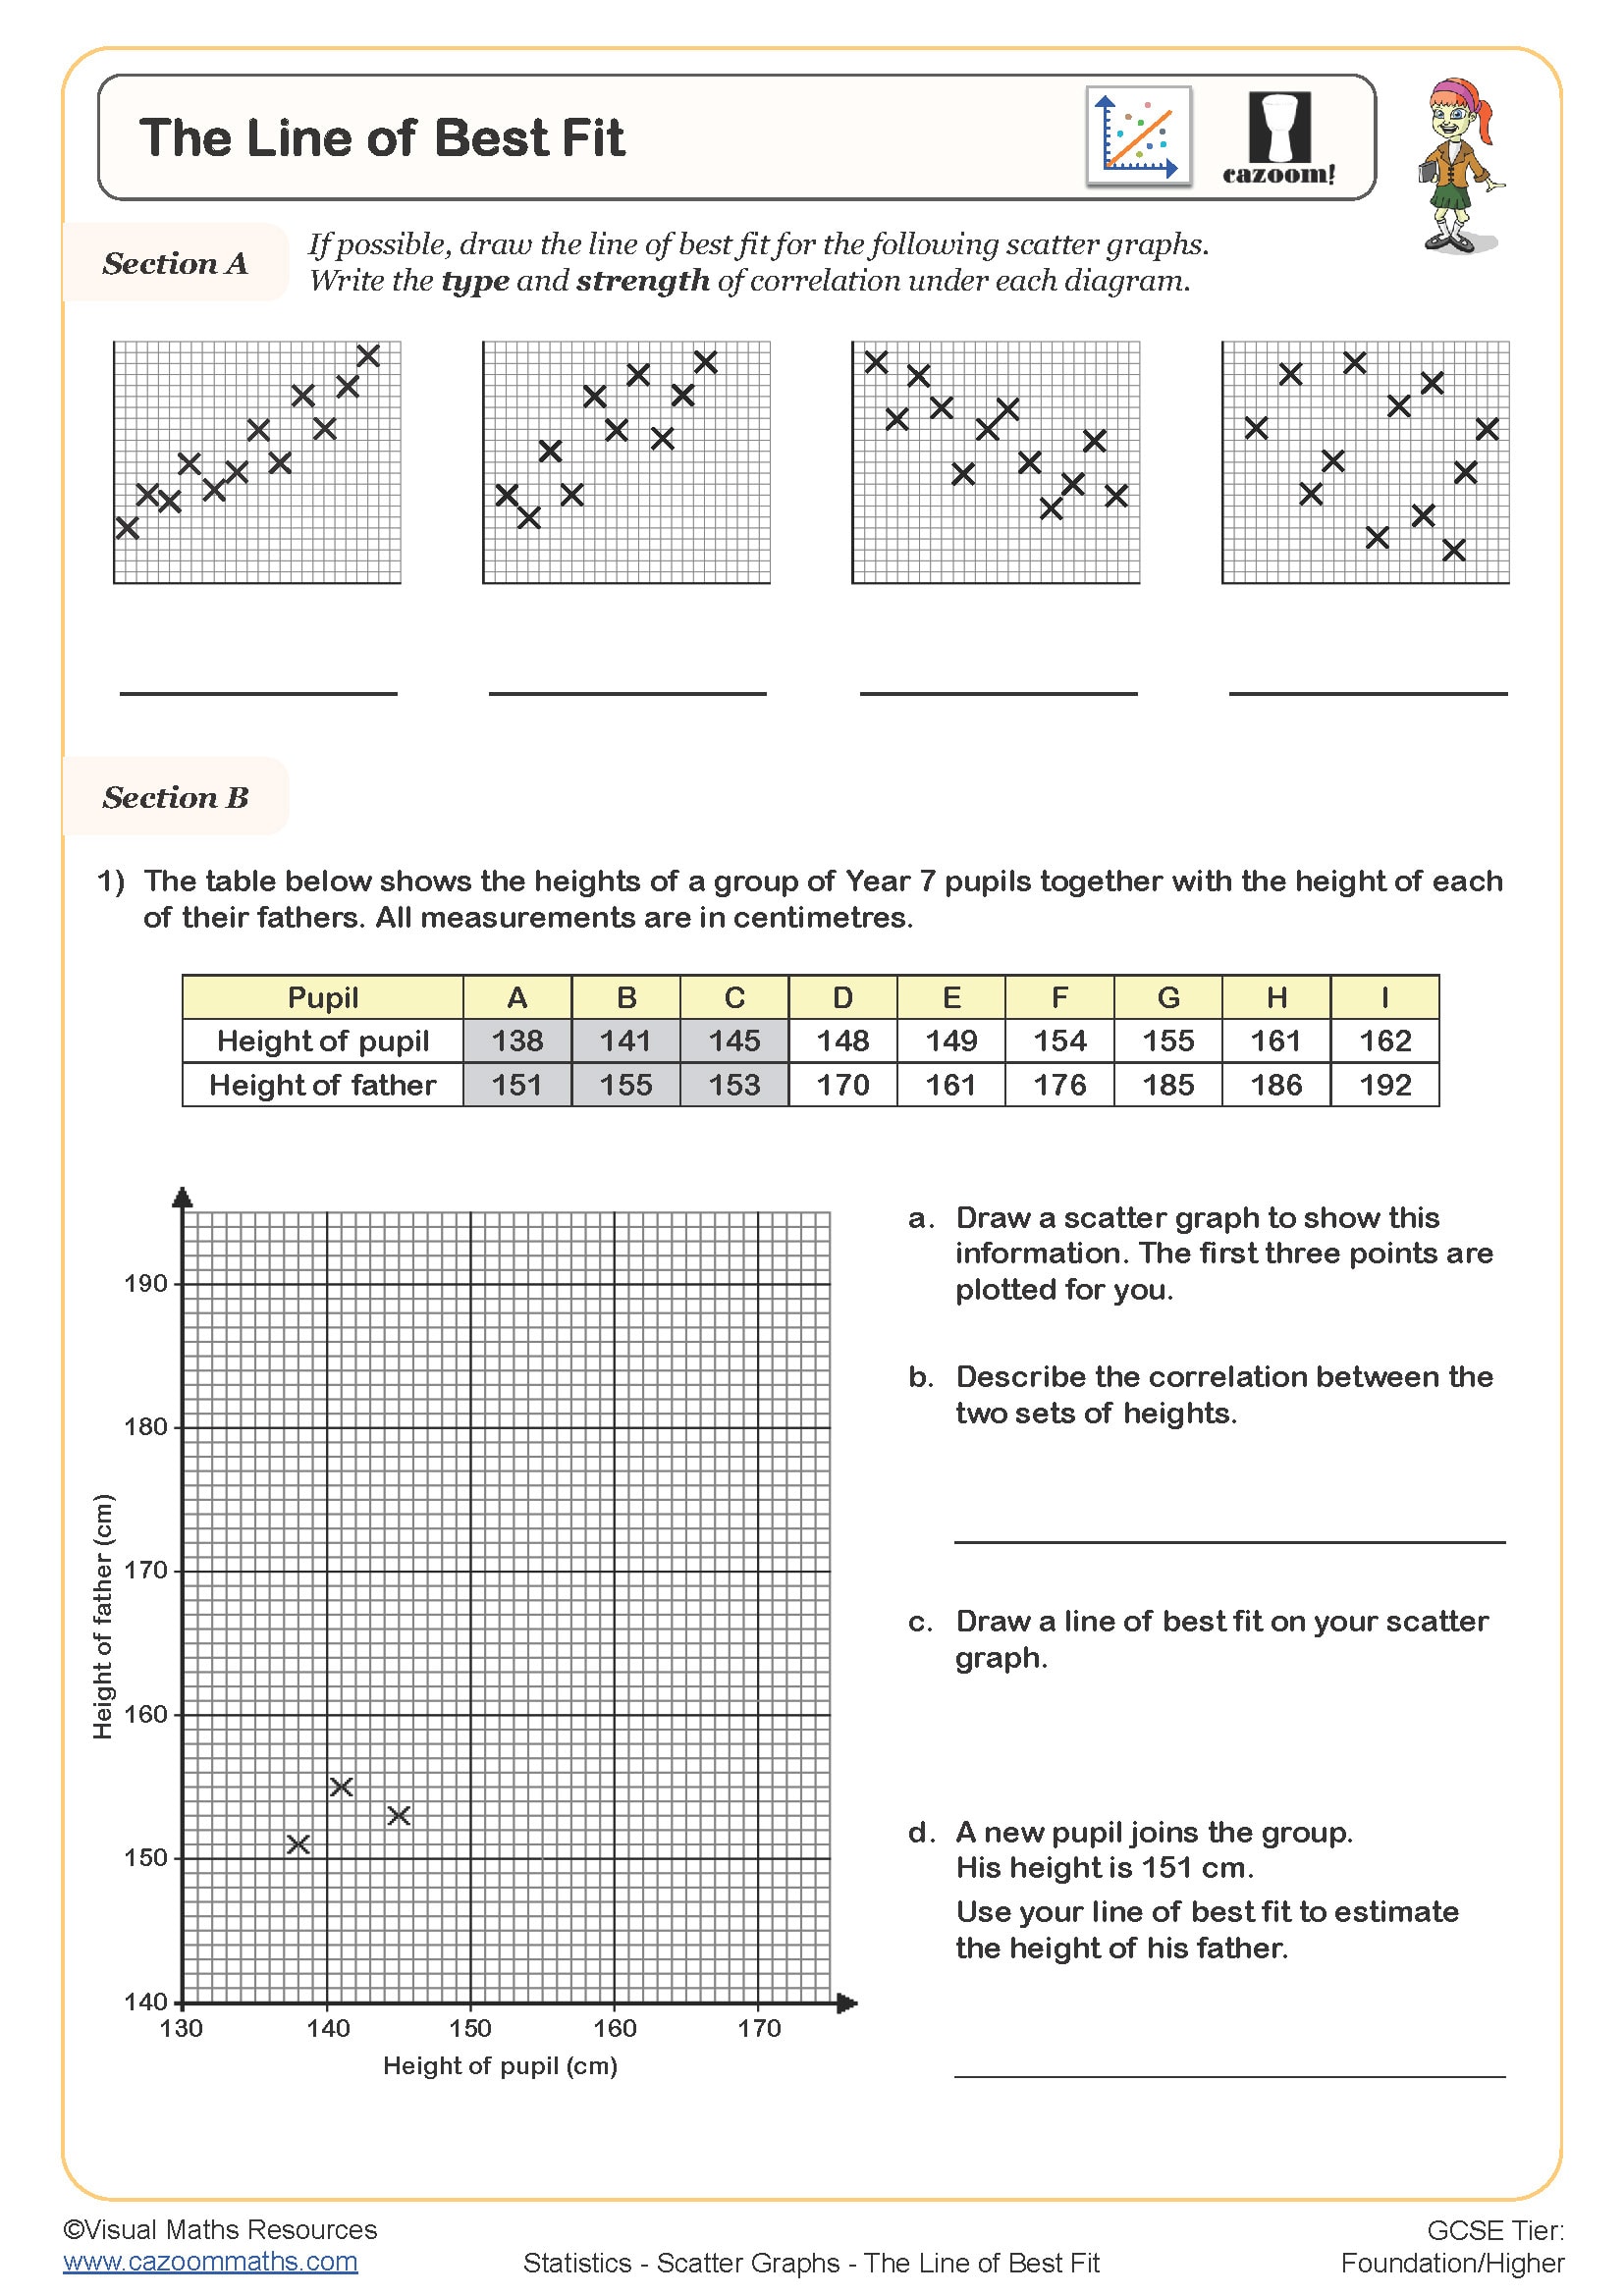
The Line of Best Fit
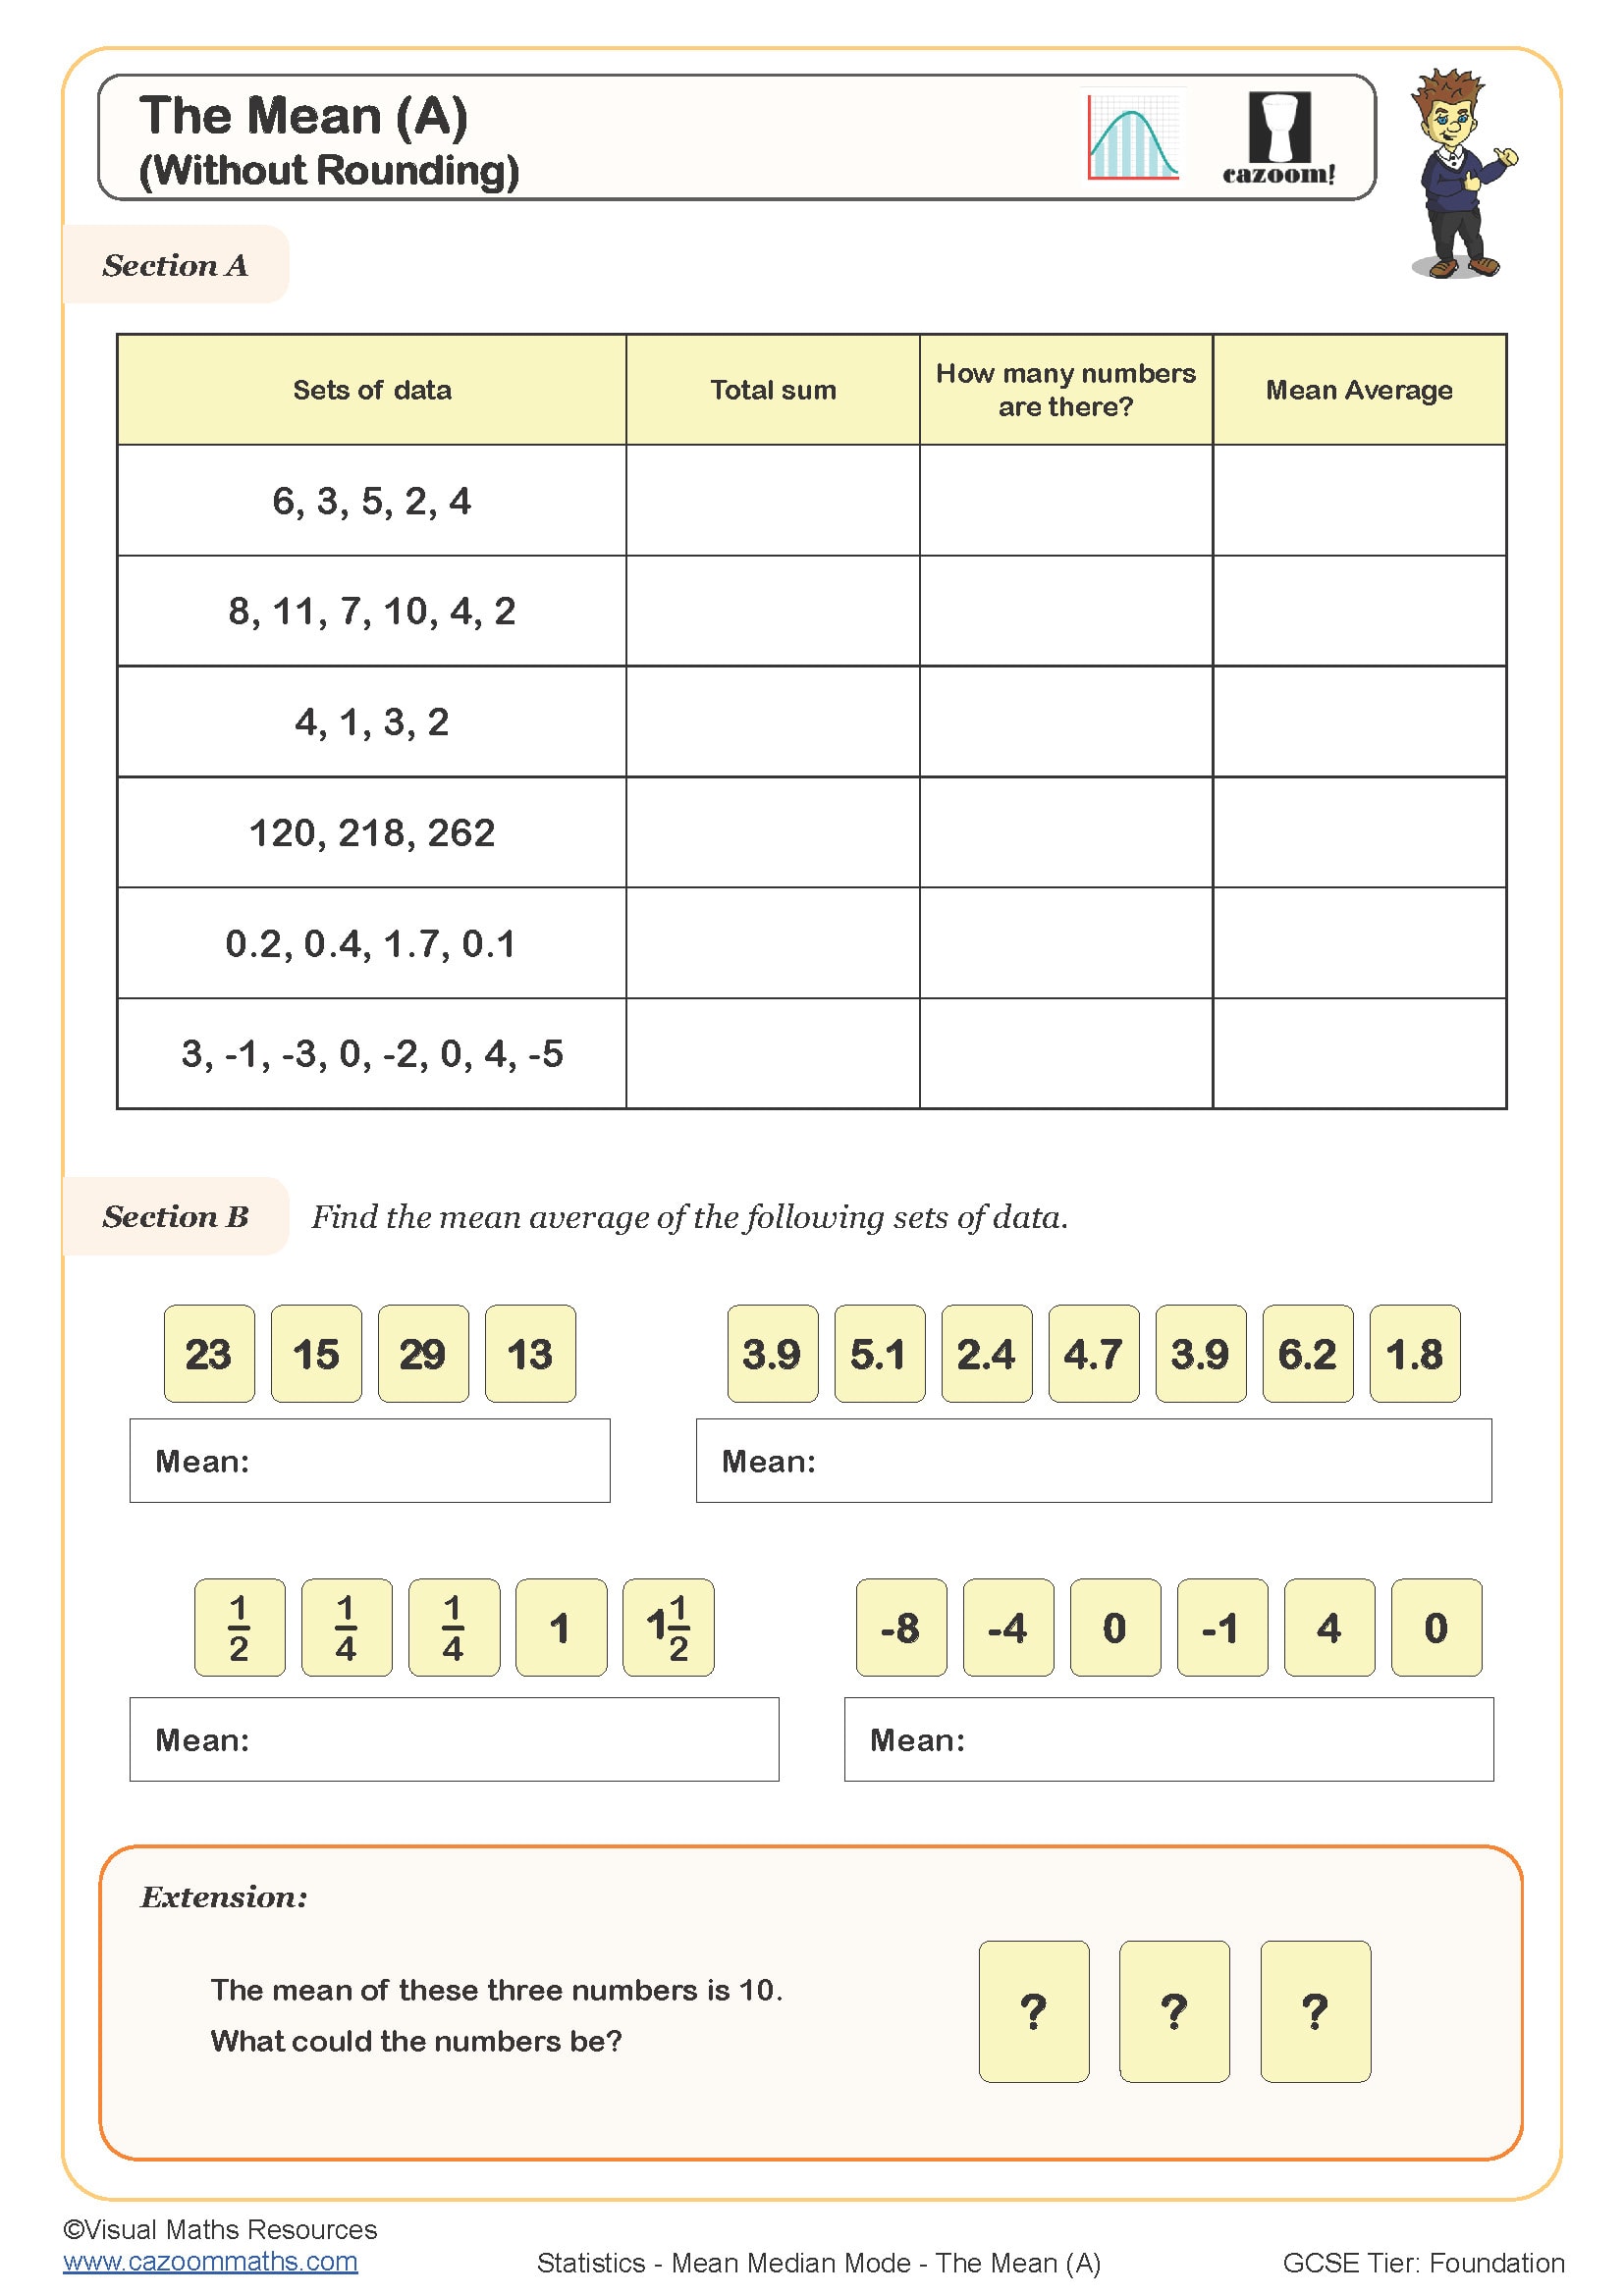
The Mean (A)
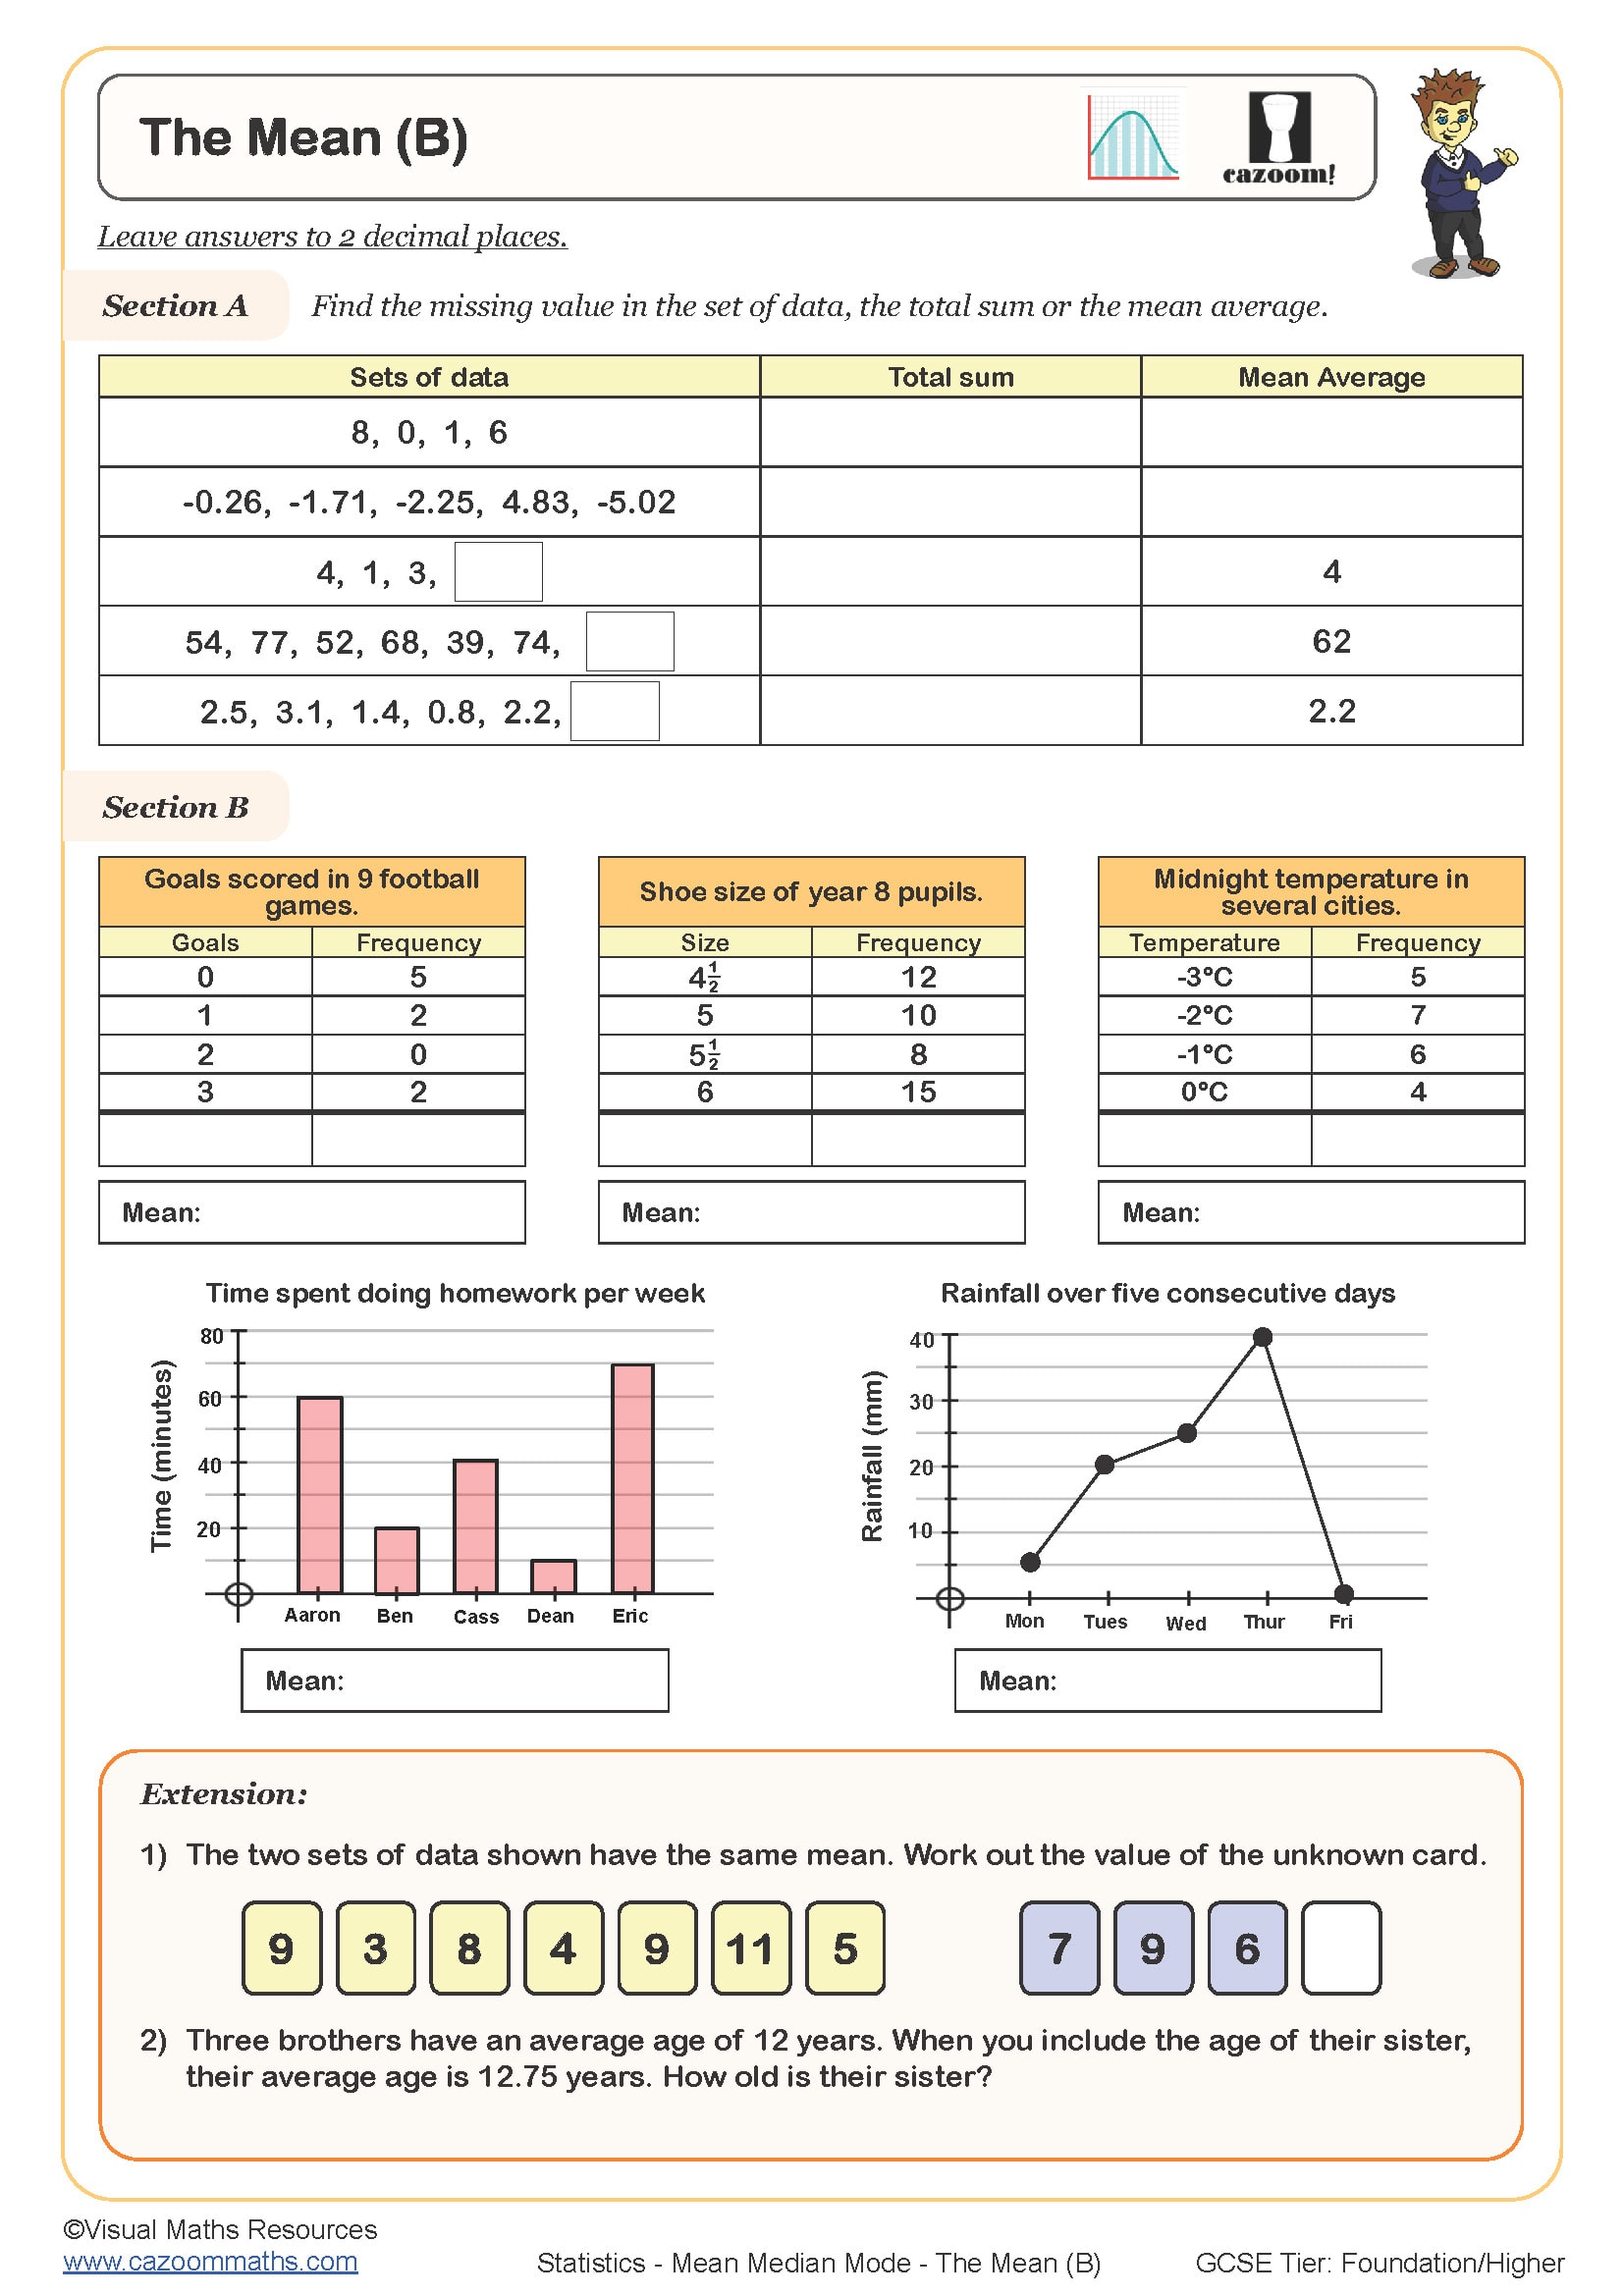
The Mean (B)
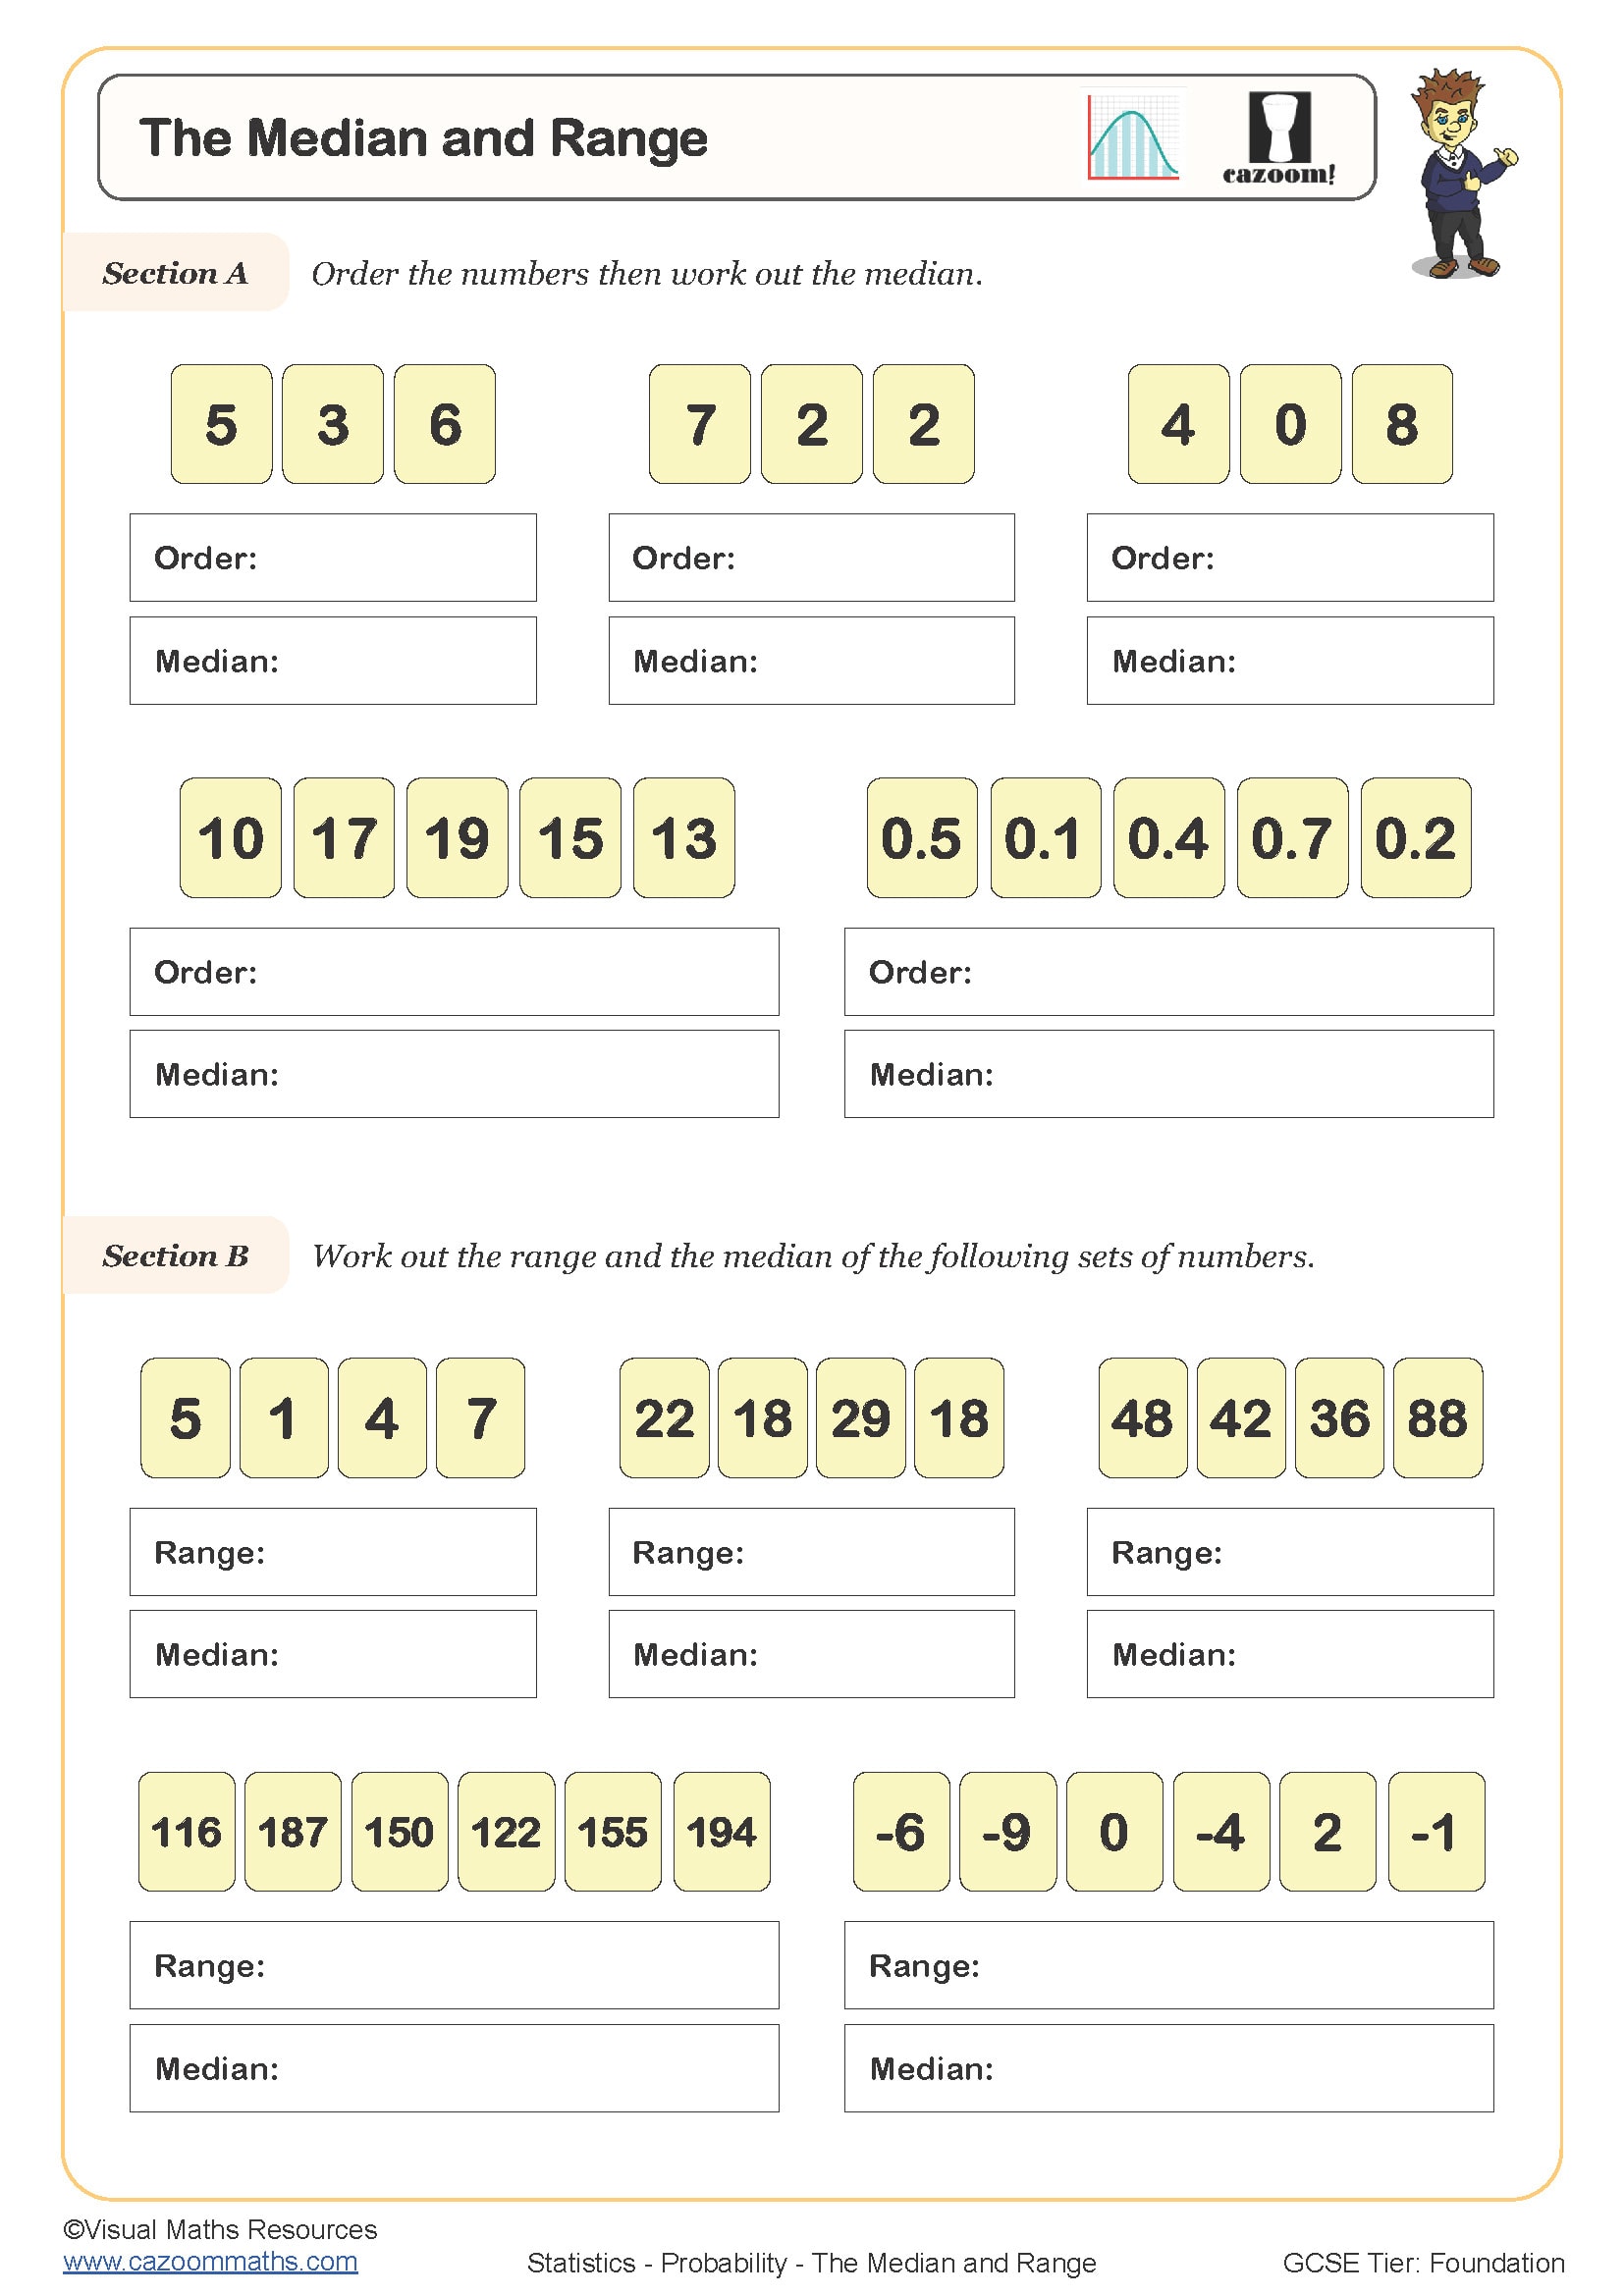
The Median and Range
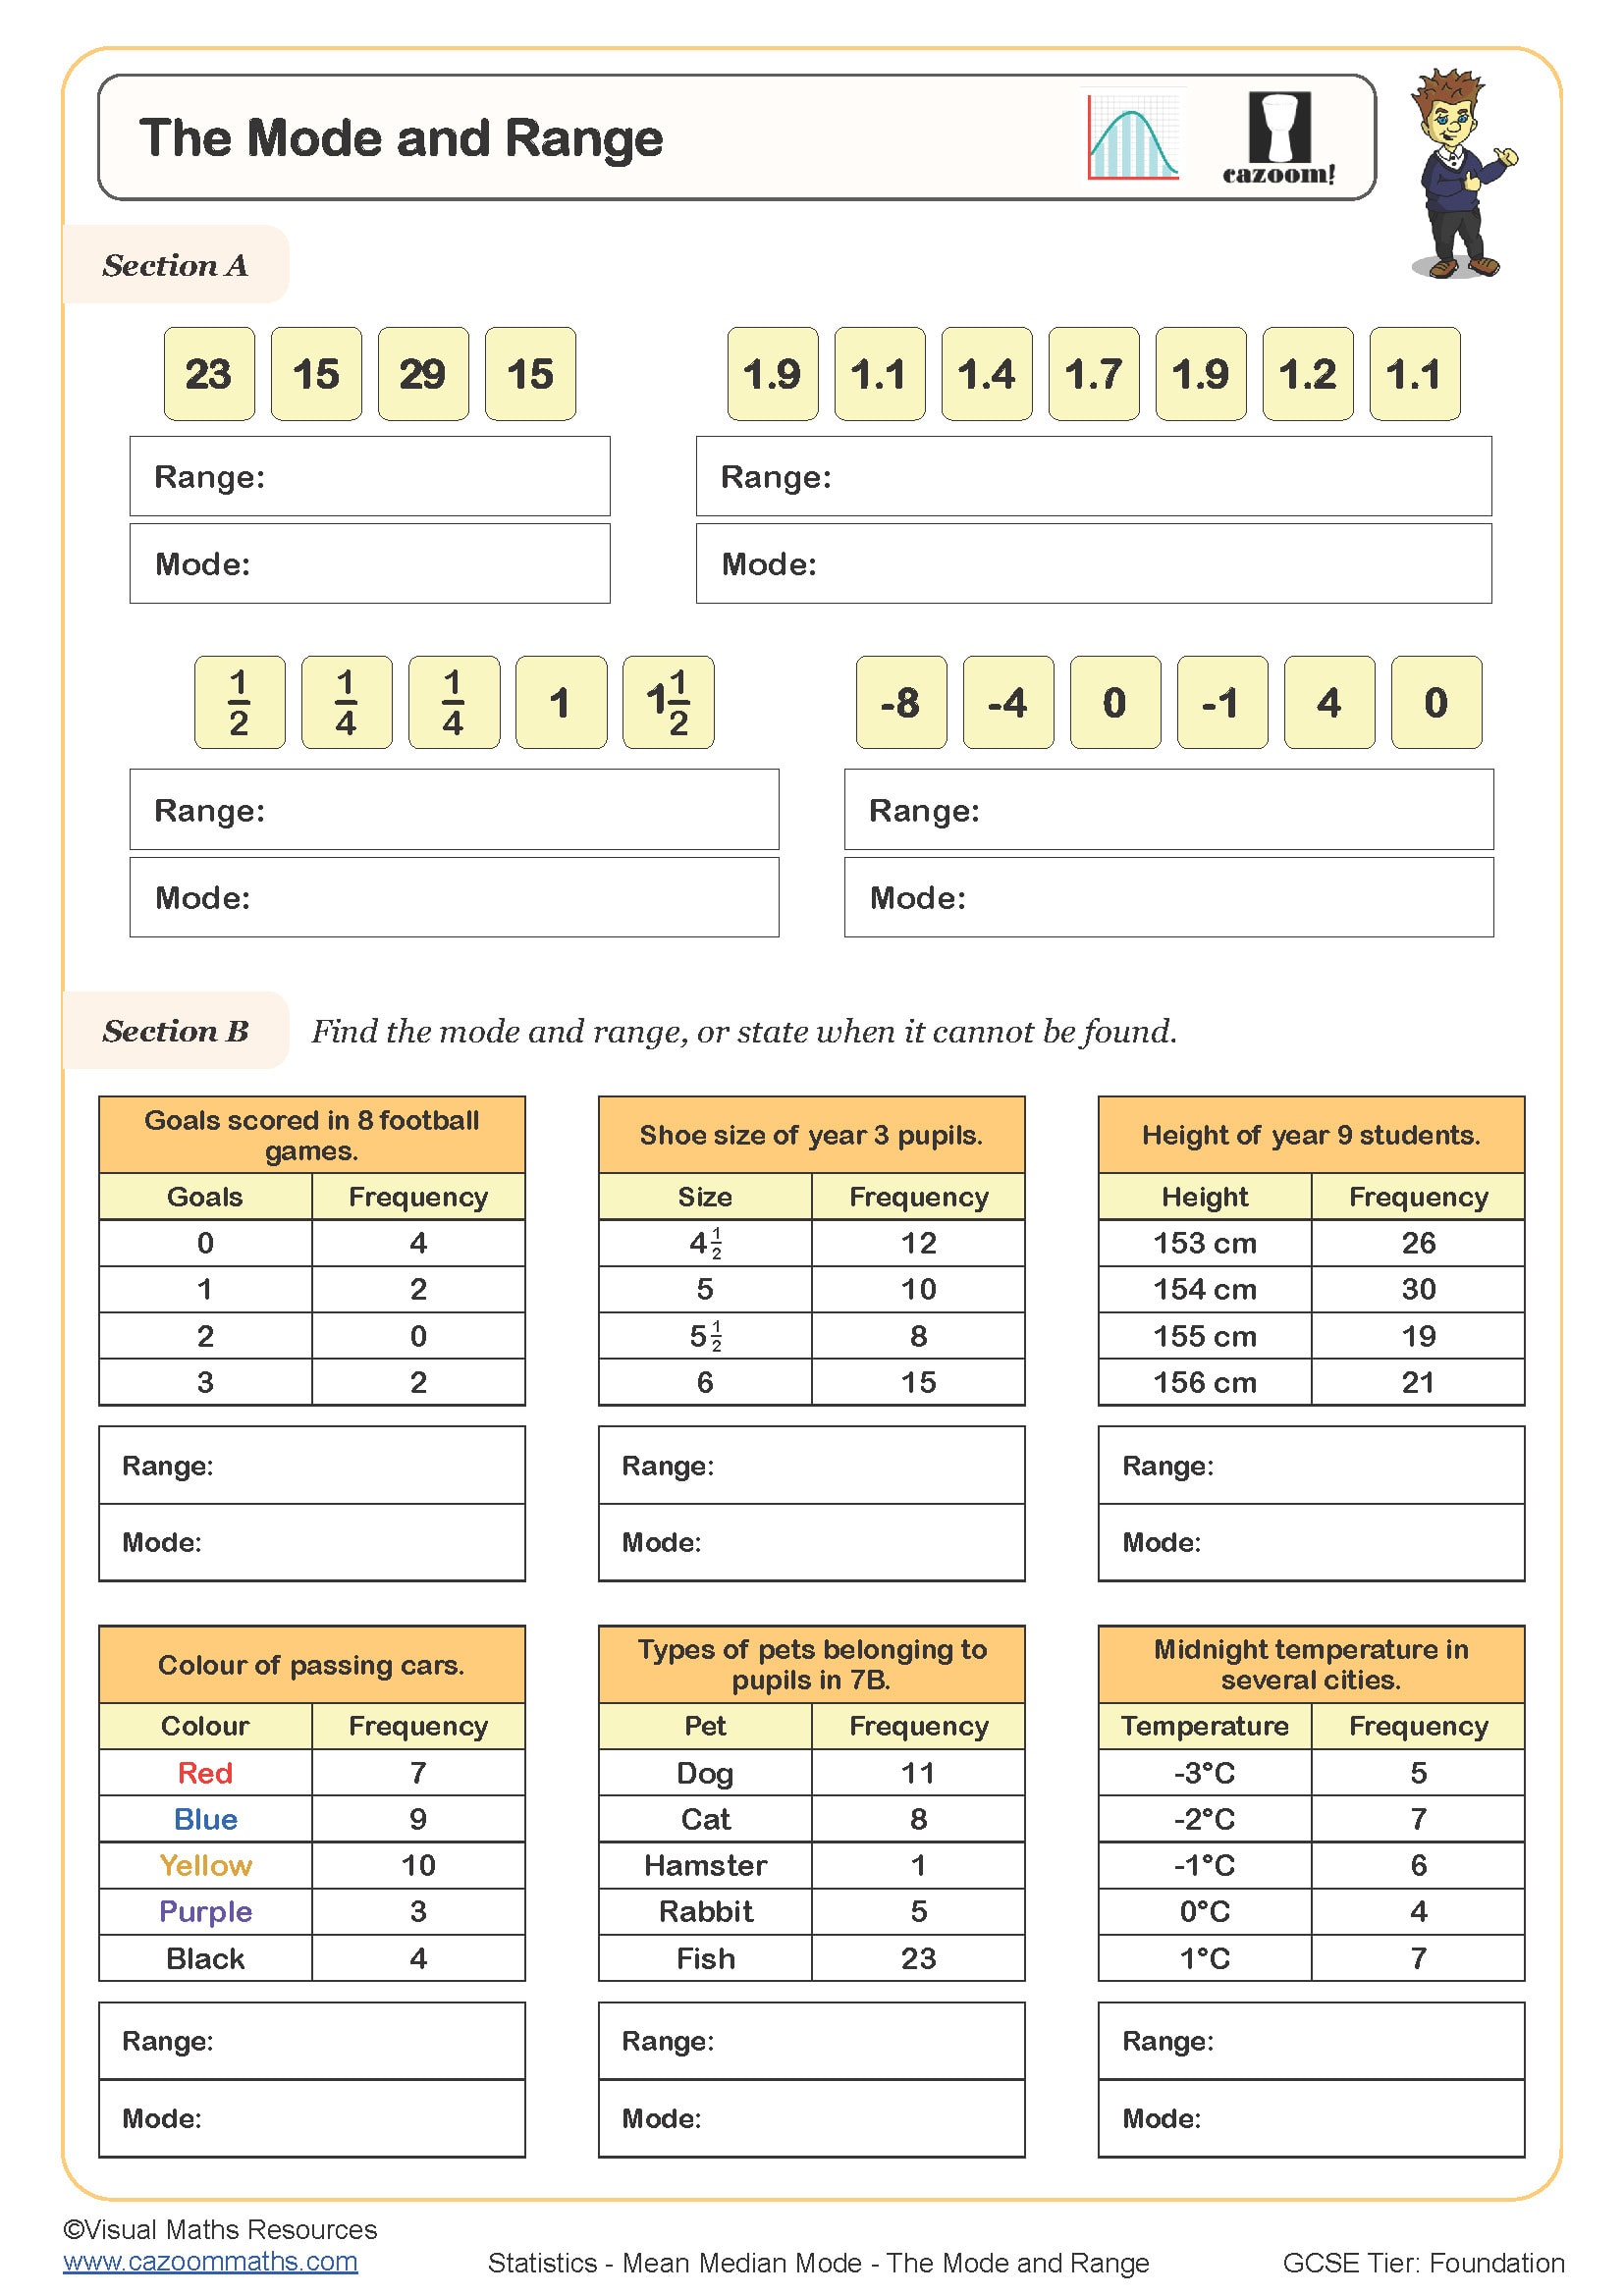
The Mode and Range
All worksheets are created by the team of experienced teachers at Cazoom Maths.
Finding Statistics Hard? See How Our Printable Year 8 Maths Activities Break It Down
Statistics forms a crucial bridge between numerical reasoning and real-world data interpretation, helping Year 8 students develop analytical thinking that extends beyond traditional calculation methods. The transition to Year 7 brings students to work with grouped data and correlation patterns while asking them to analyse multiple datasets at once. Students who regularly practice statistical problems with various types of questions will learn to identify patterns, connect variables, and express their results using proper mathematical terminology. The method enables students to develop problem-solving skills while building the accuracy required for solving advanced mathematical problems.
Specific learning benefits include:
• Master calculating the mean from frequency tables
• Interprets scatter graphs and correlation patterns
• Constructs accurate pie charts and bar graphs
• Analyses grouped data and class intervals
• Develops probability reasoning skills
• Strengthens data collection methodology
• Enhances mathematical communication abilities
Maths Skills You’ll Cover Using Cazoom Maths Year 8 Statistics Resources
The worksheets begin with real-world examples of data, followed by pictures that help students develop abstract statistical thinking through a step-by-step, logical process, which builds their conceptual understanding. The collection follows a systematic order of essential content, with suitable difficulty levels that support students who learn at different levels. The solutions demonstrate proper mathematical reasoning while maintaining correct presentation methods throughout the work.
The worksheets in this collection include:
• Calculating Averages — finding mean, median, mode and range from datasets
• Frequency Tables — organising raw data into meaningful categorical summaries
• Grouped Data Analysis — working with class intervals and continuous data
• Drawing Bar Charts — constructing accurate graphical representations from tables
• Creating Pie Charts — converting data into proportional circular diagrams
• Interpreting Scatter Graphs — identifying correlation and plotting coordinate pairs
• Probability Fundamentals — calculating theoretical and experimental probabilities
• Statistical Diagrams — comparing different representation methods effectively
• Data Collection Methods — designing surveys and understanding sampling techniques
• Mixed Statistics Problems — combining multiple concepts in context-based questions
Attention Parents: Improve Homework Success With Year 8 Statistics Worksheets
The classroom environment indicates that statistics draw students who find abstract algebra challenging, making these worksheets an excellent teaching resource for students with varying learning abilities. Teachers can modify lesson content through the structured progression because it provides basic questions for all students and challenging extension problems for advanced learners. Time-saving answer sheets help teachers reduce their marking work, which allows them to provide individualised support to students who require it most. The materials establish connections between statistical concepts and geography and science and PSHE subjects to enhance cross-curricular learning. Teachers work to develop computational skills and interpretative abilities at the same level because this method enables students to perform well in assessments with and without calculators.
The Real-World Maths That Starts With Year 8 Statistics Worksheets
Statistical literacy shapes how young people interpret information in an increasingly data-driven society, from social media analytics to environmental research. These fundamental skills enable students to question claims, evaluate evidence, and make informed decisions based on numerical data. For example-
• Reading nutrition labels and comparing product values
• Understanding weather forecasts and climate data
• Analysing sports performance and league tables
• Interpreting opinion polls and survey results
• Managing personal budgets and spending patterns
• Evaluating scientific experiments and research findings
• Understanding gaming statistics and probability mechanics
• Making sense of news reports featuring data visualisations