Year 7 Statistics Worksheets
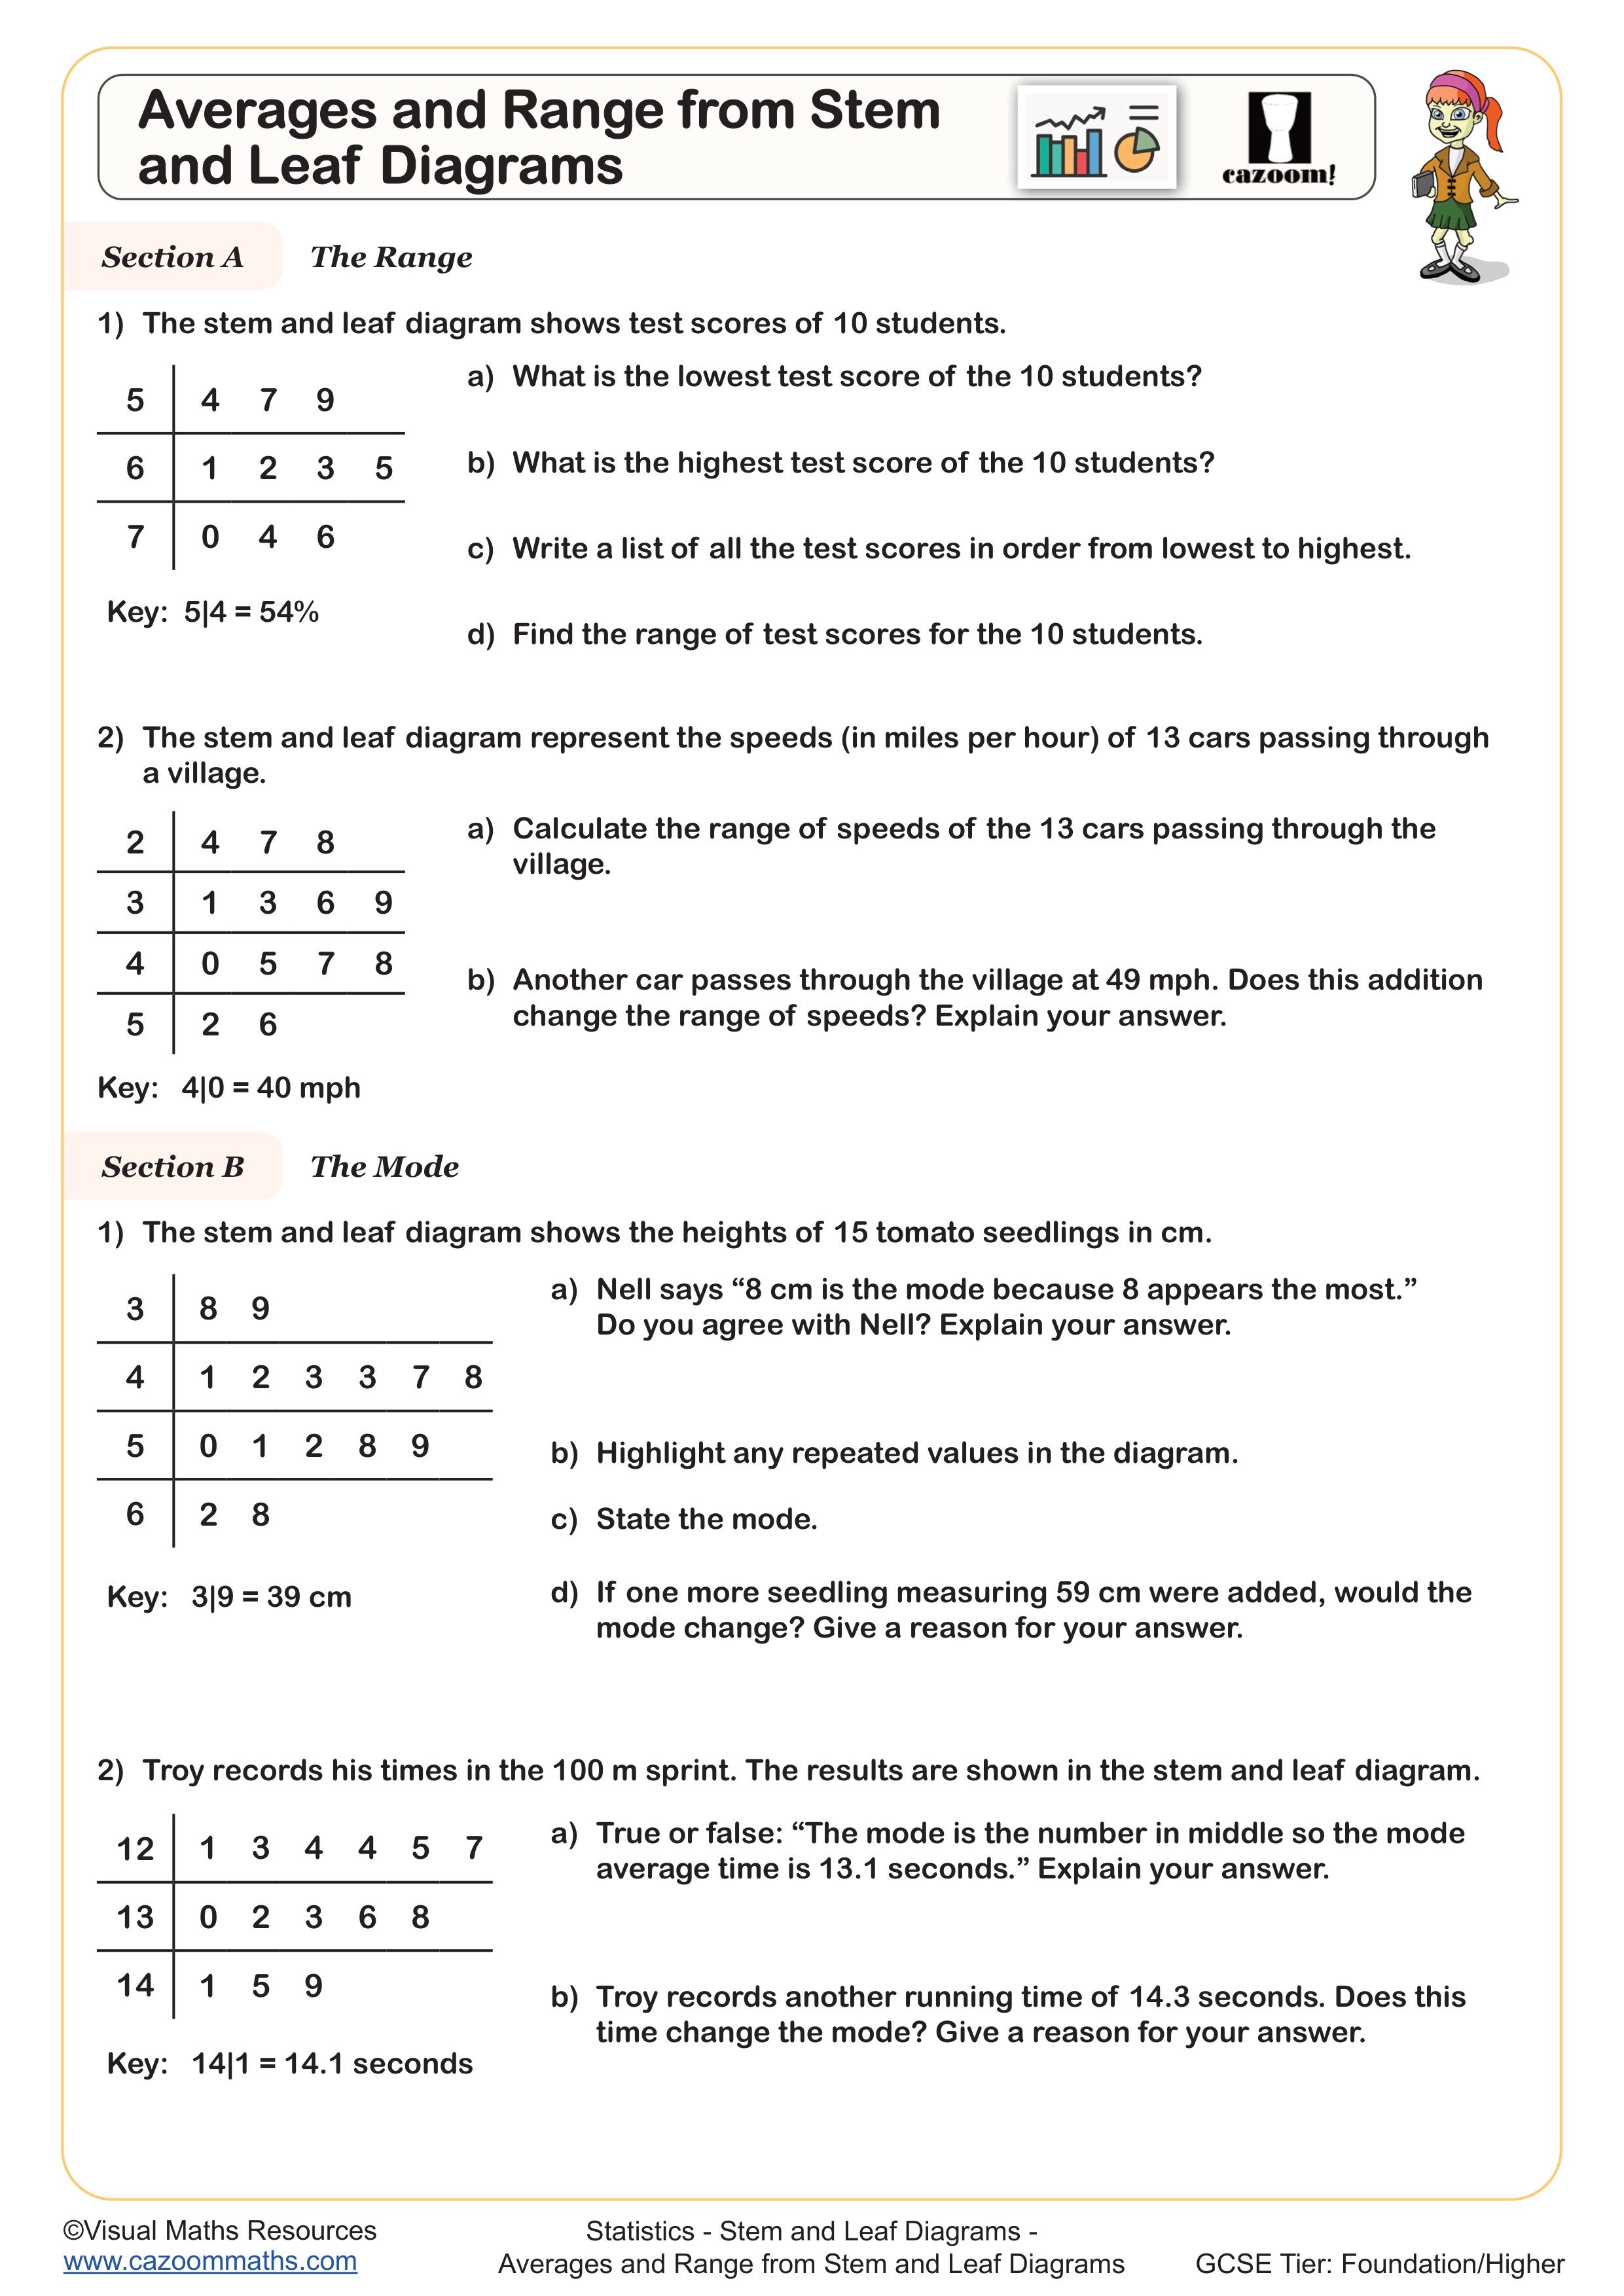
Averages from Stem and Leaf Diagrams
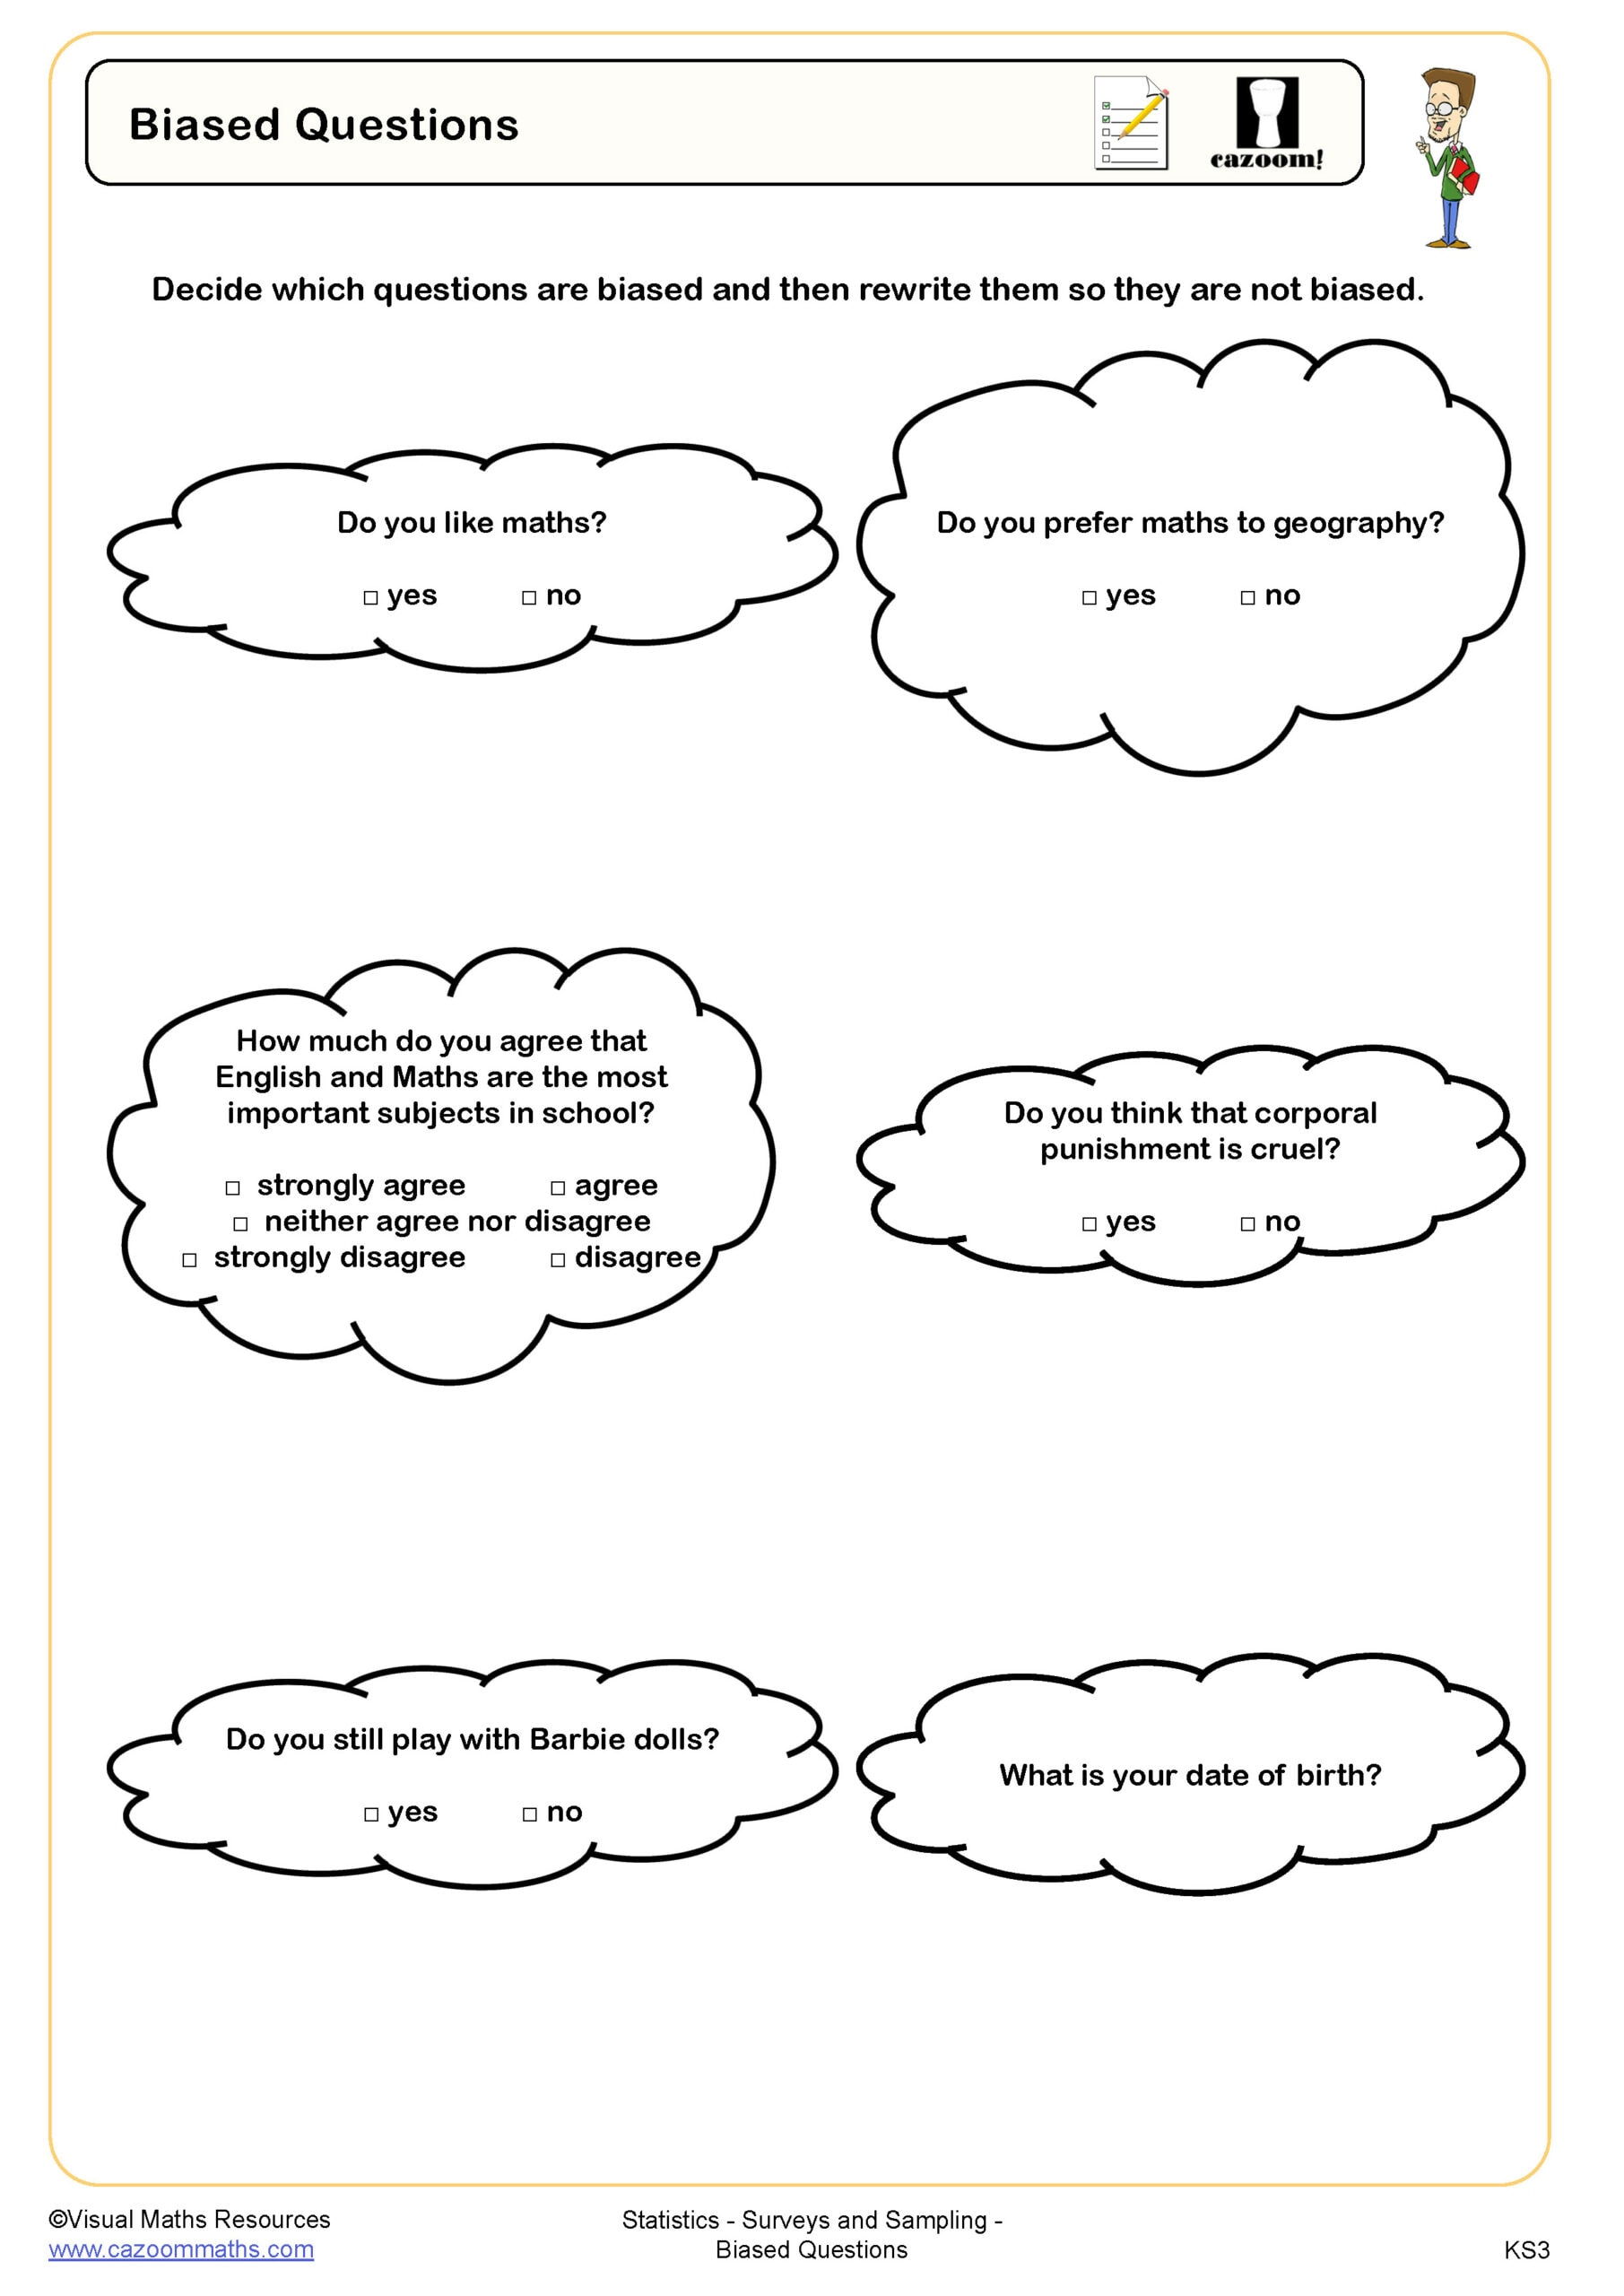
Biased Questions
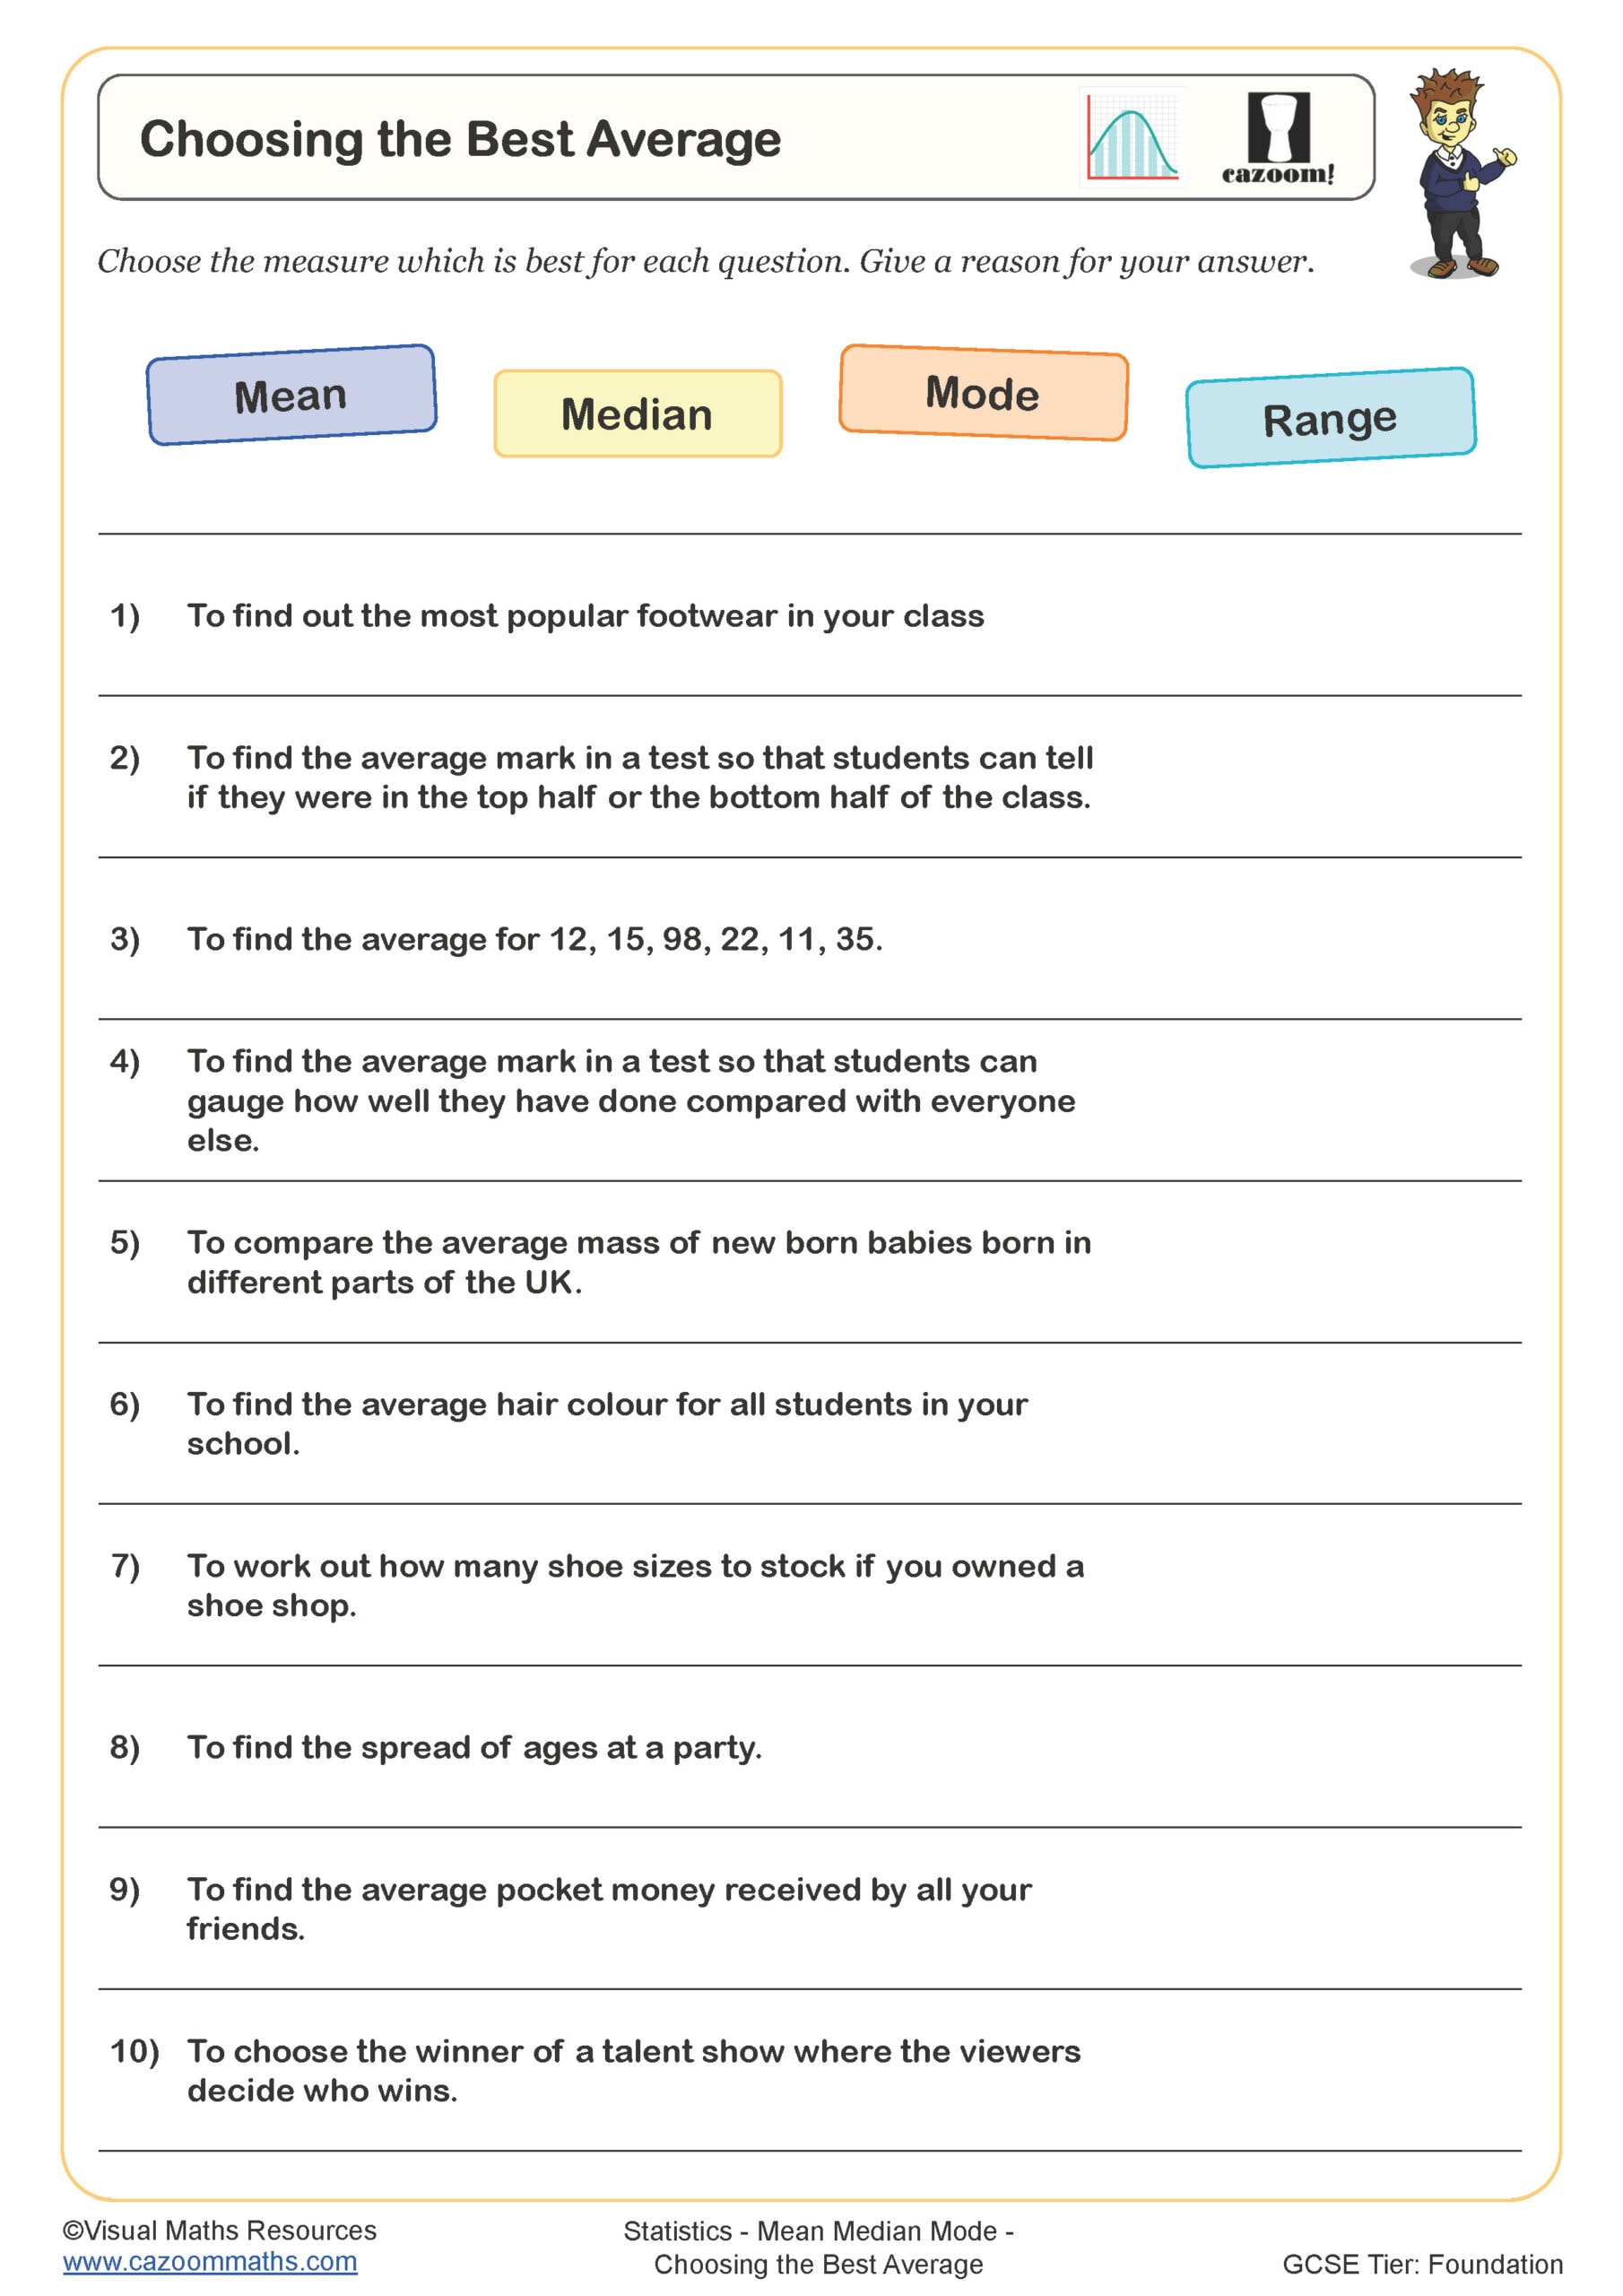
Choosing the Best Average
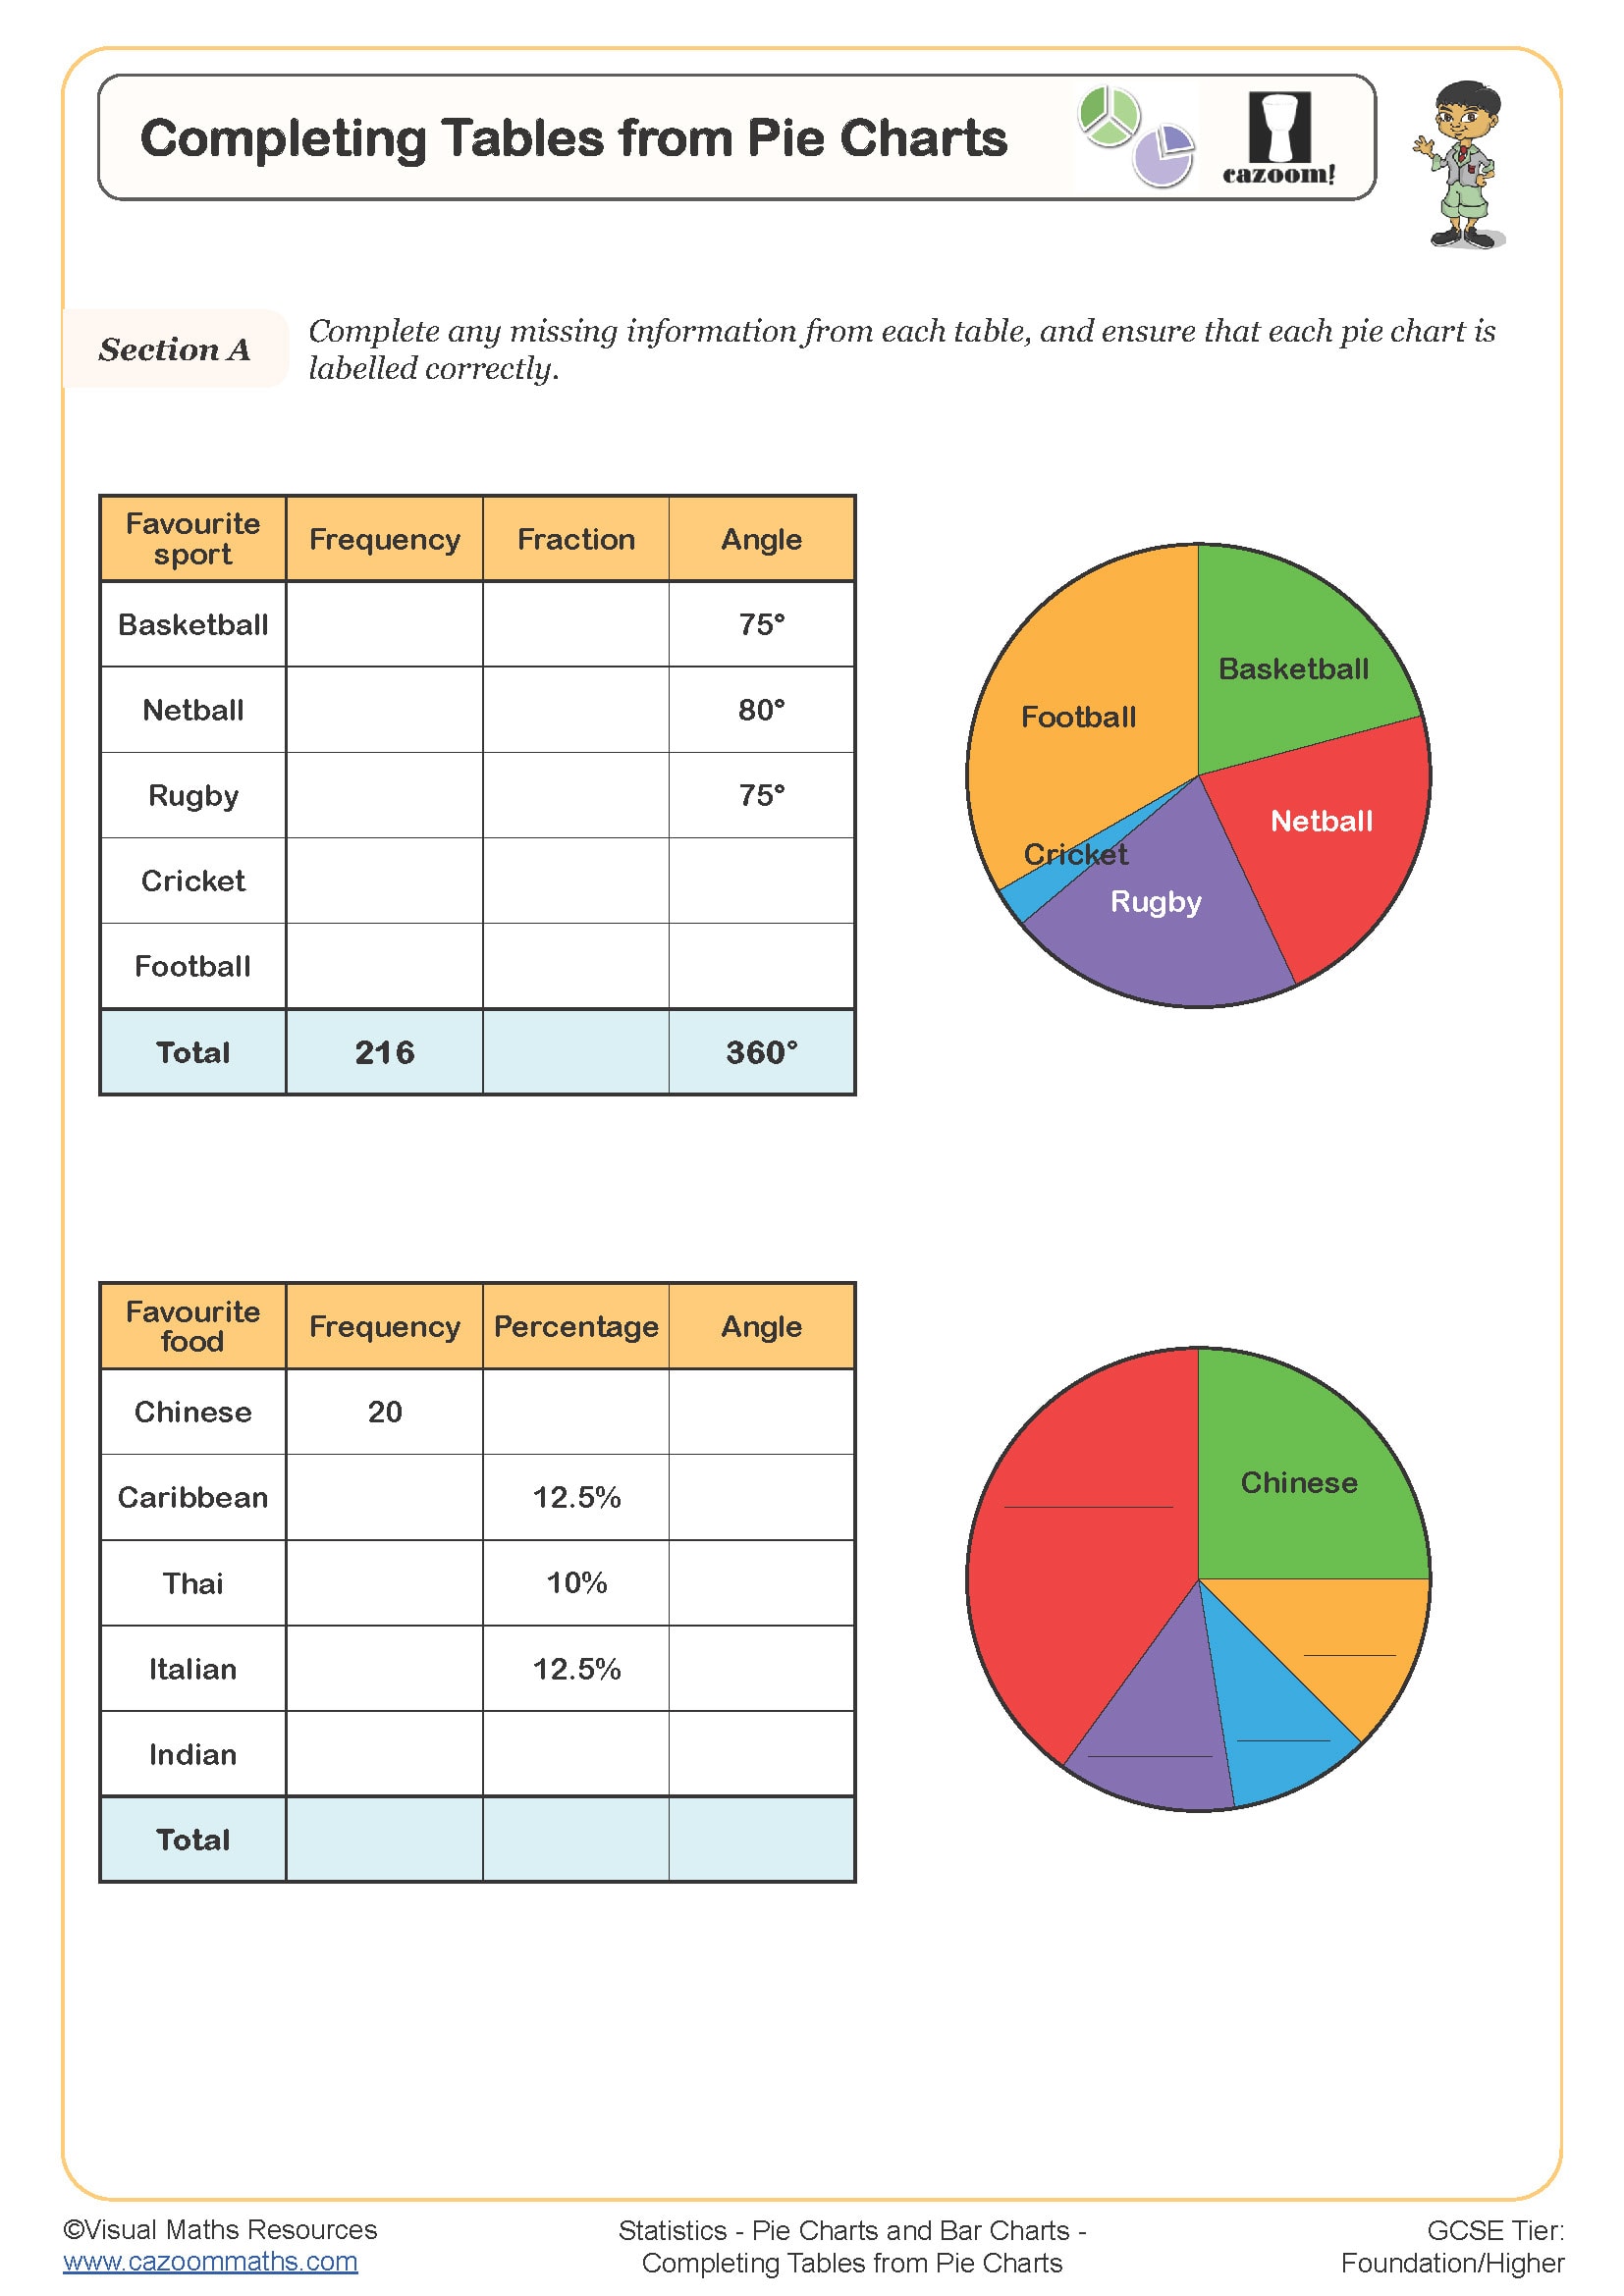
Completing Tables from Pie Charts
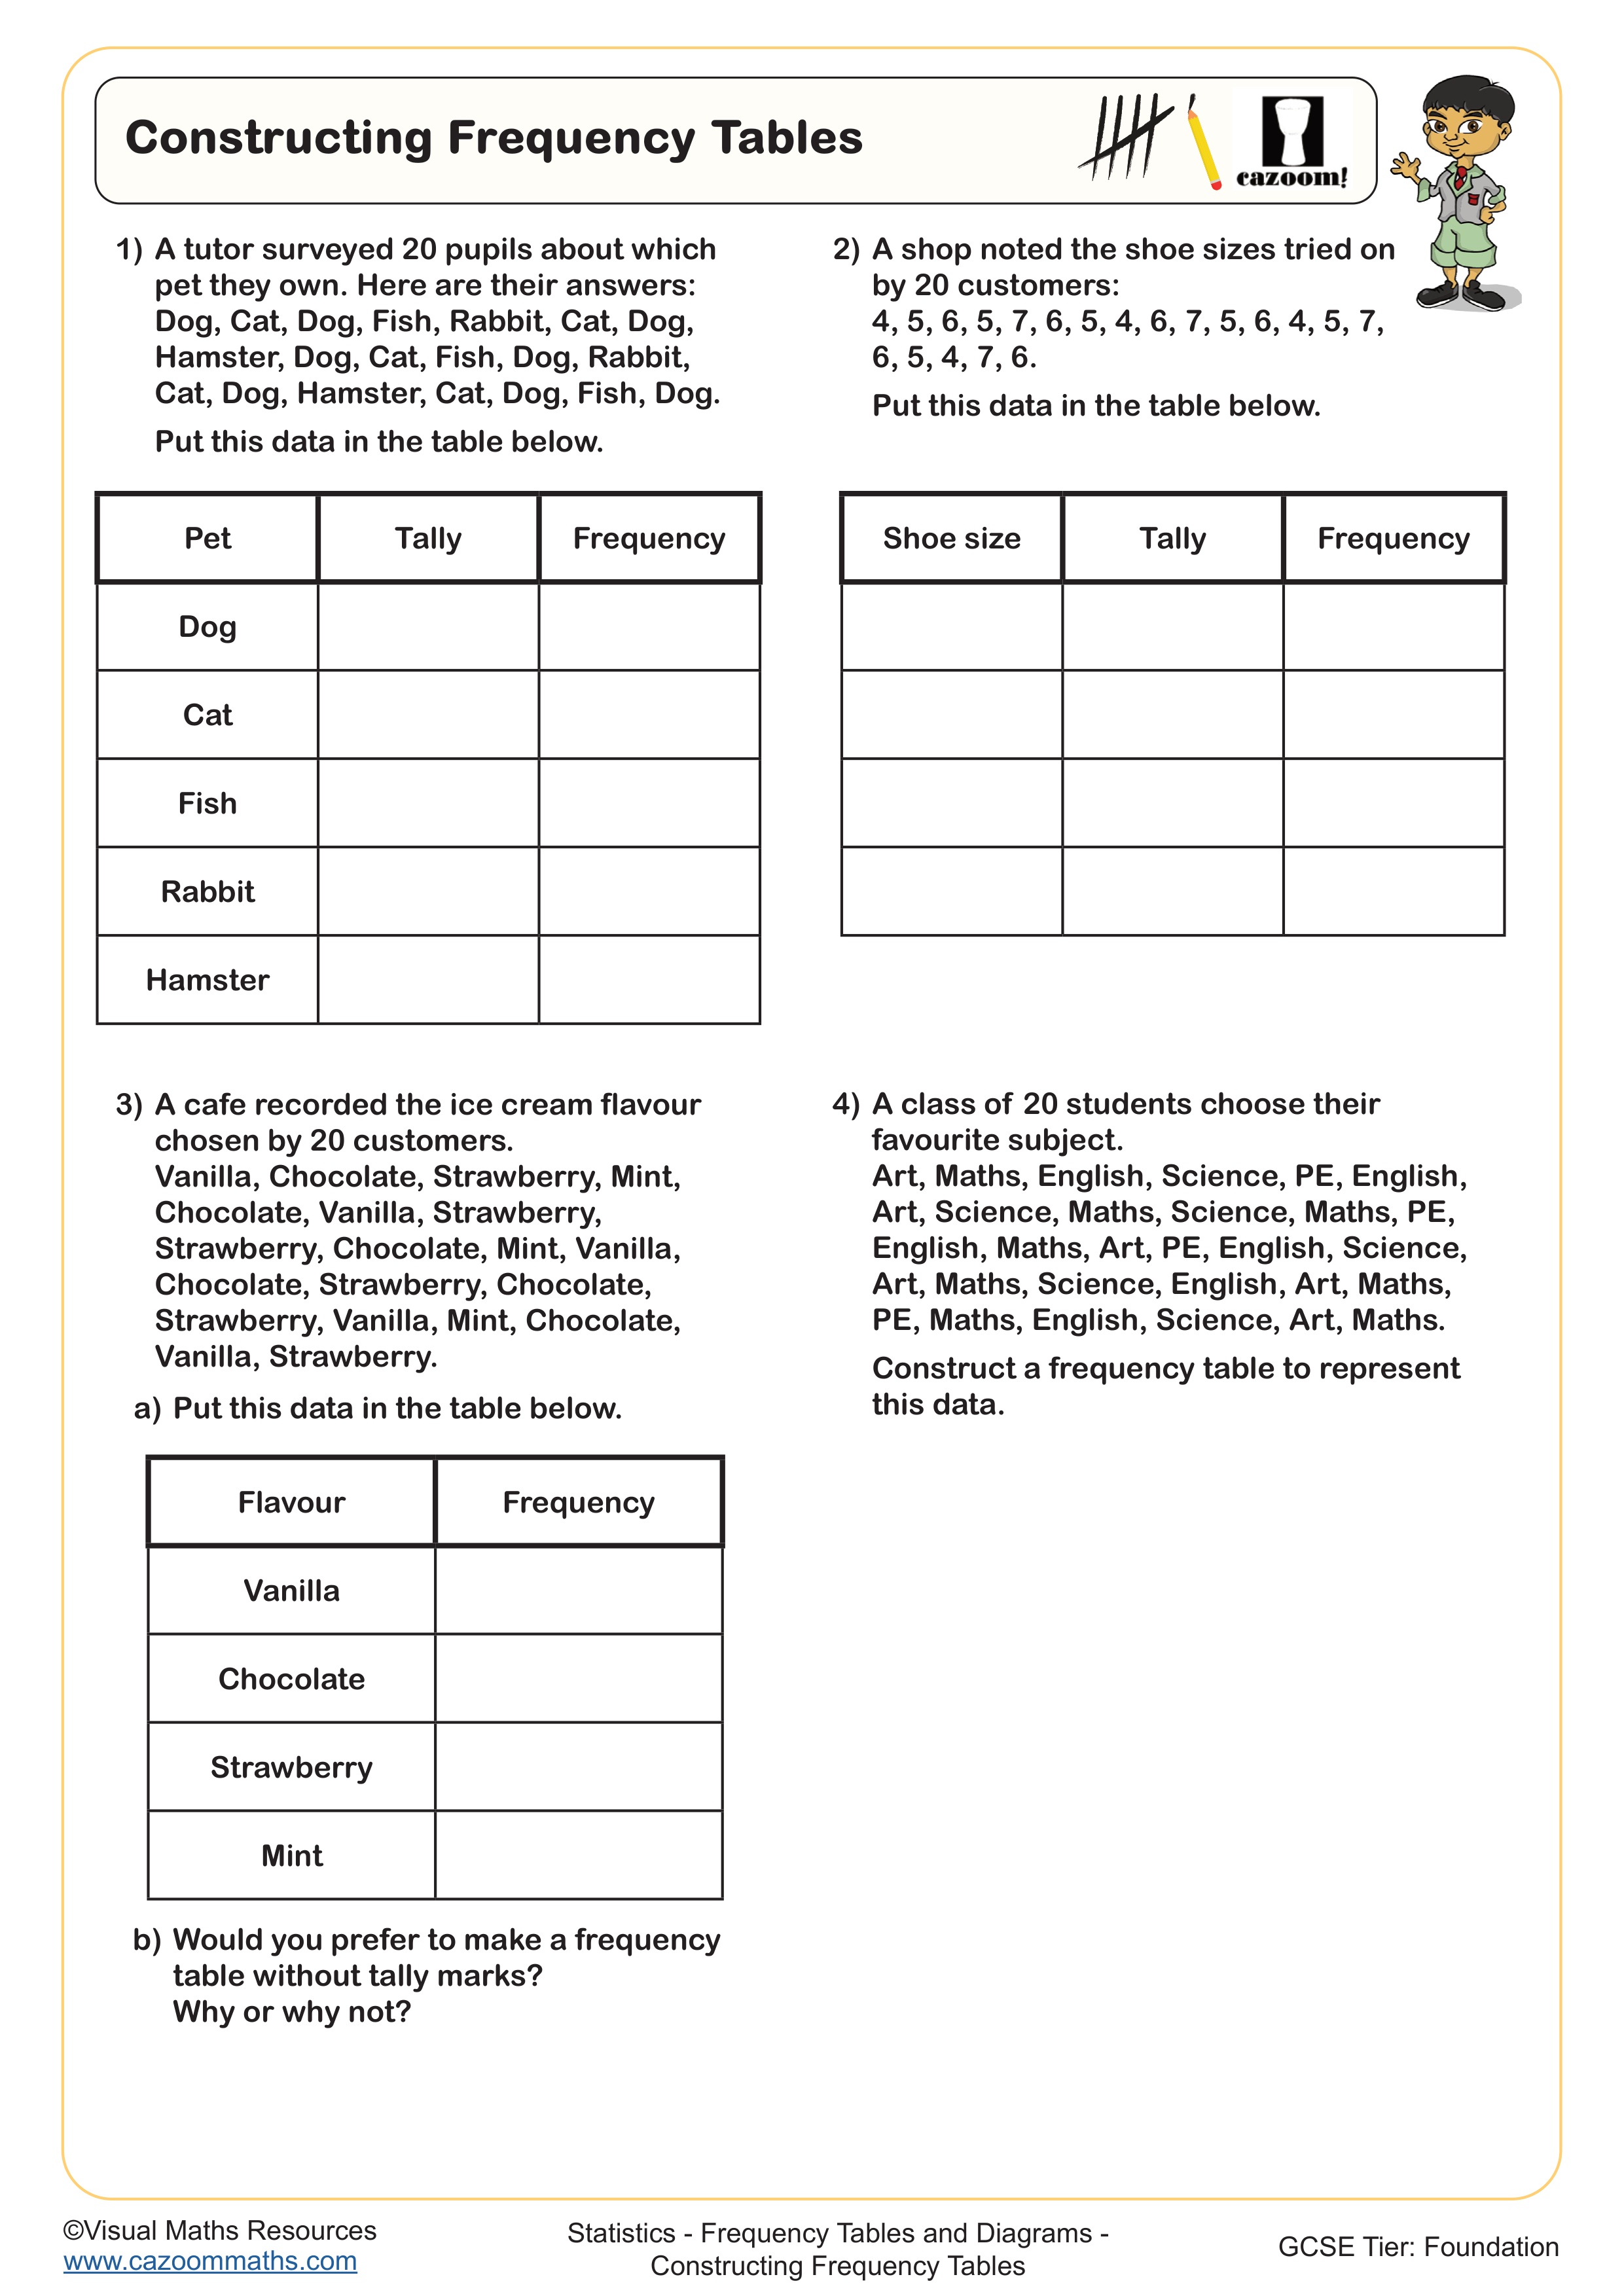
Constructing Frequency Tables
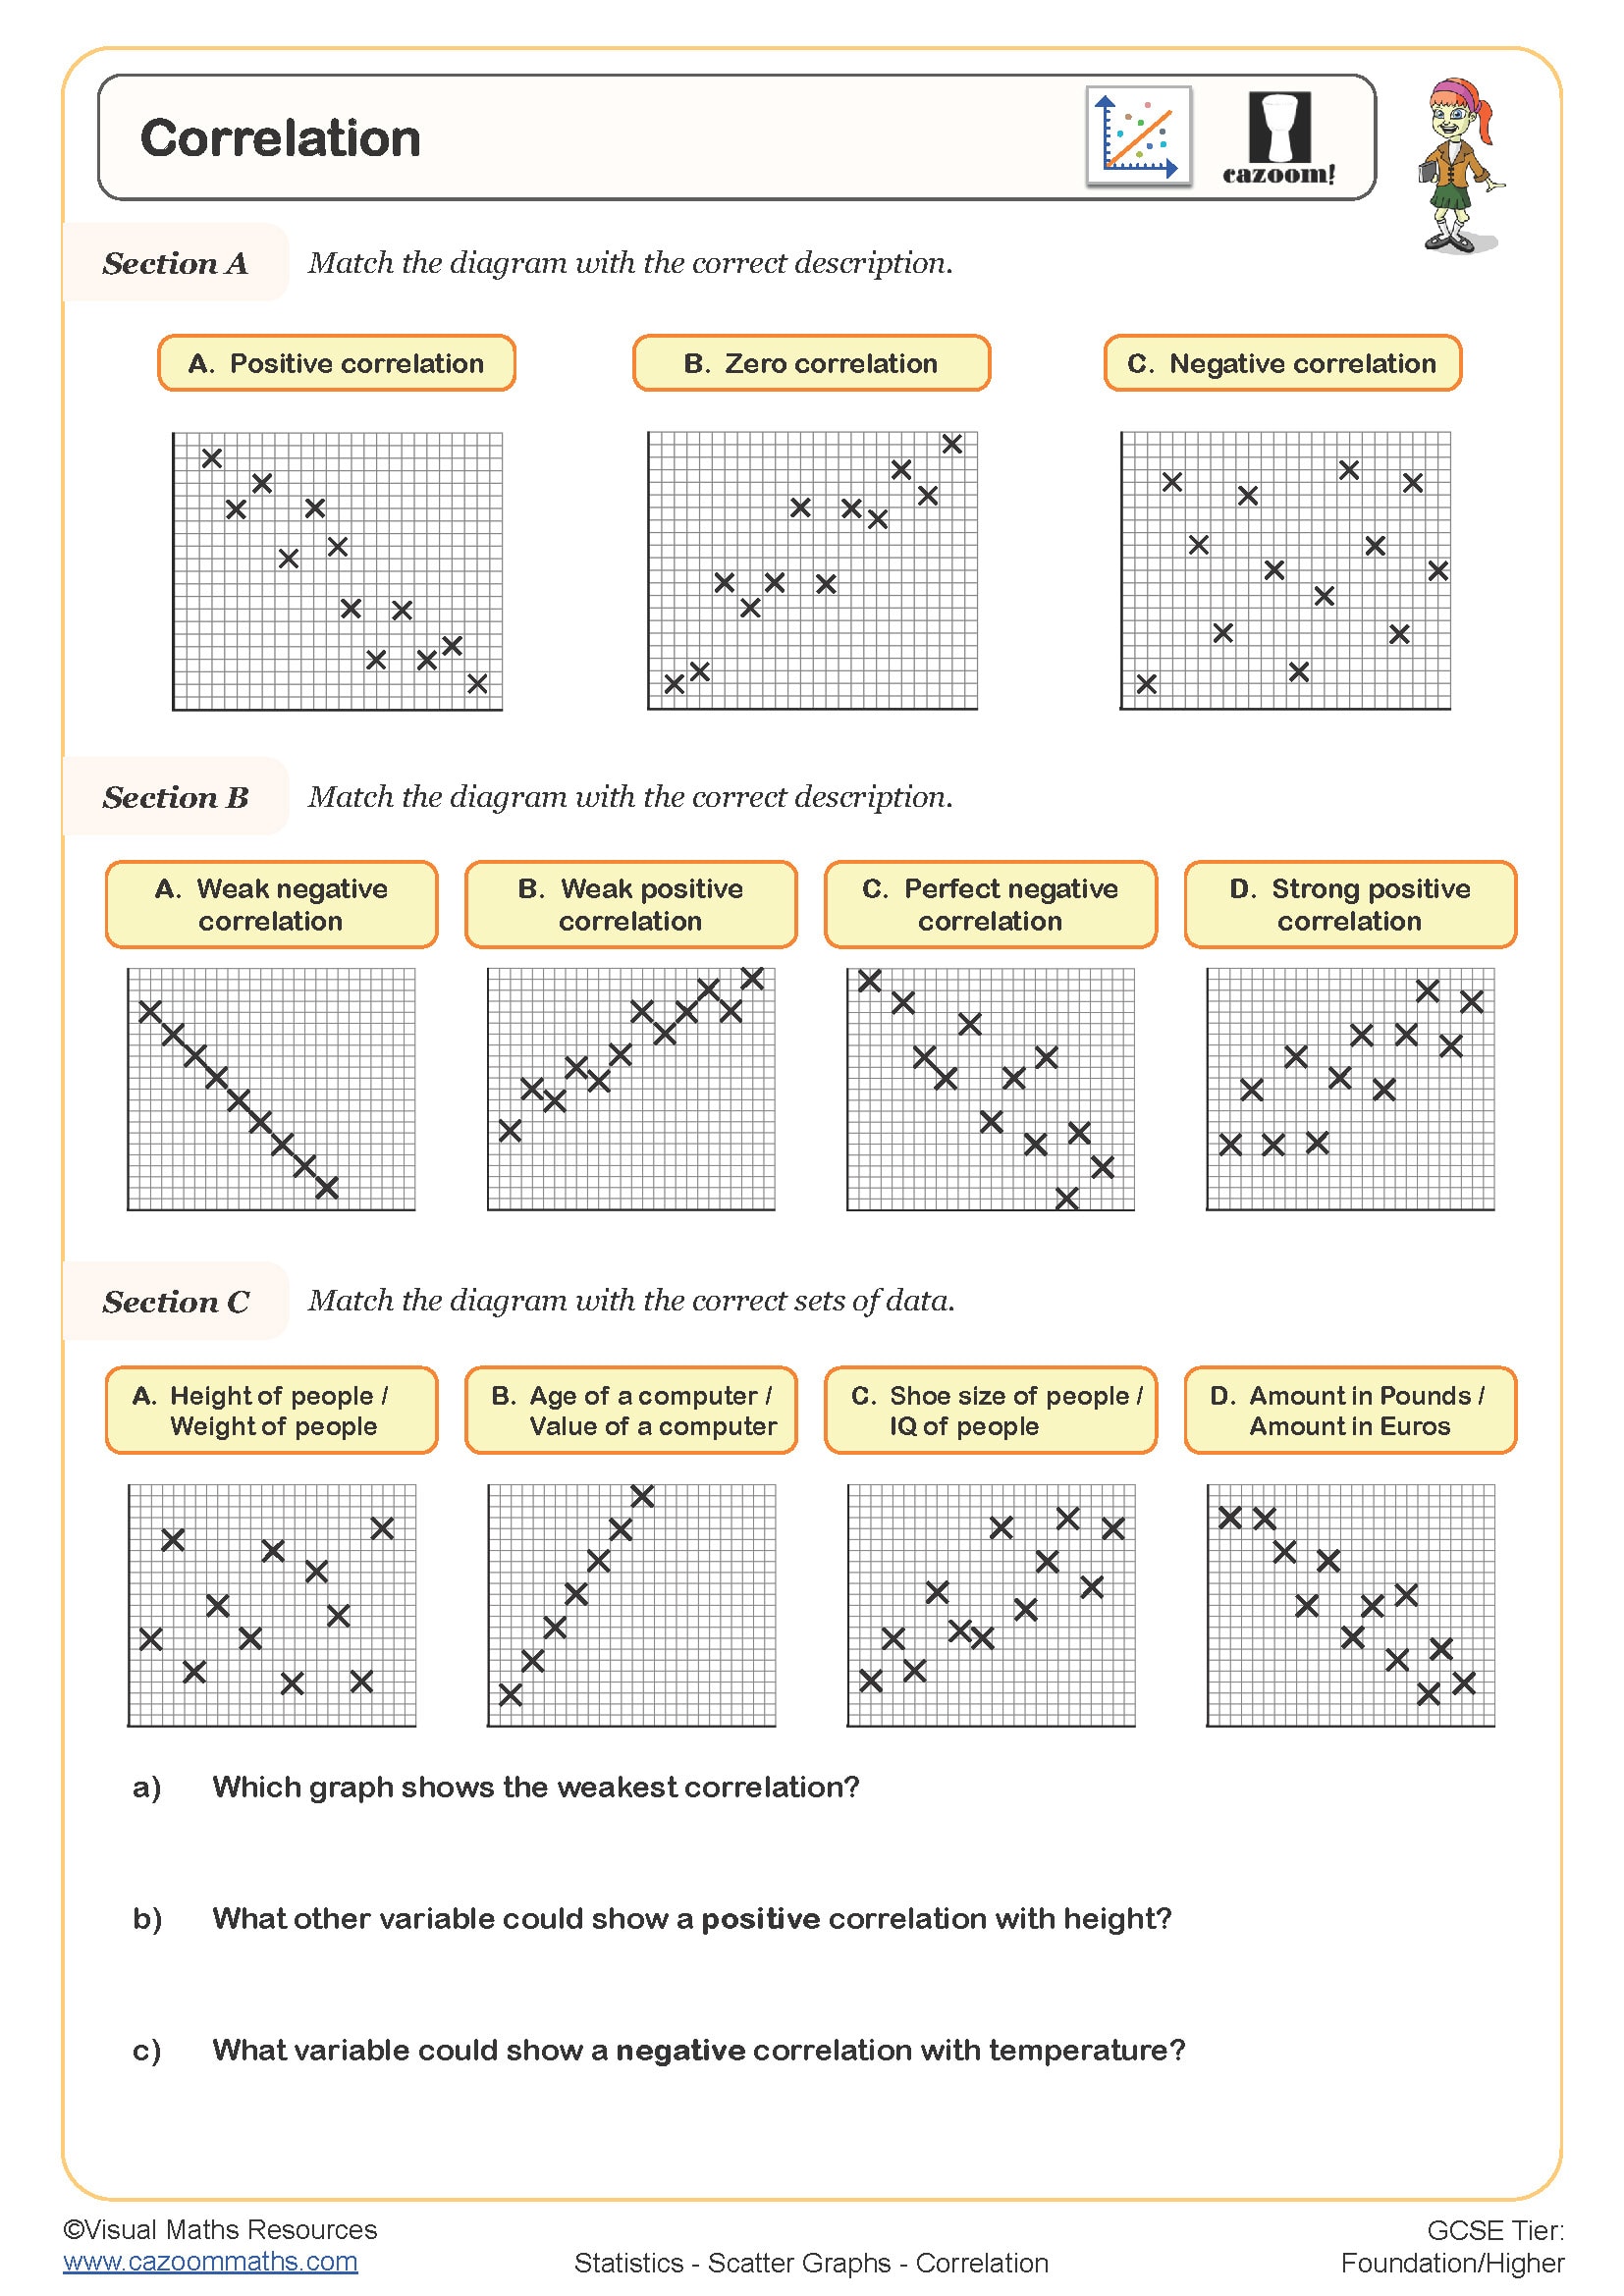
Correlation
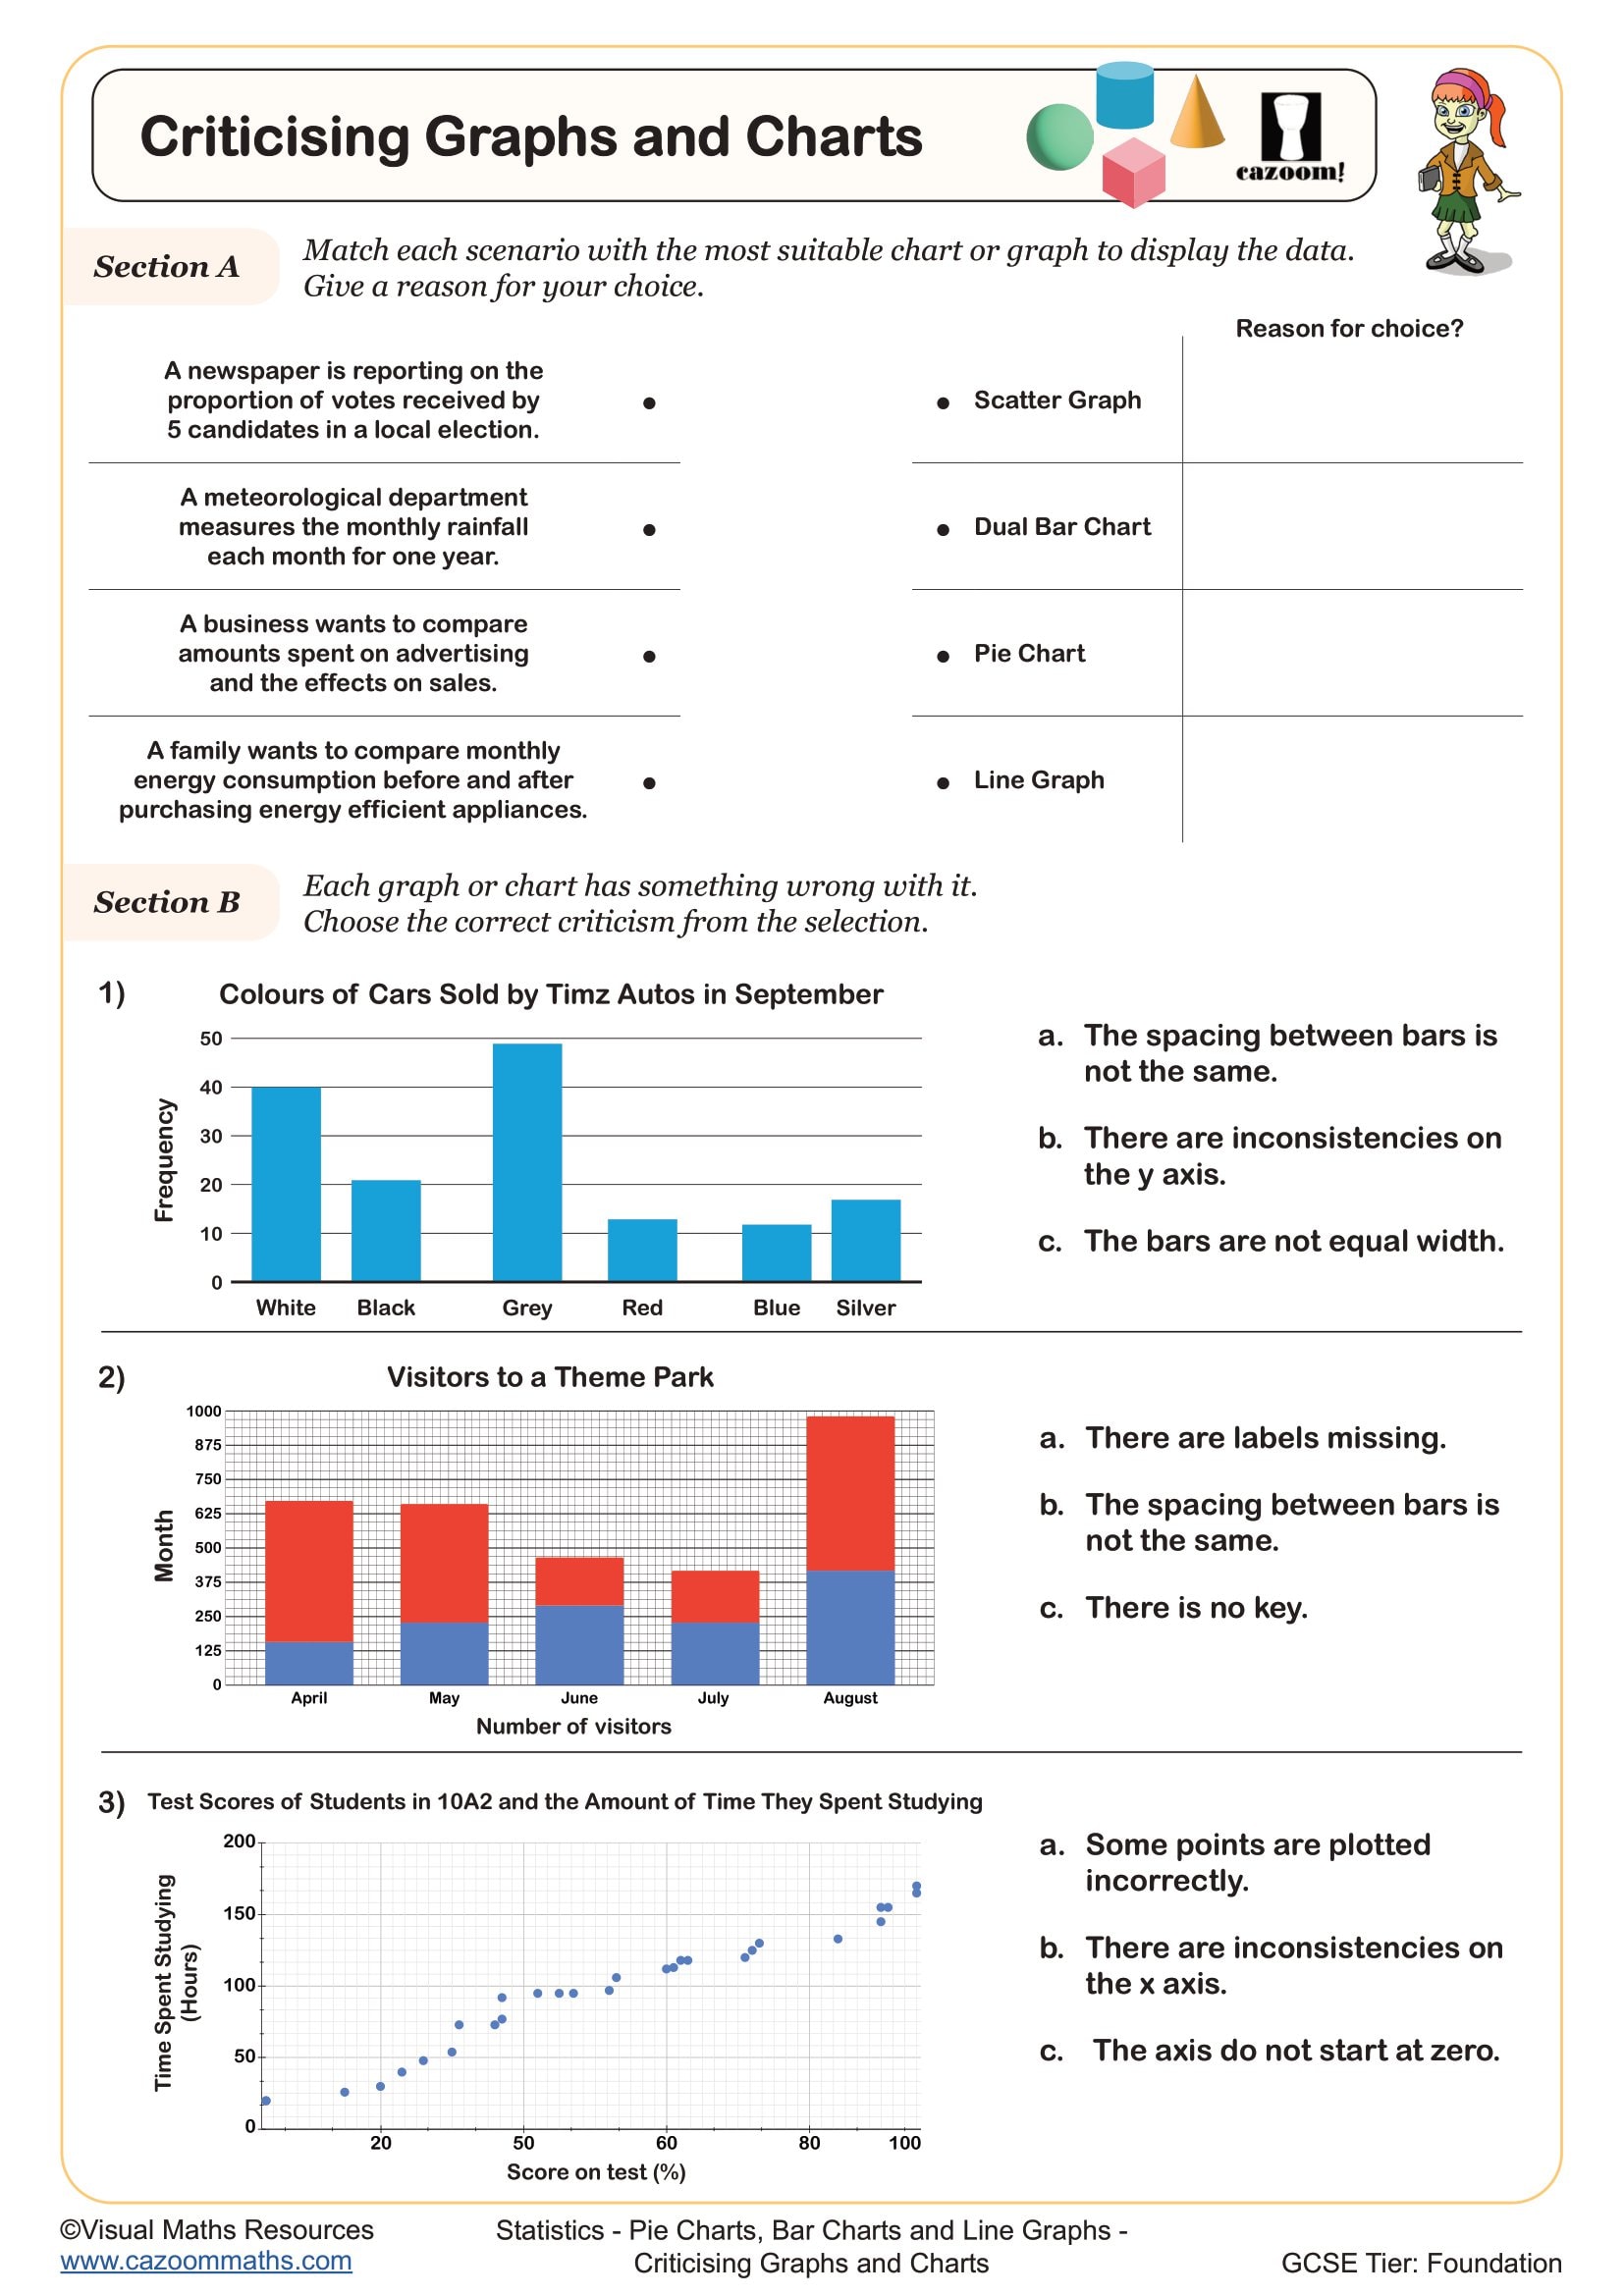
Criticising Graphs and Charts
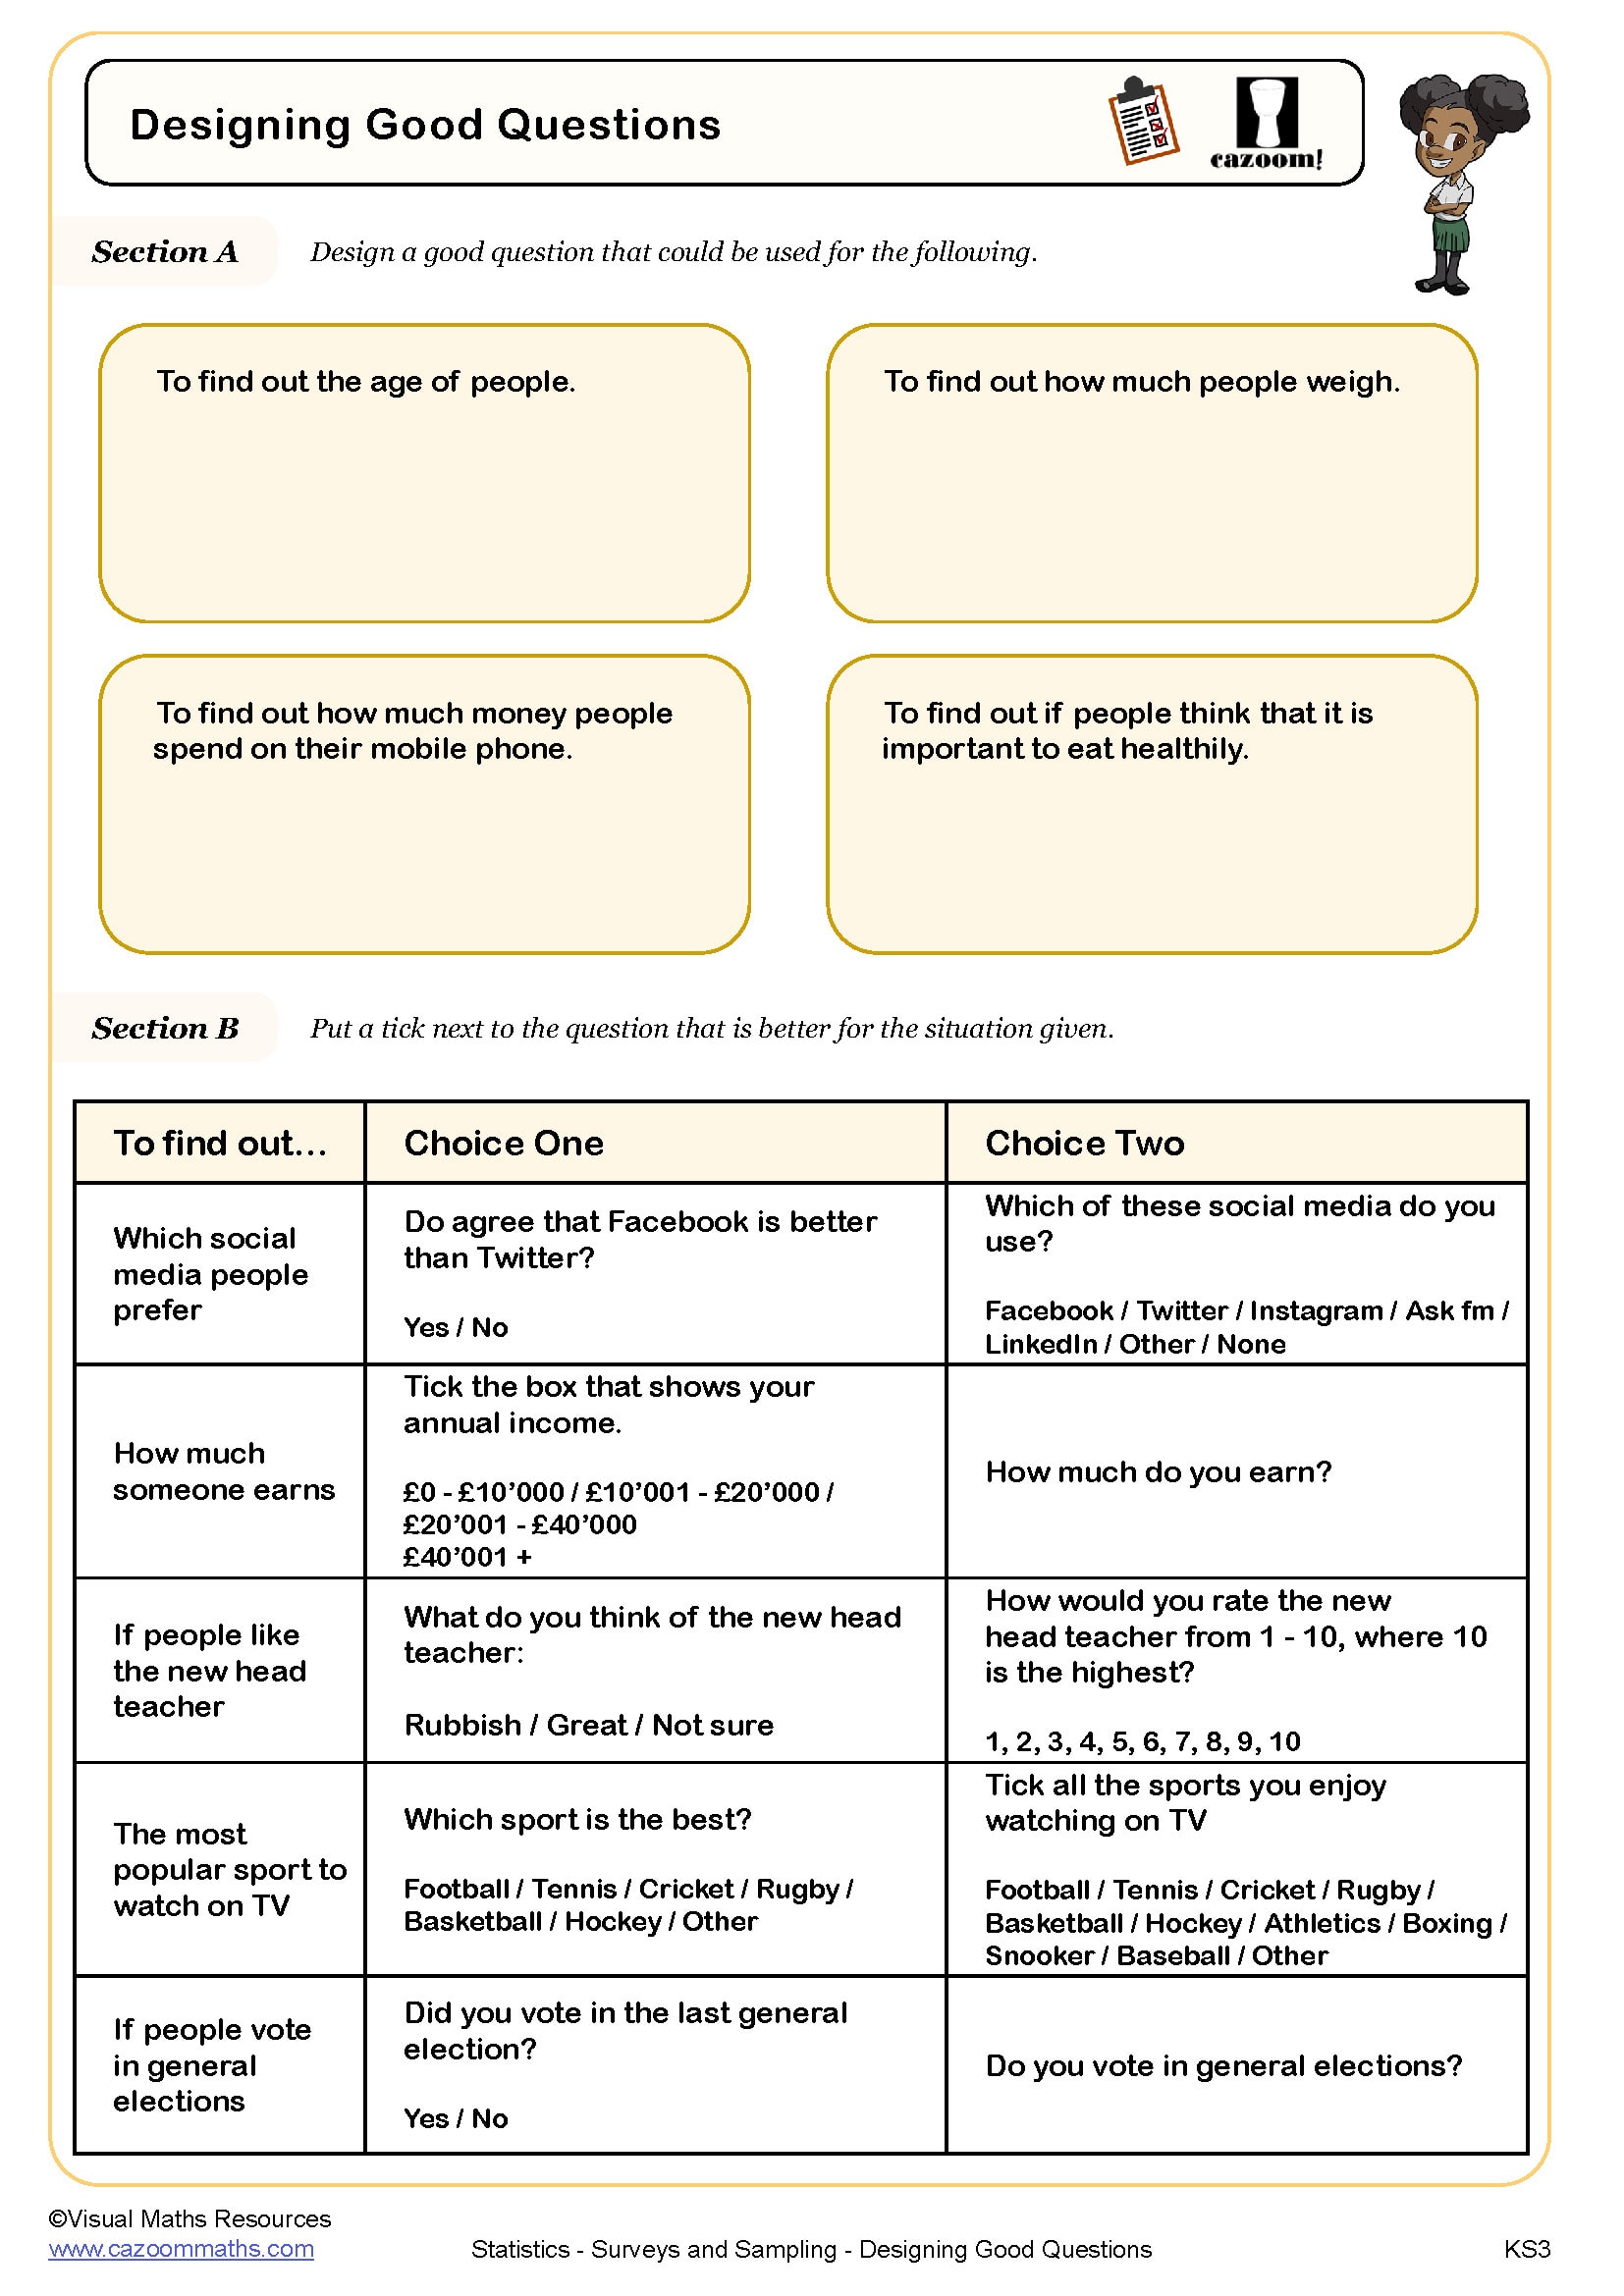
Designing Good Questions
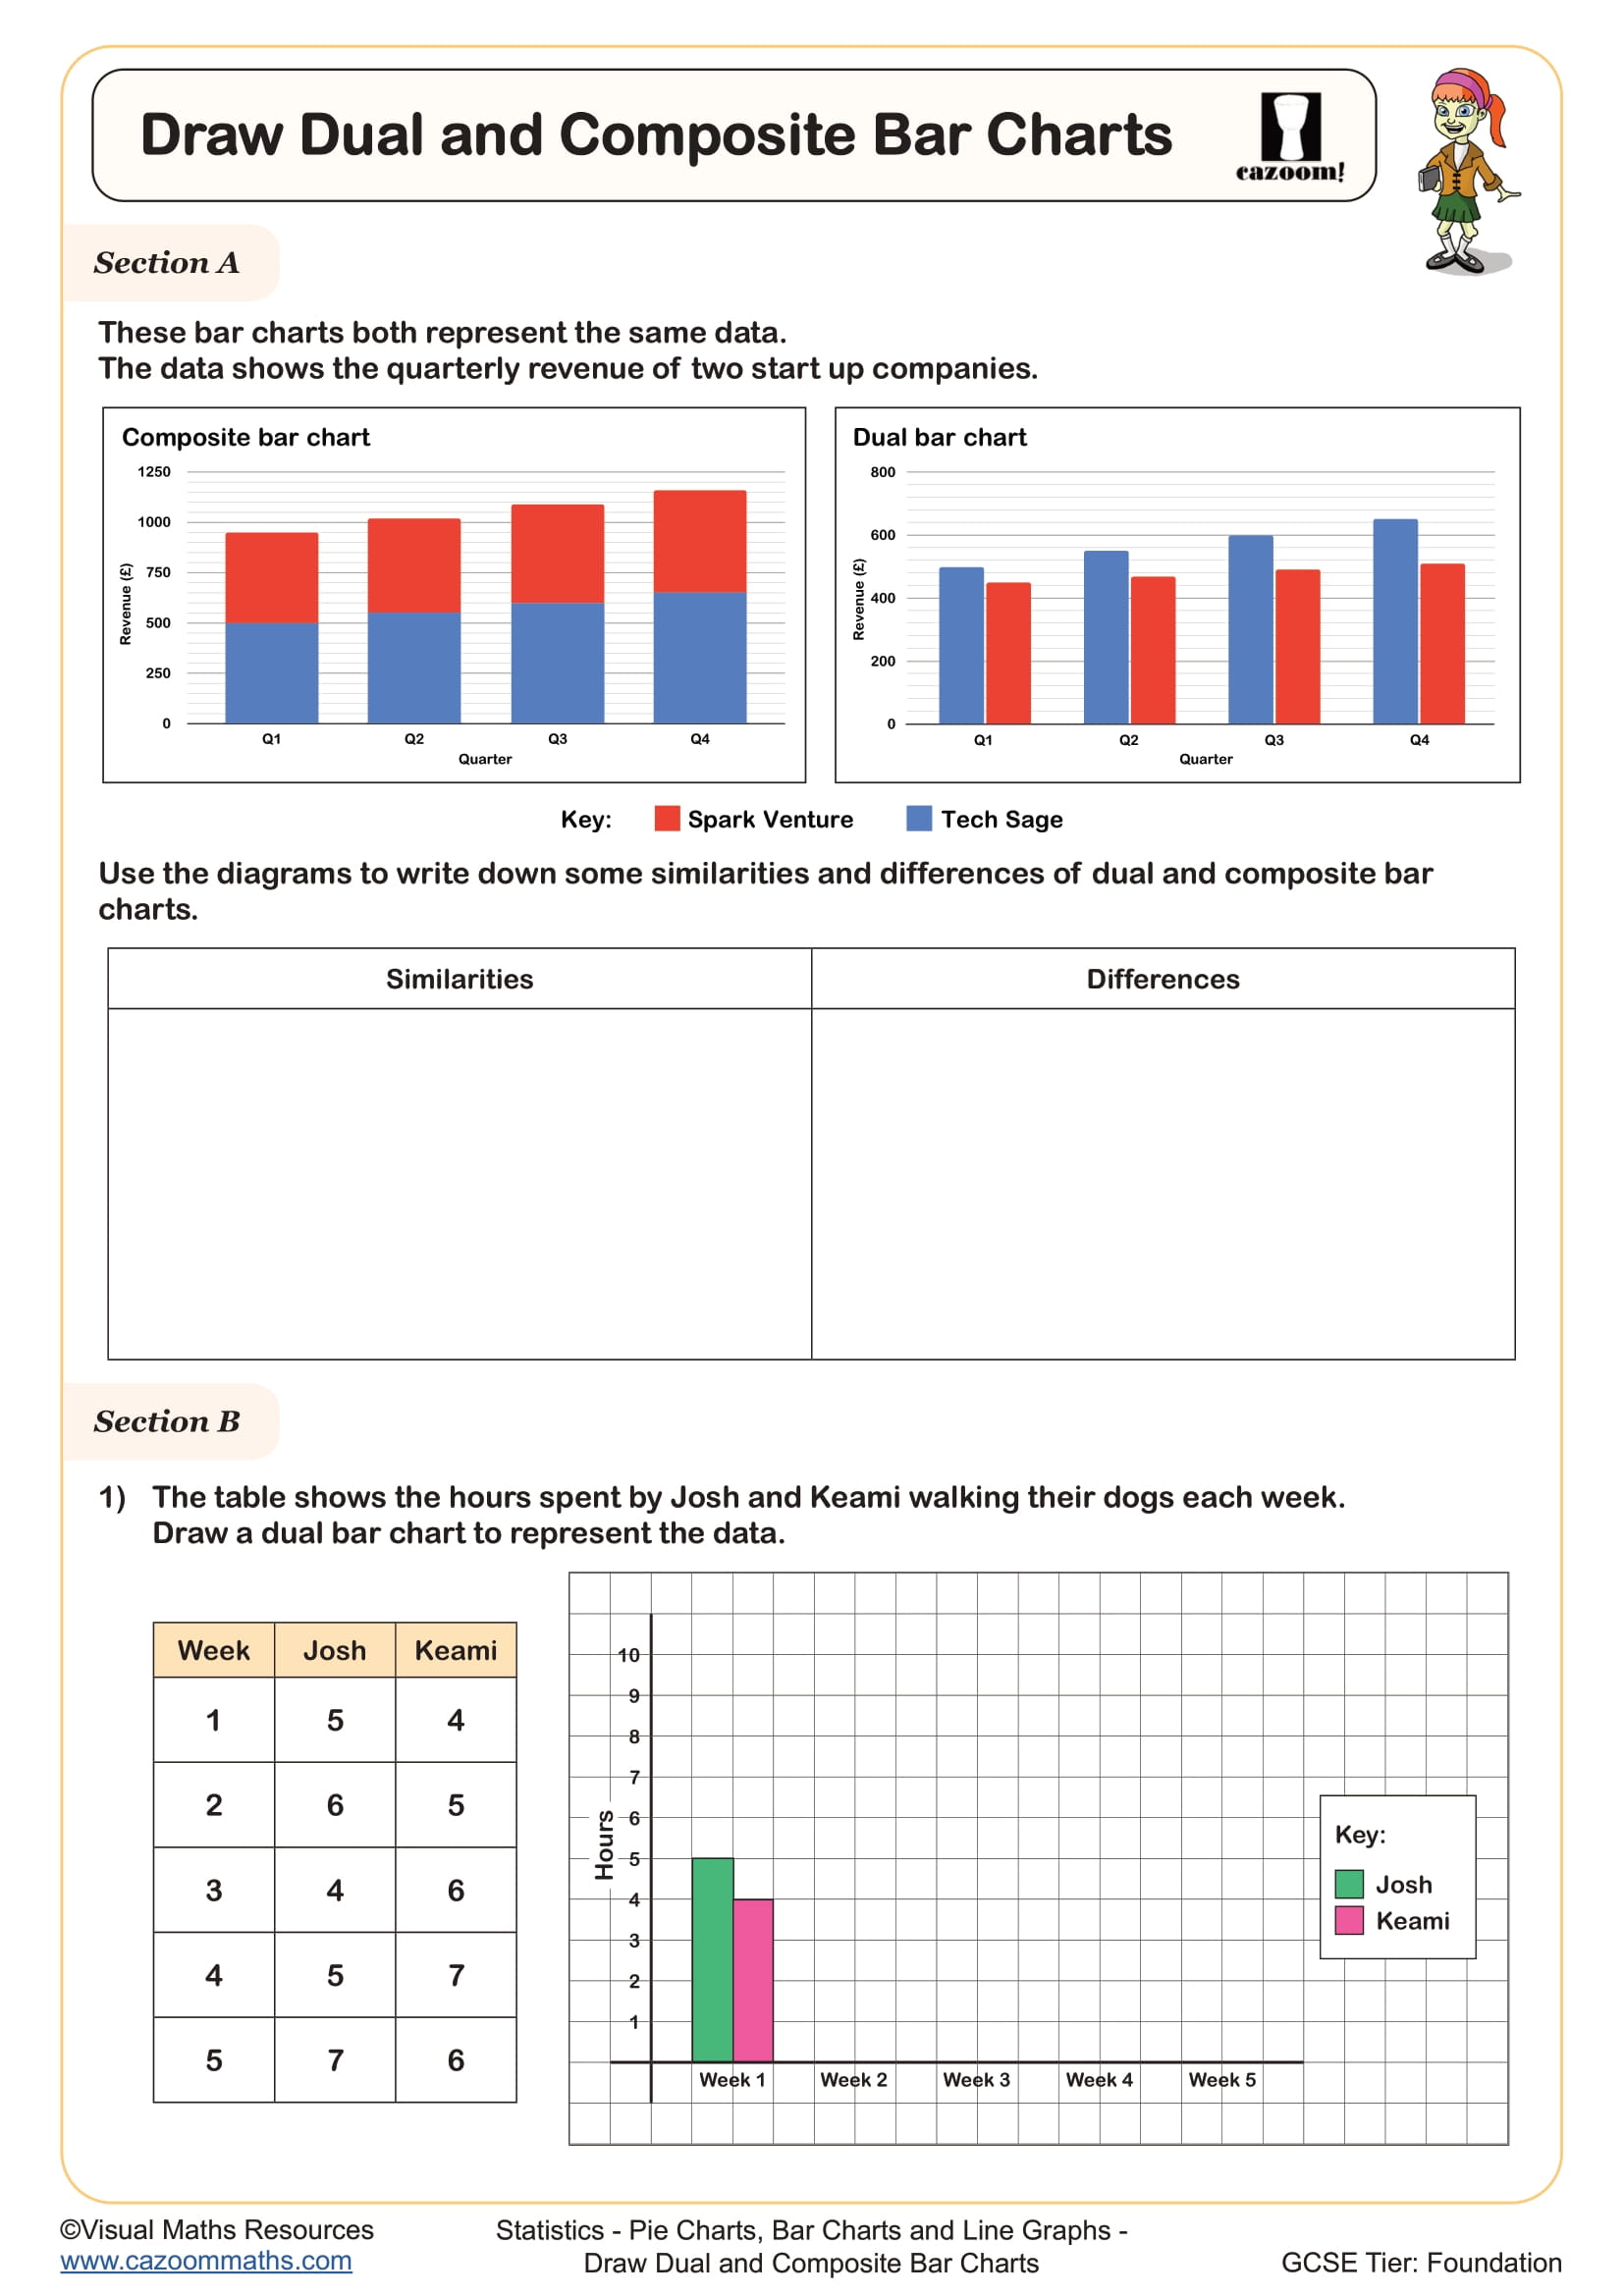
Draw Composite and Dual Bar Charts
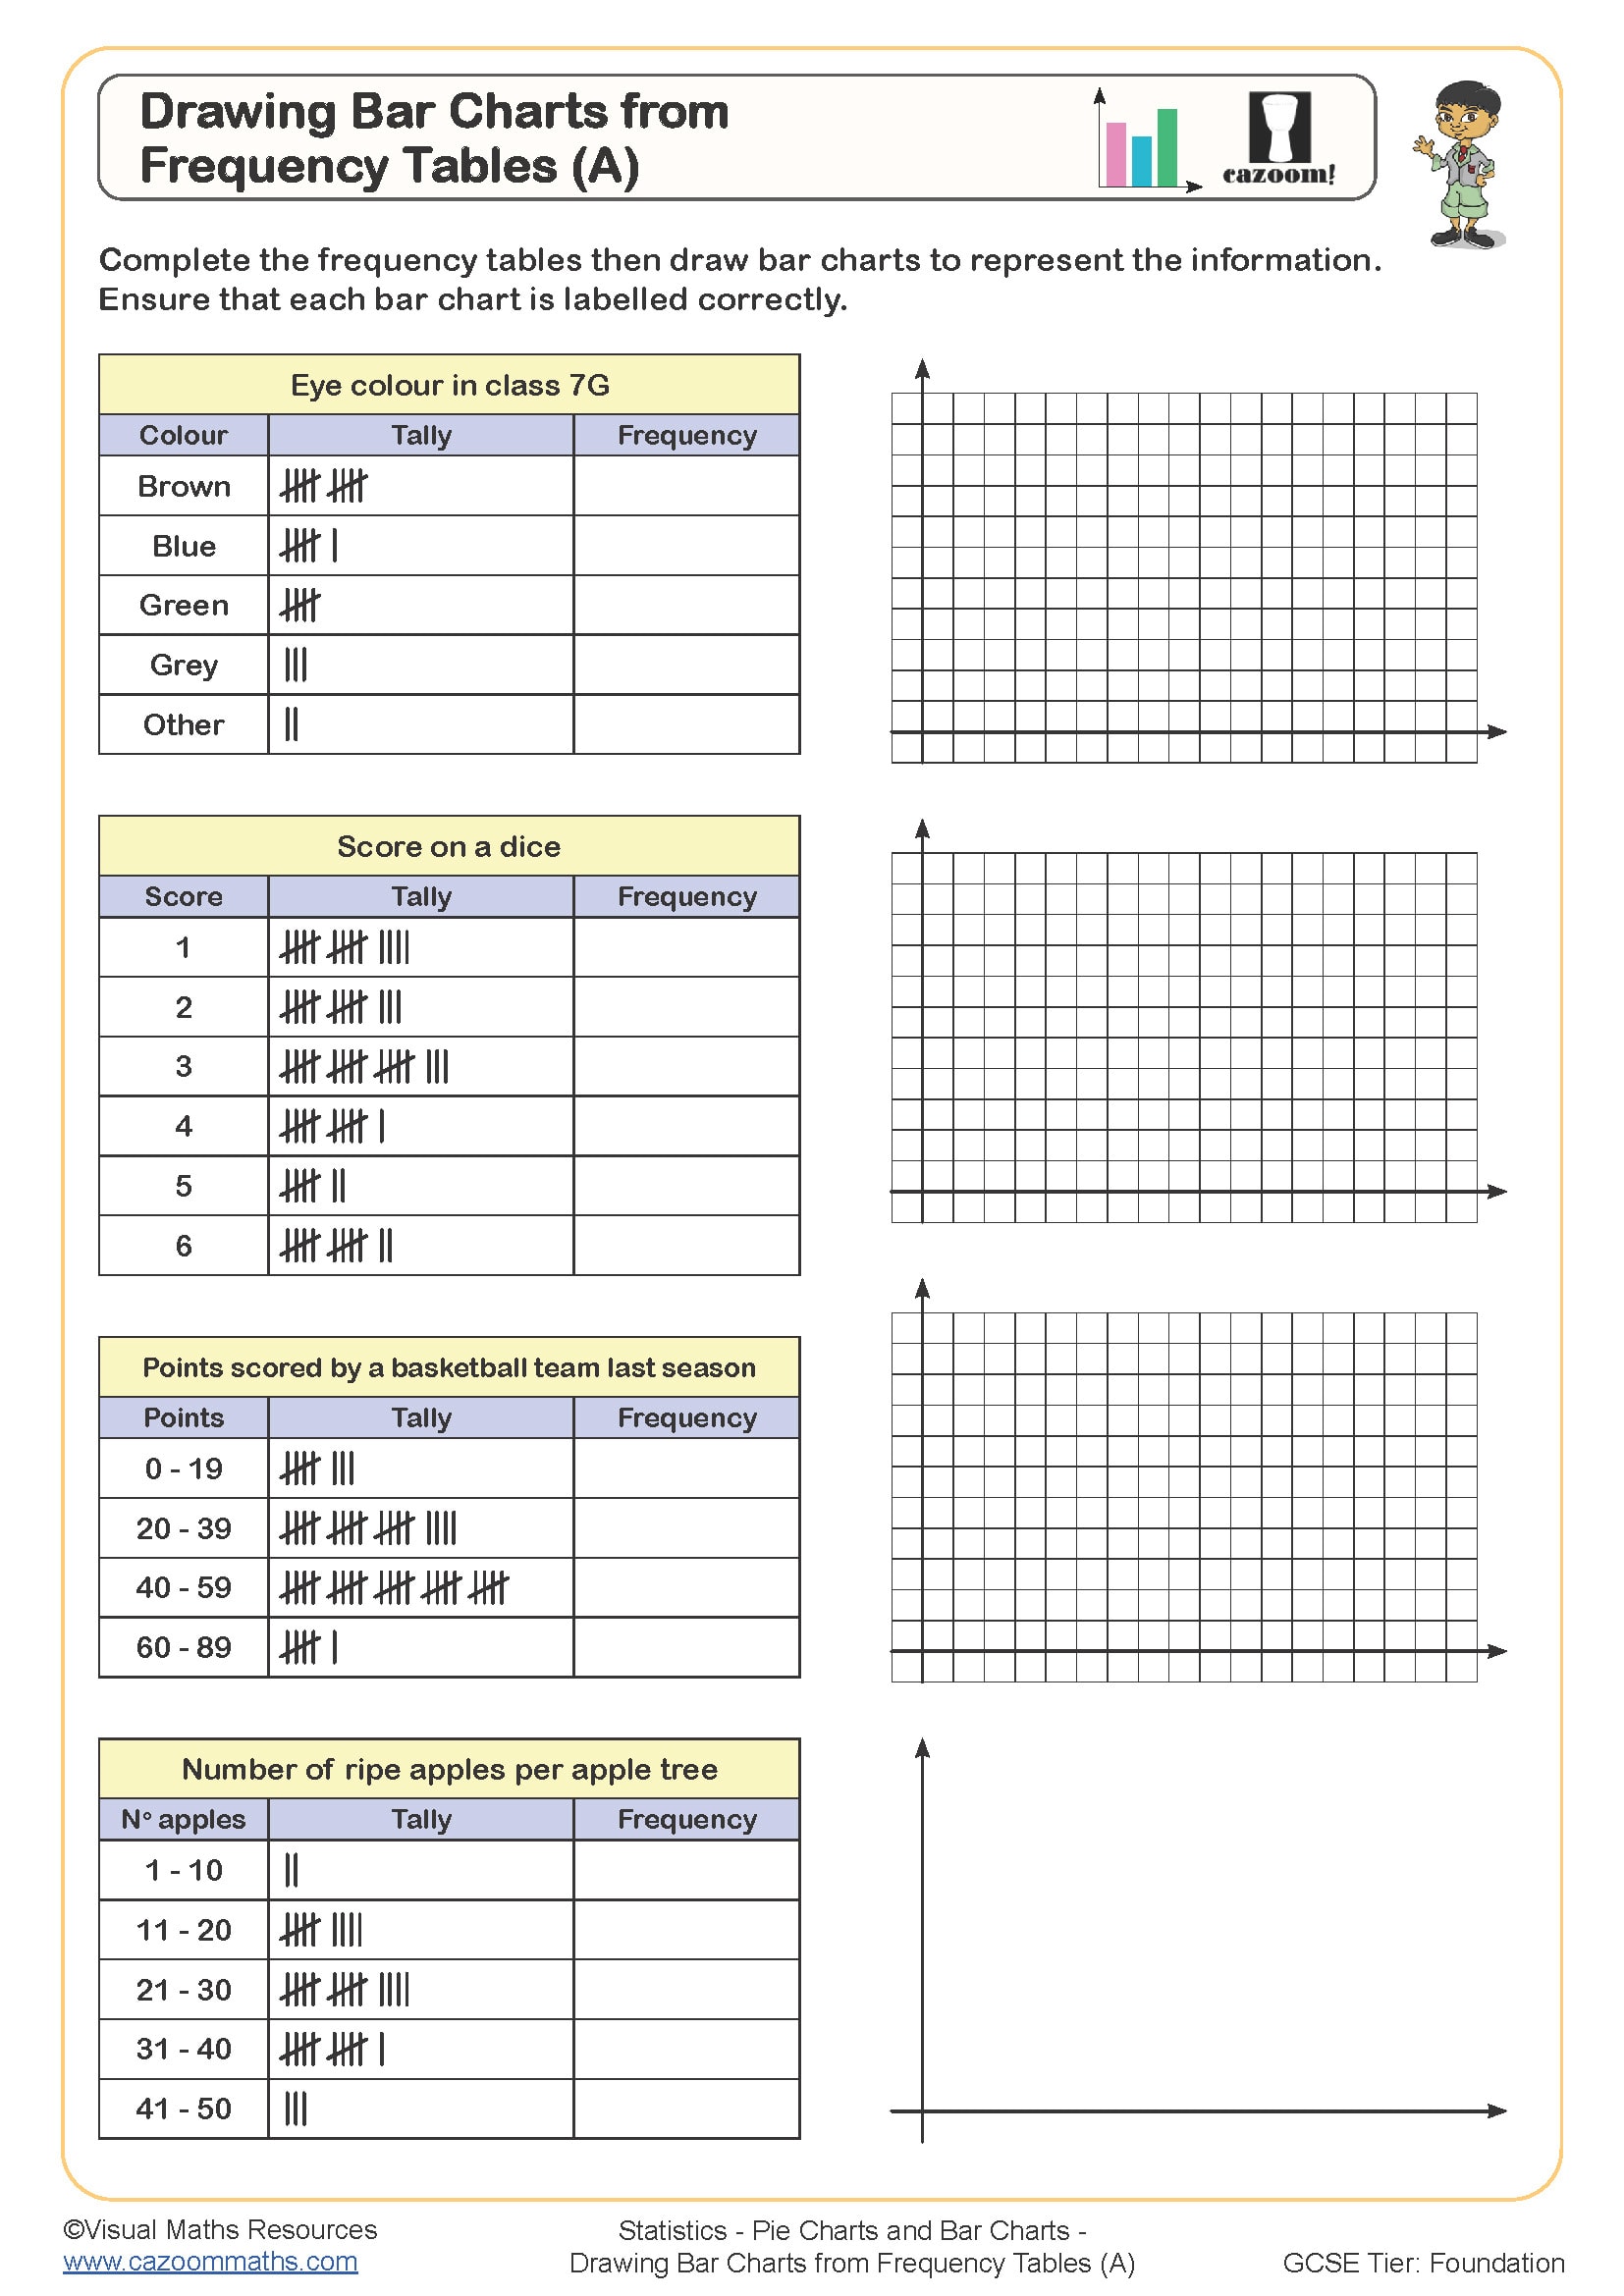
Drawing Bar Charts from Frequency Tables (A)
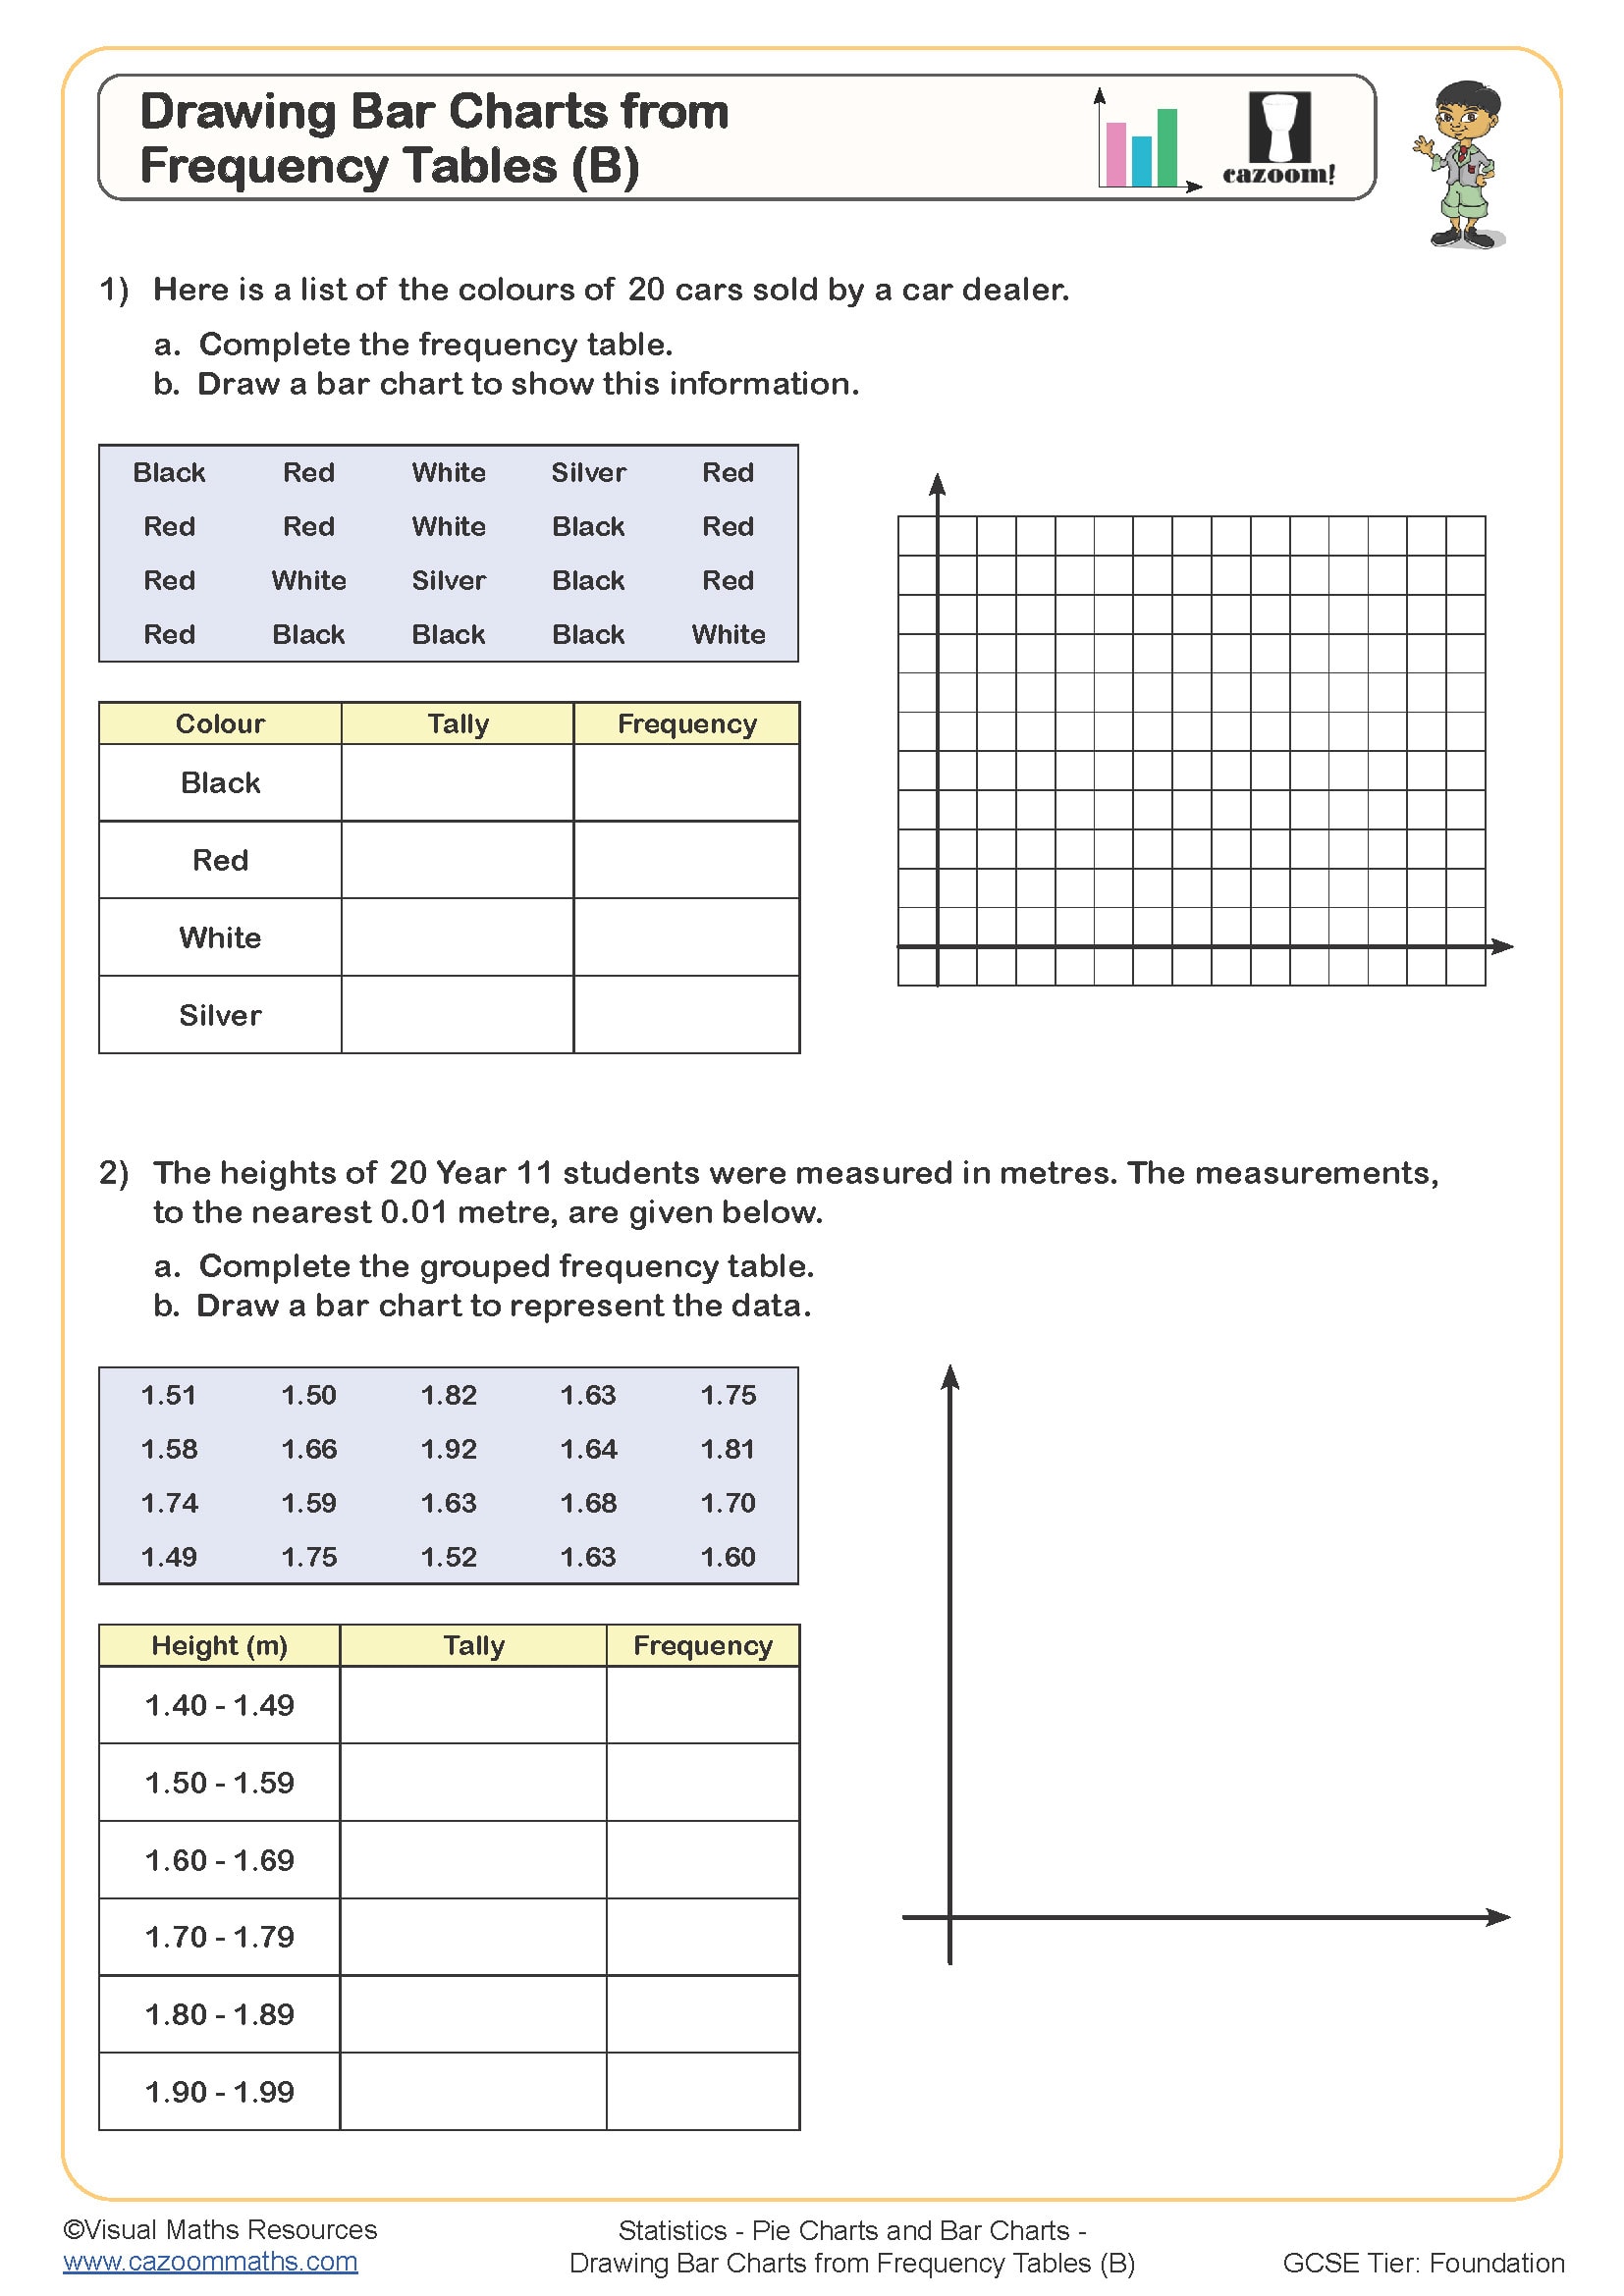
Drawing Bar Charts from Frequency Tables (B)
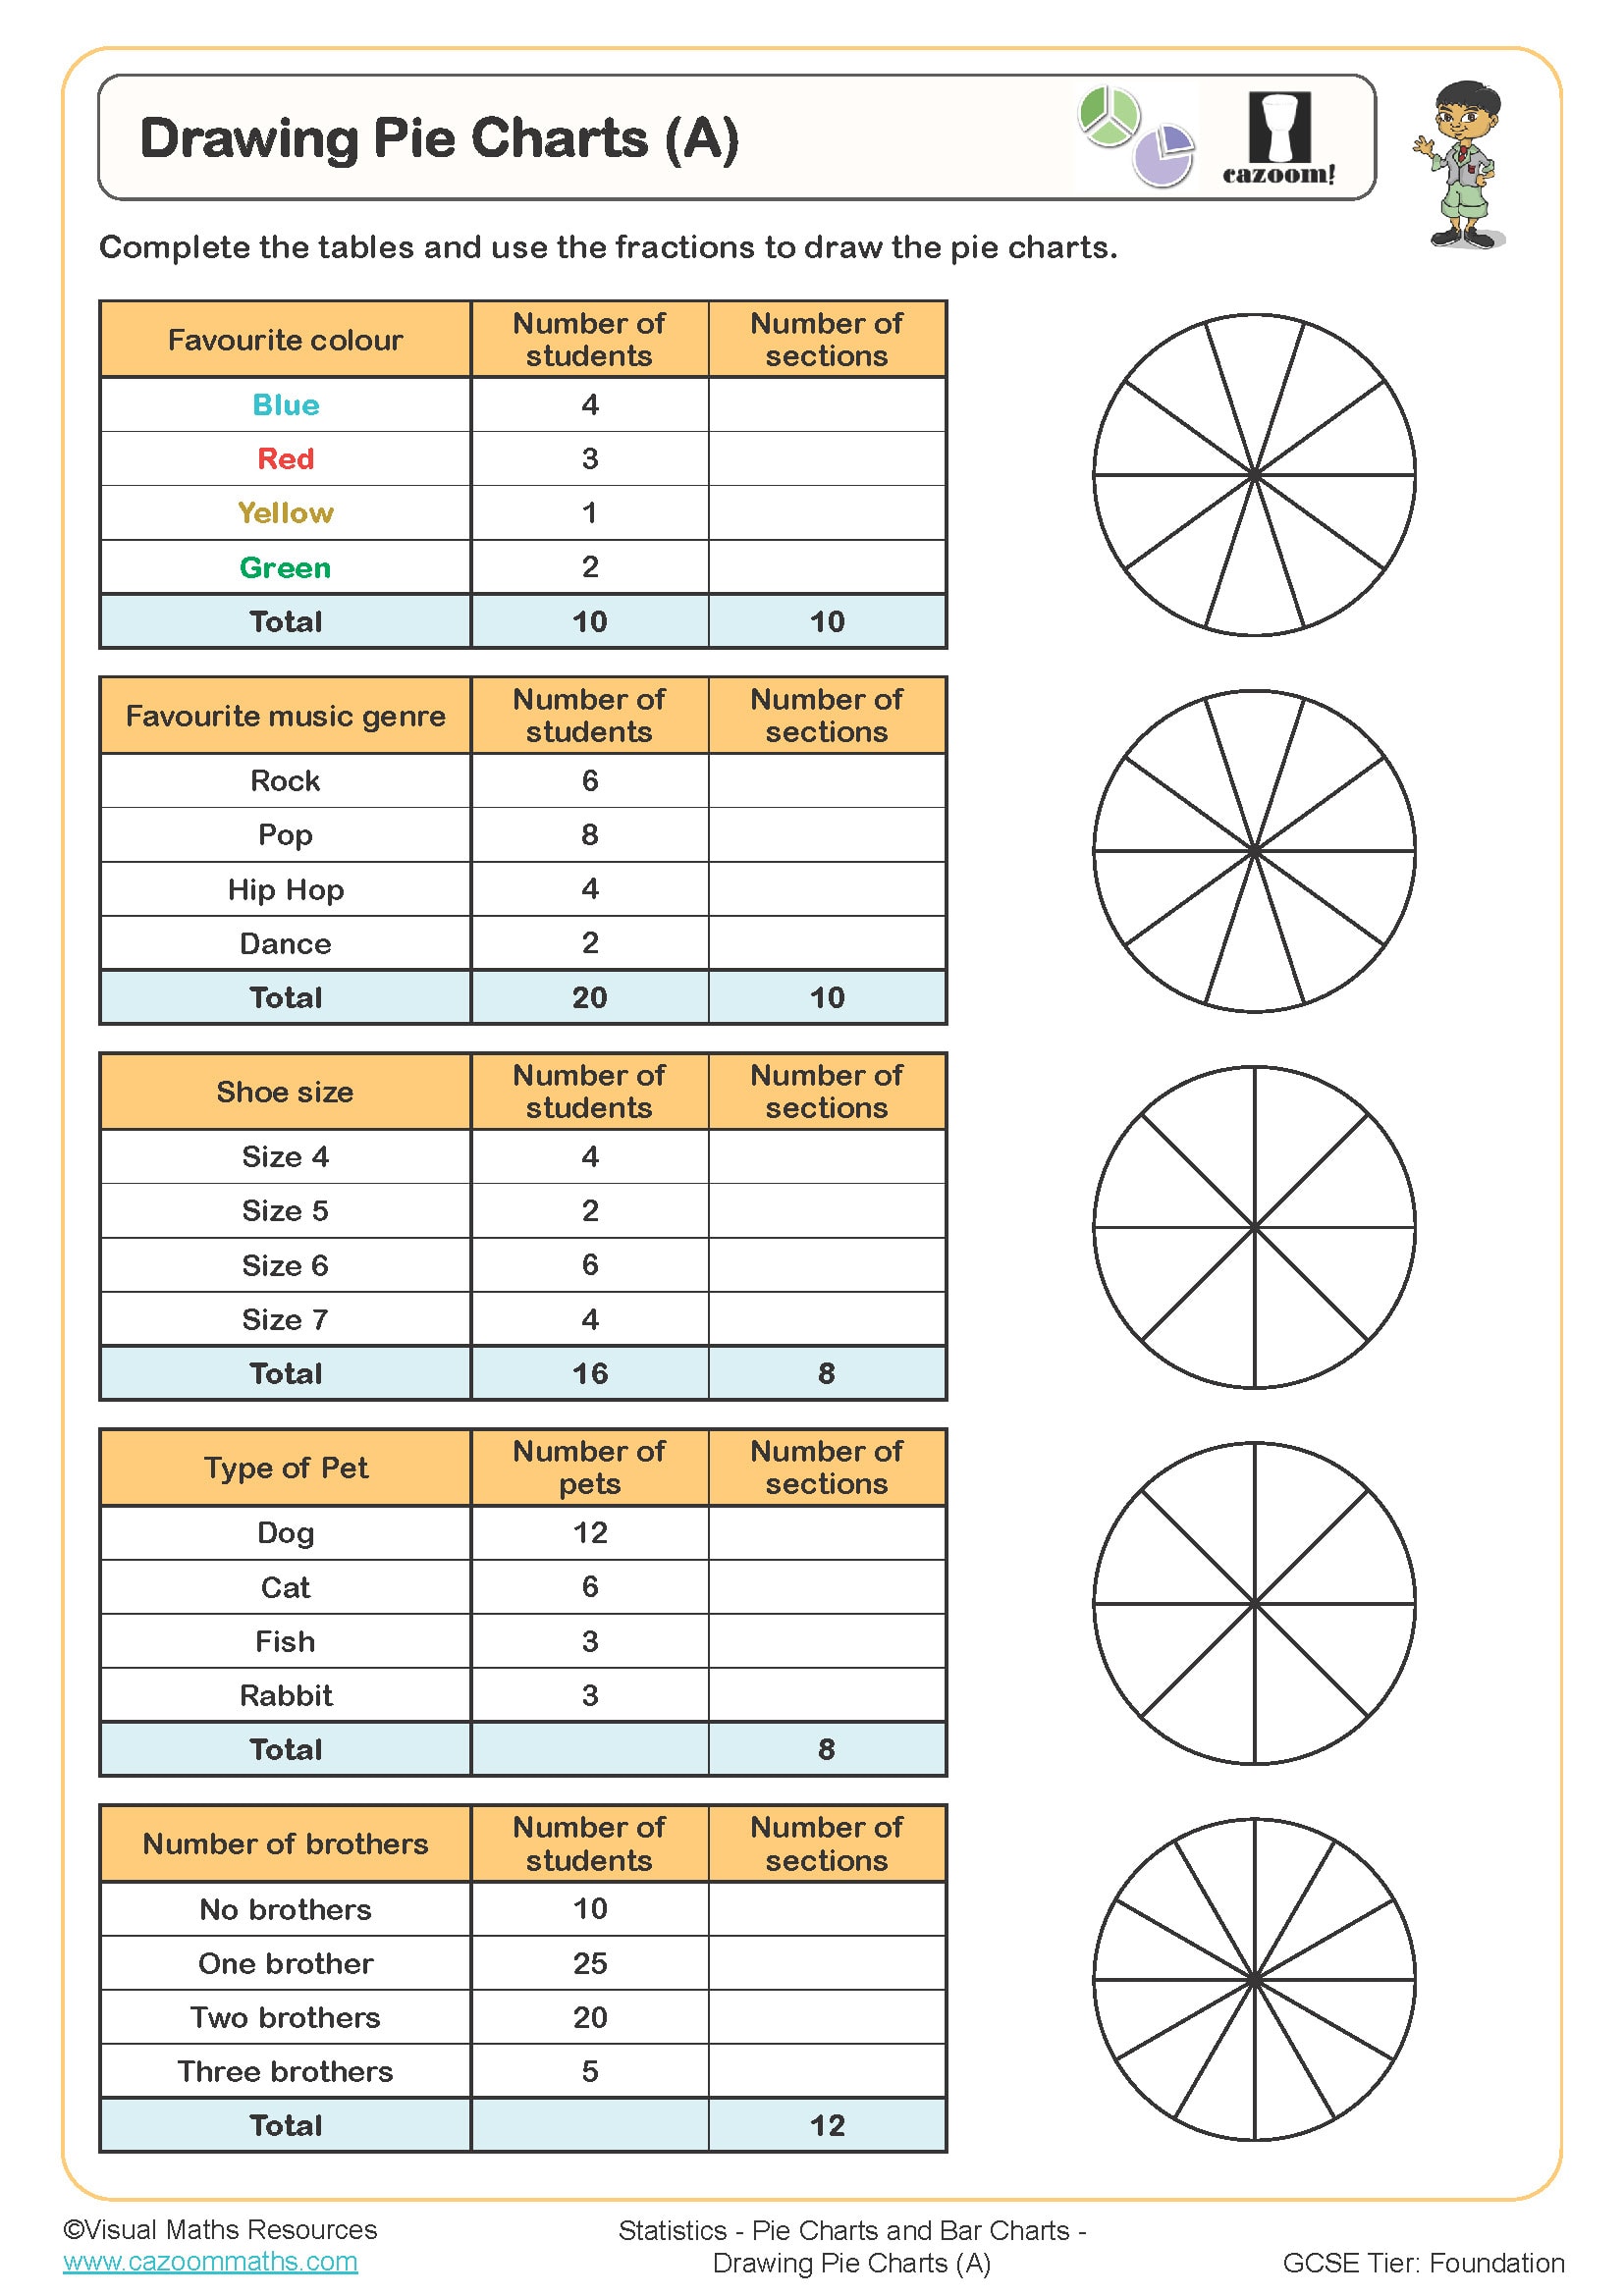
Drawing Pie Charts (A)
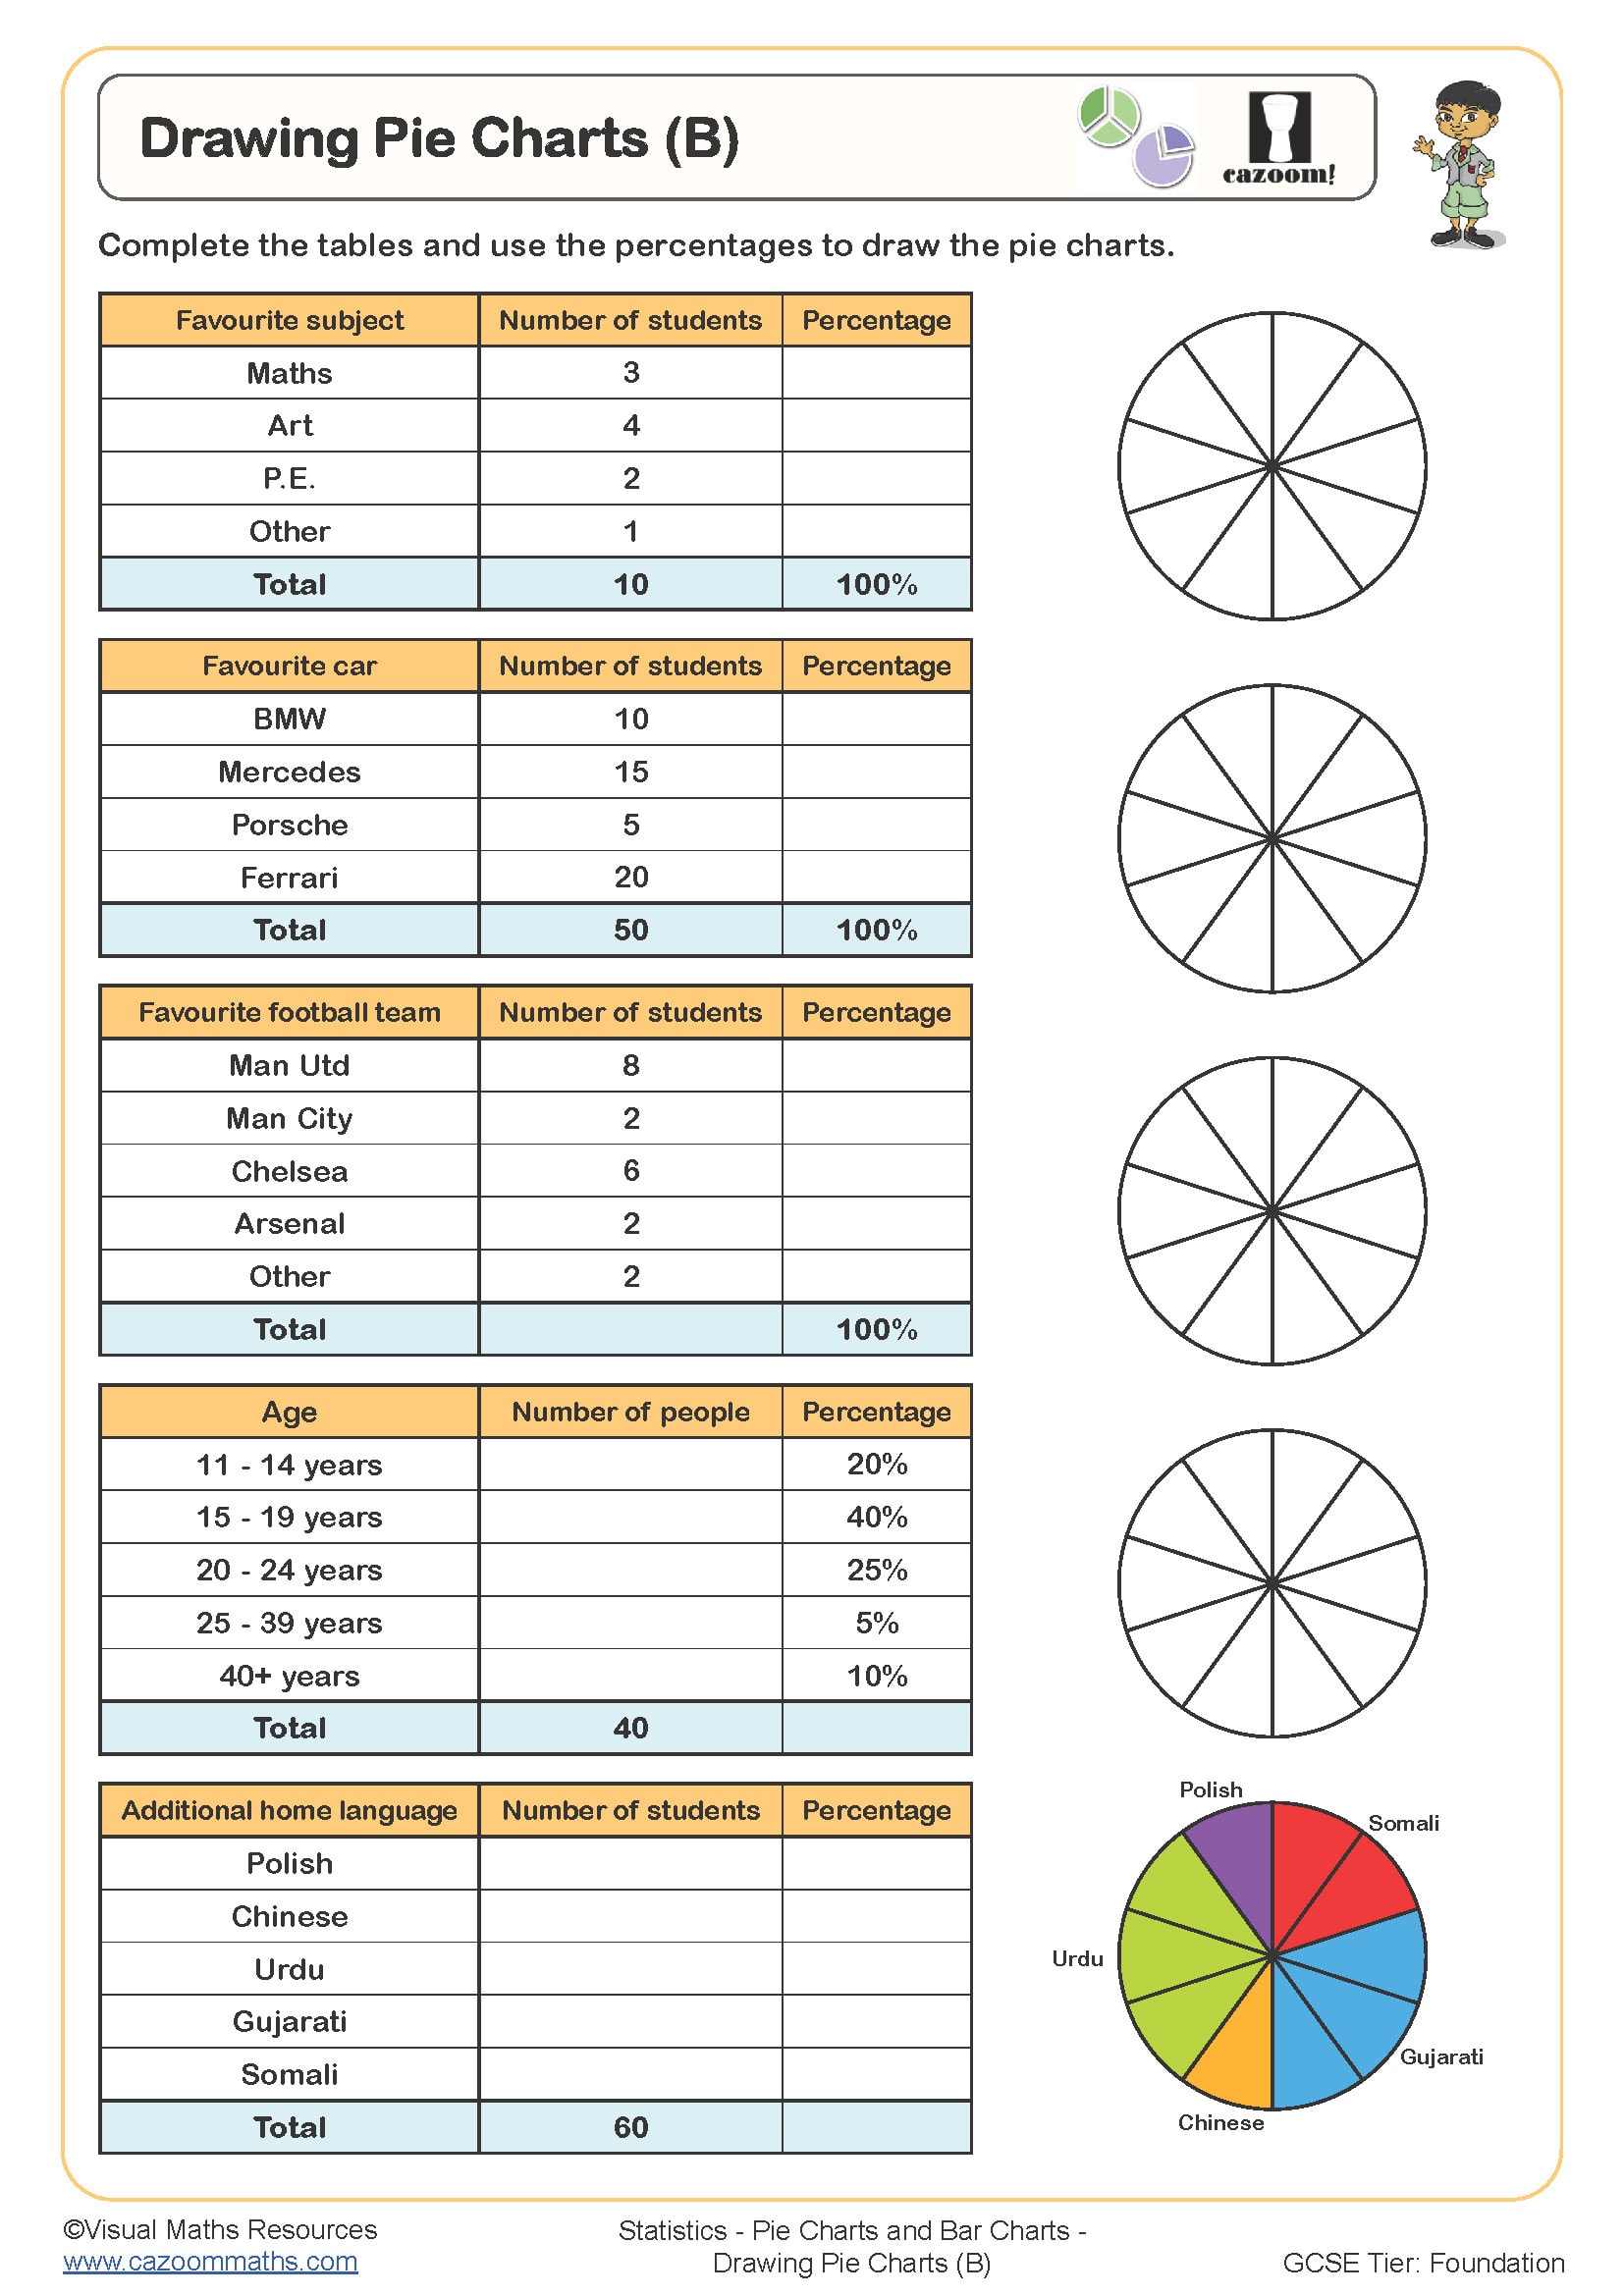
Drawing Pie Charts (B)
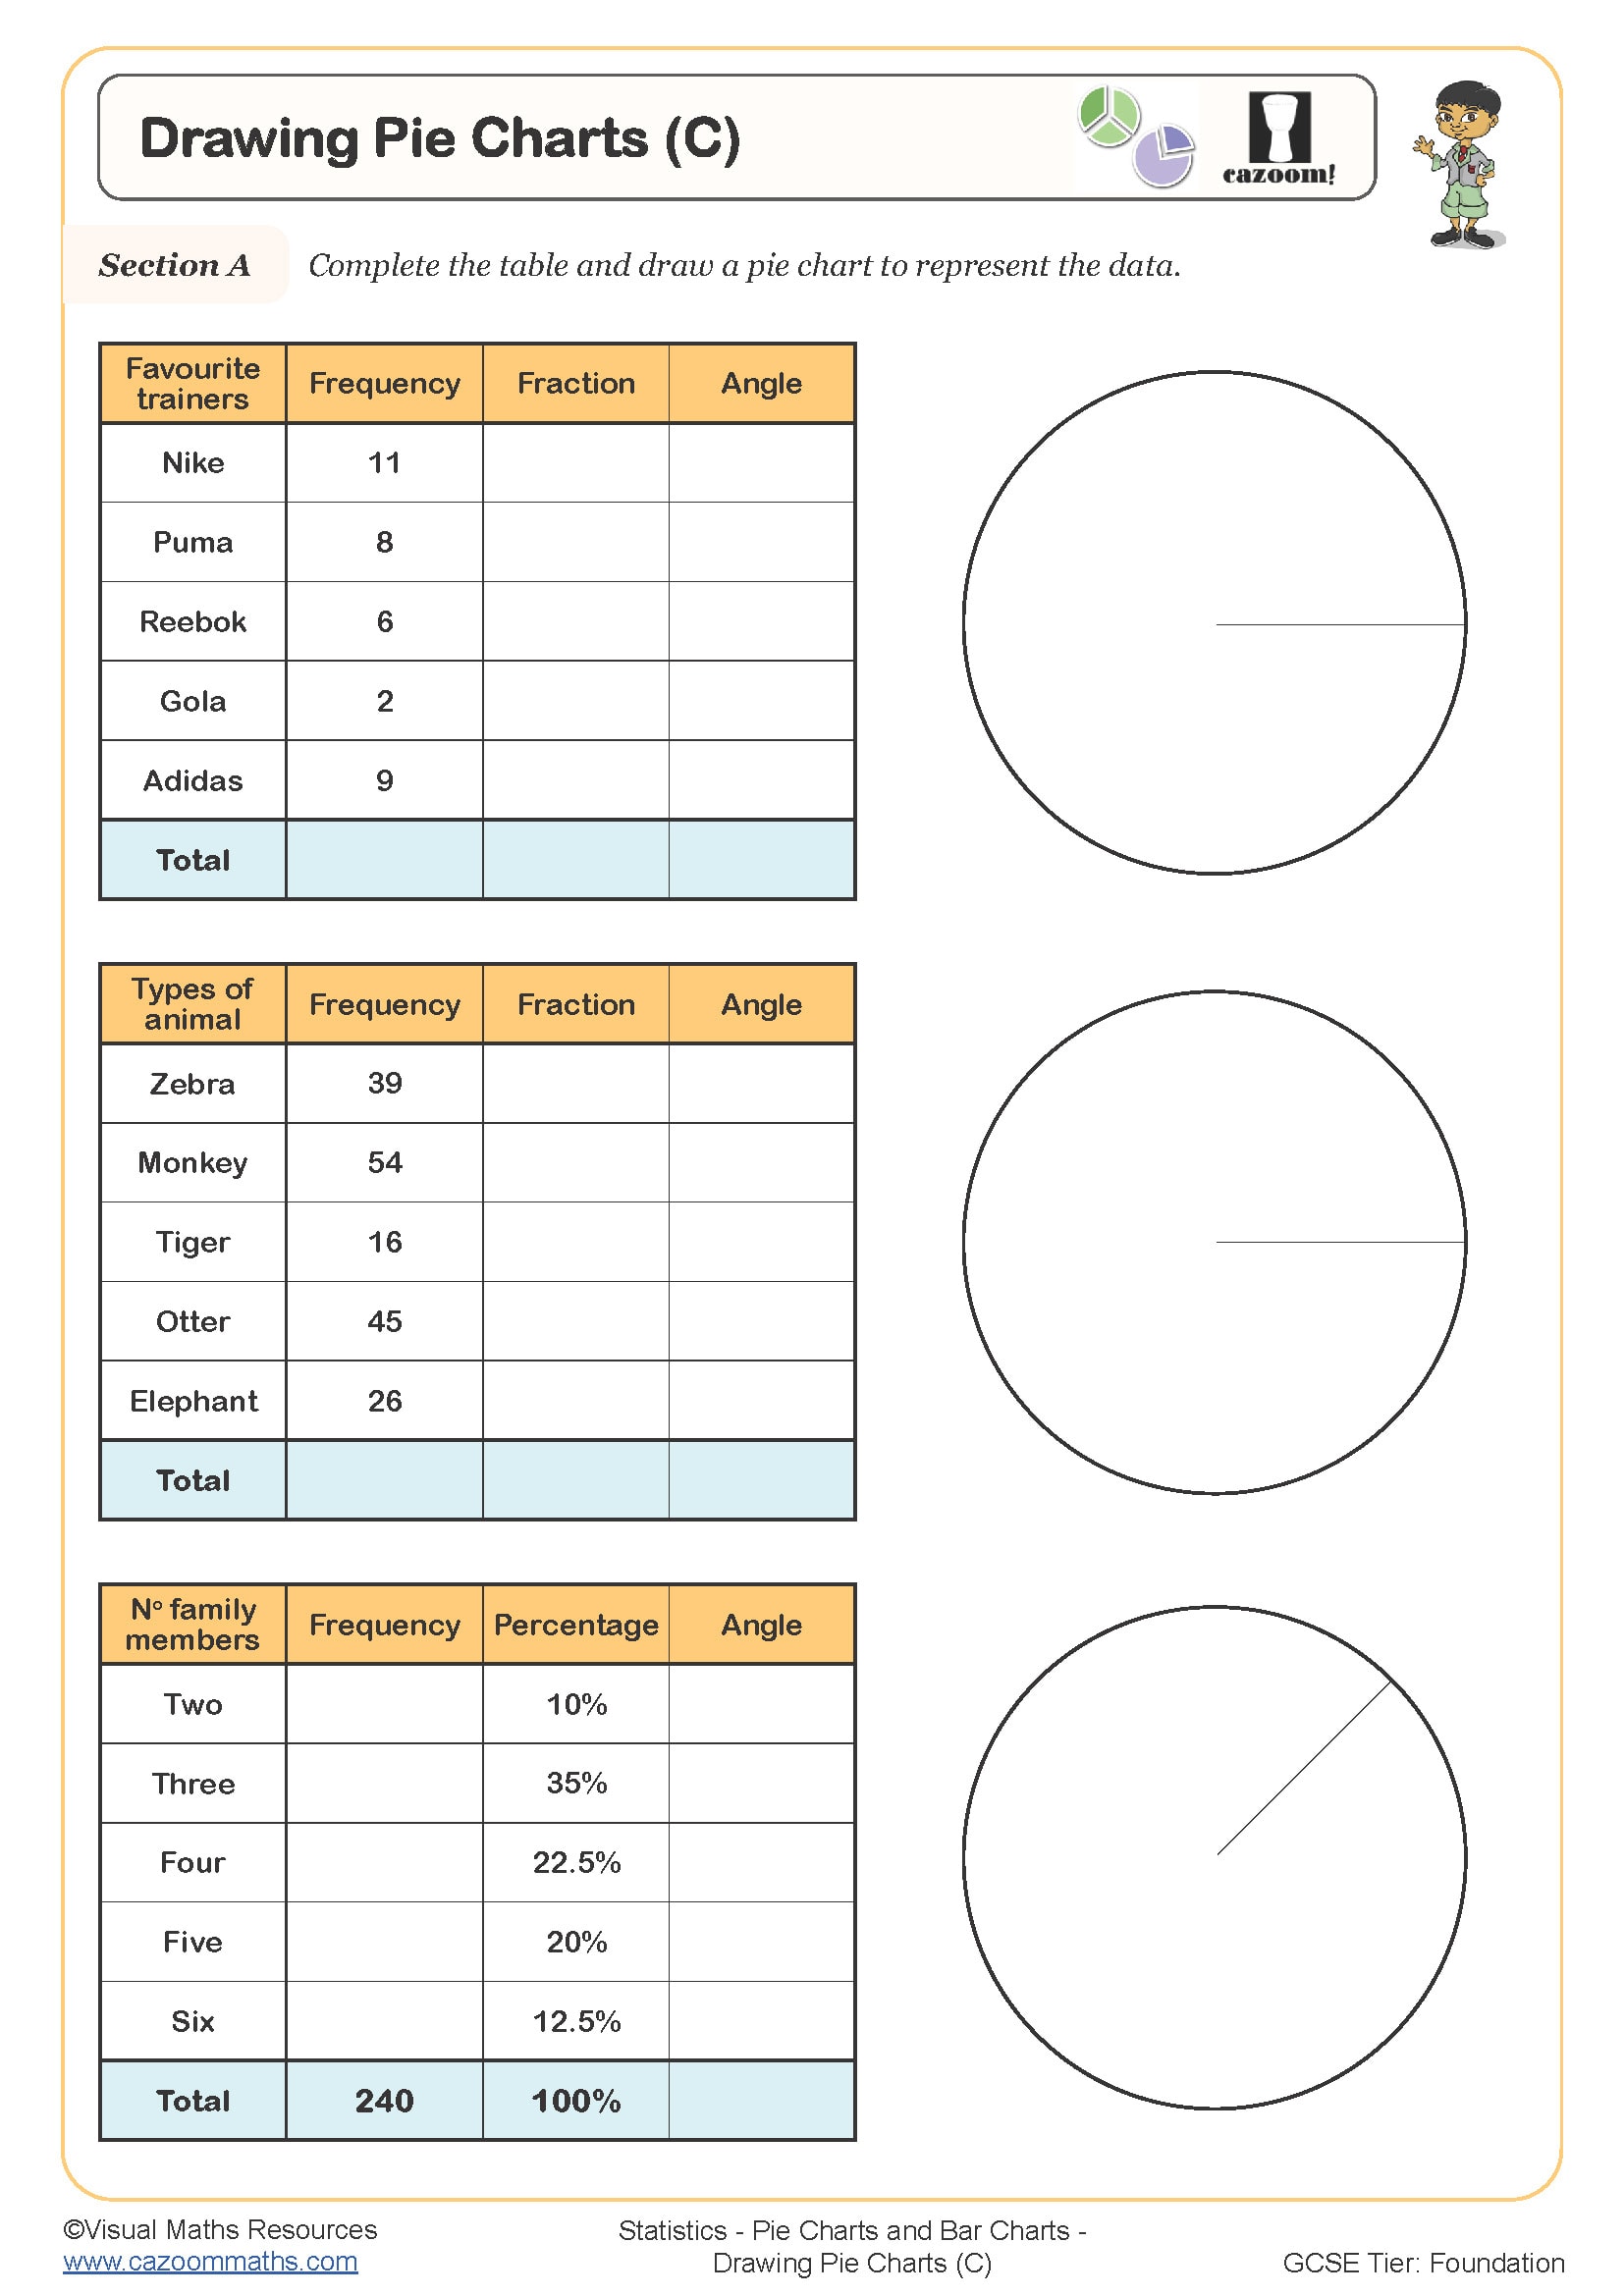
Drawing Pie Charts (C)
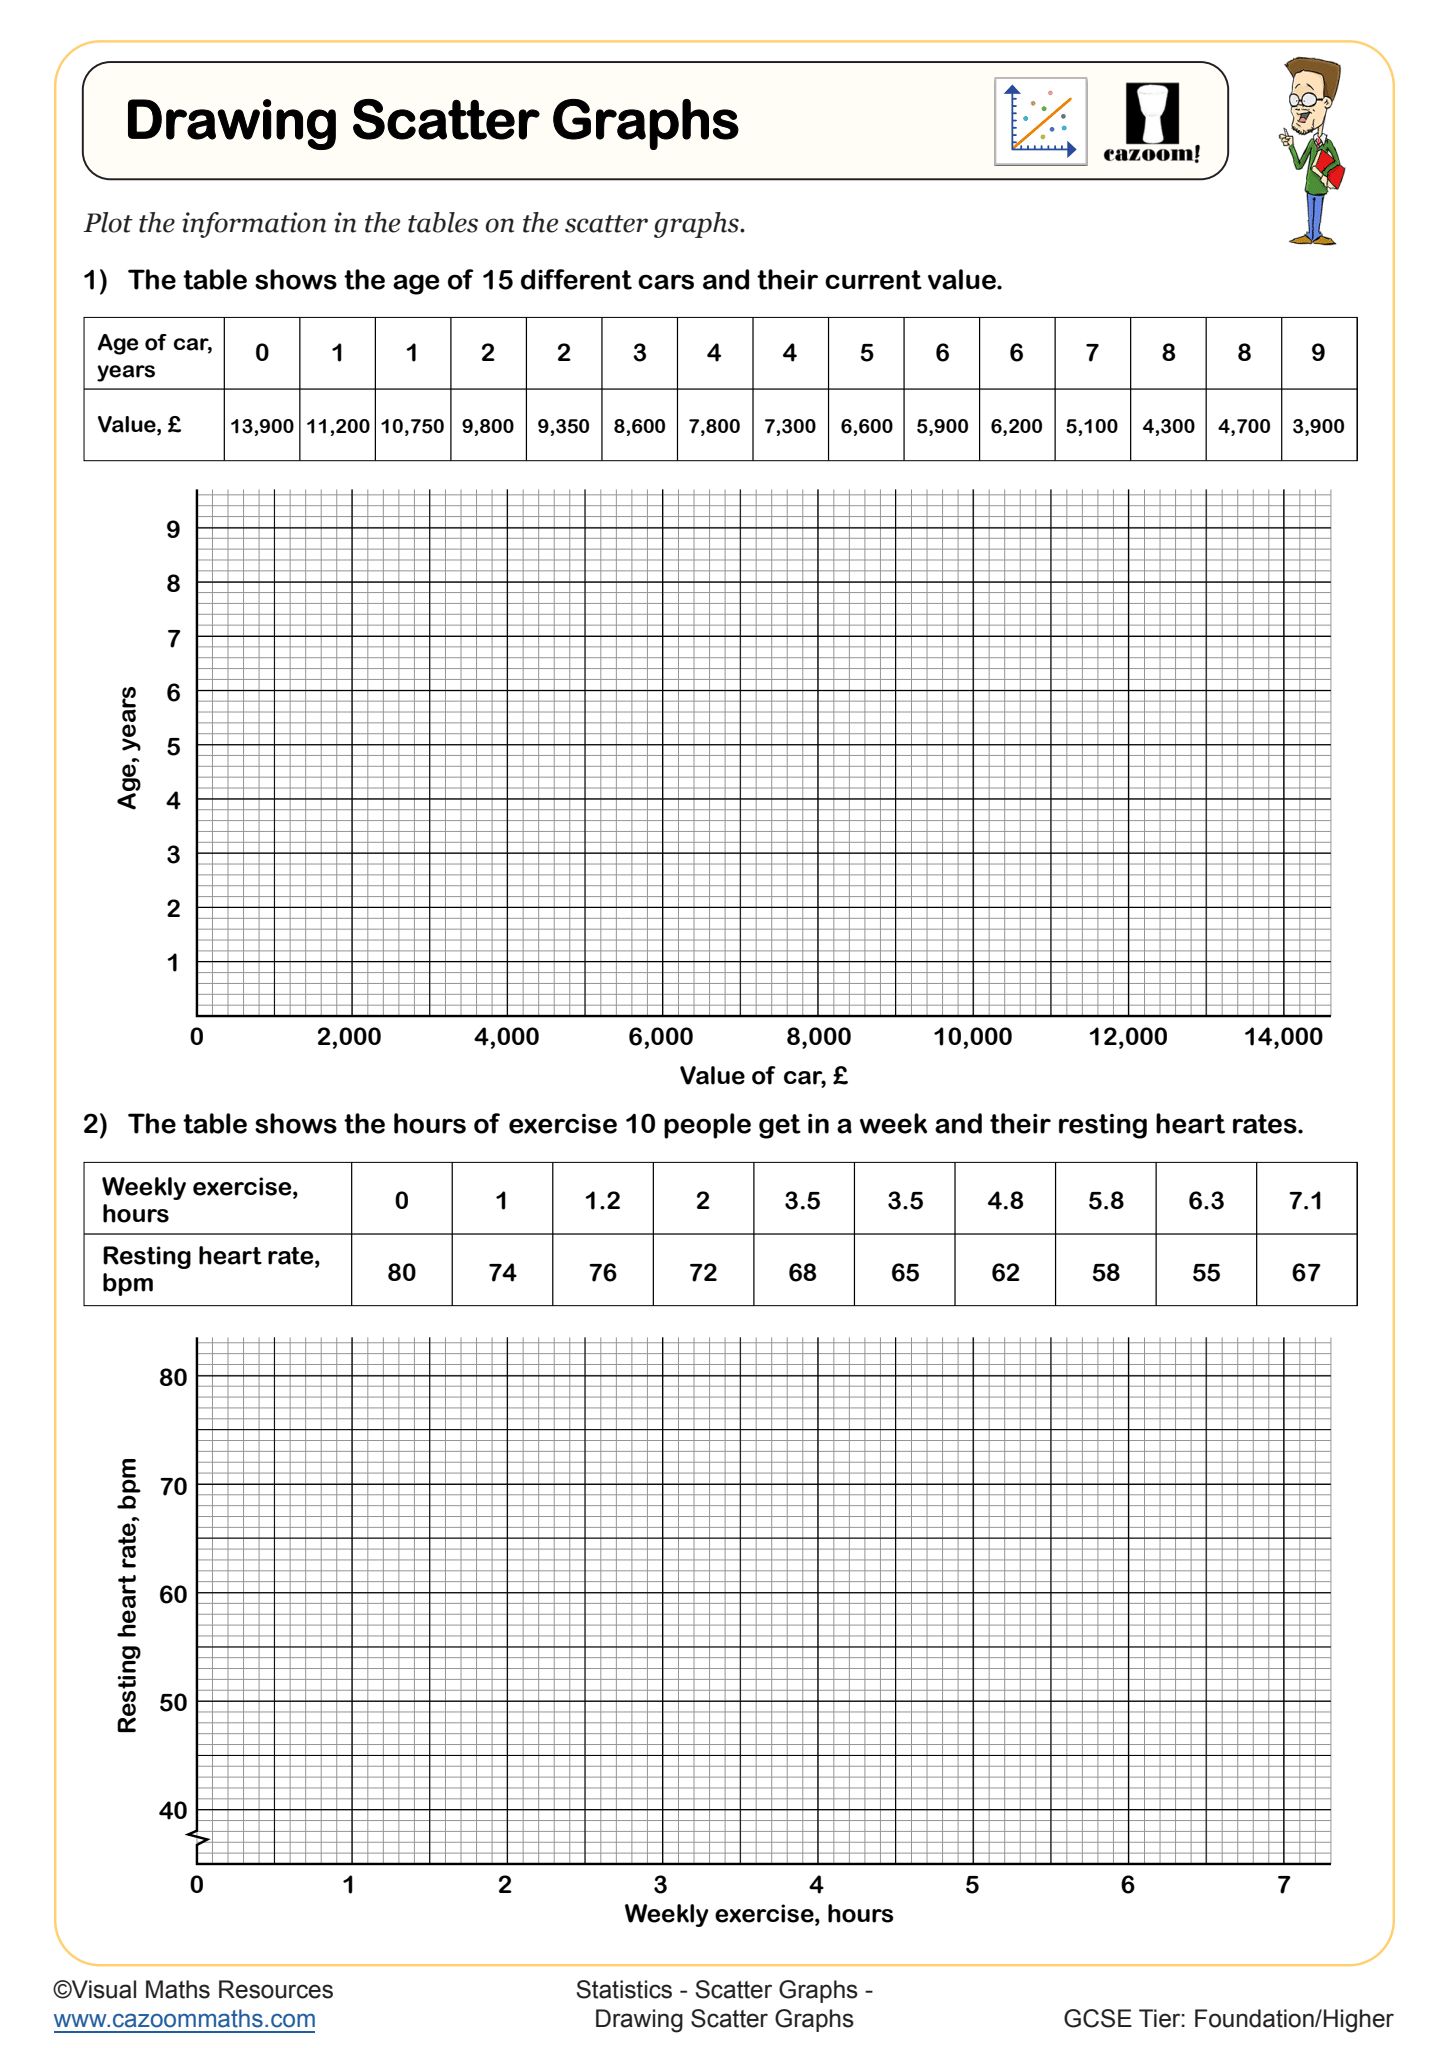
Drawing Scatter Graphs
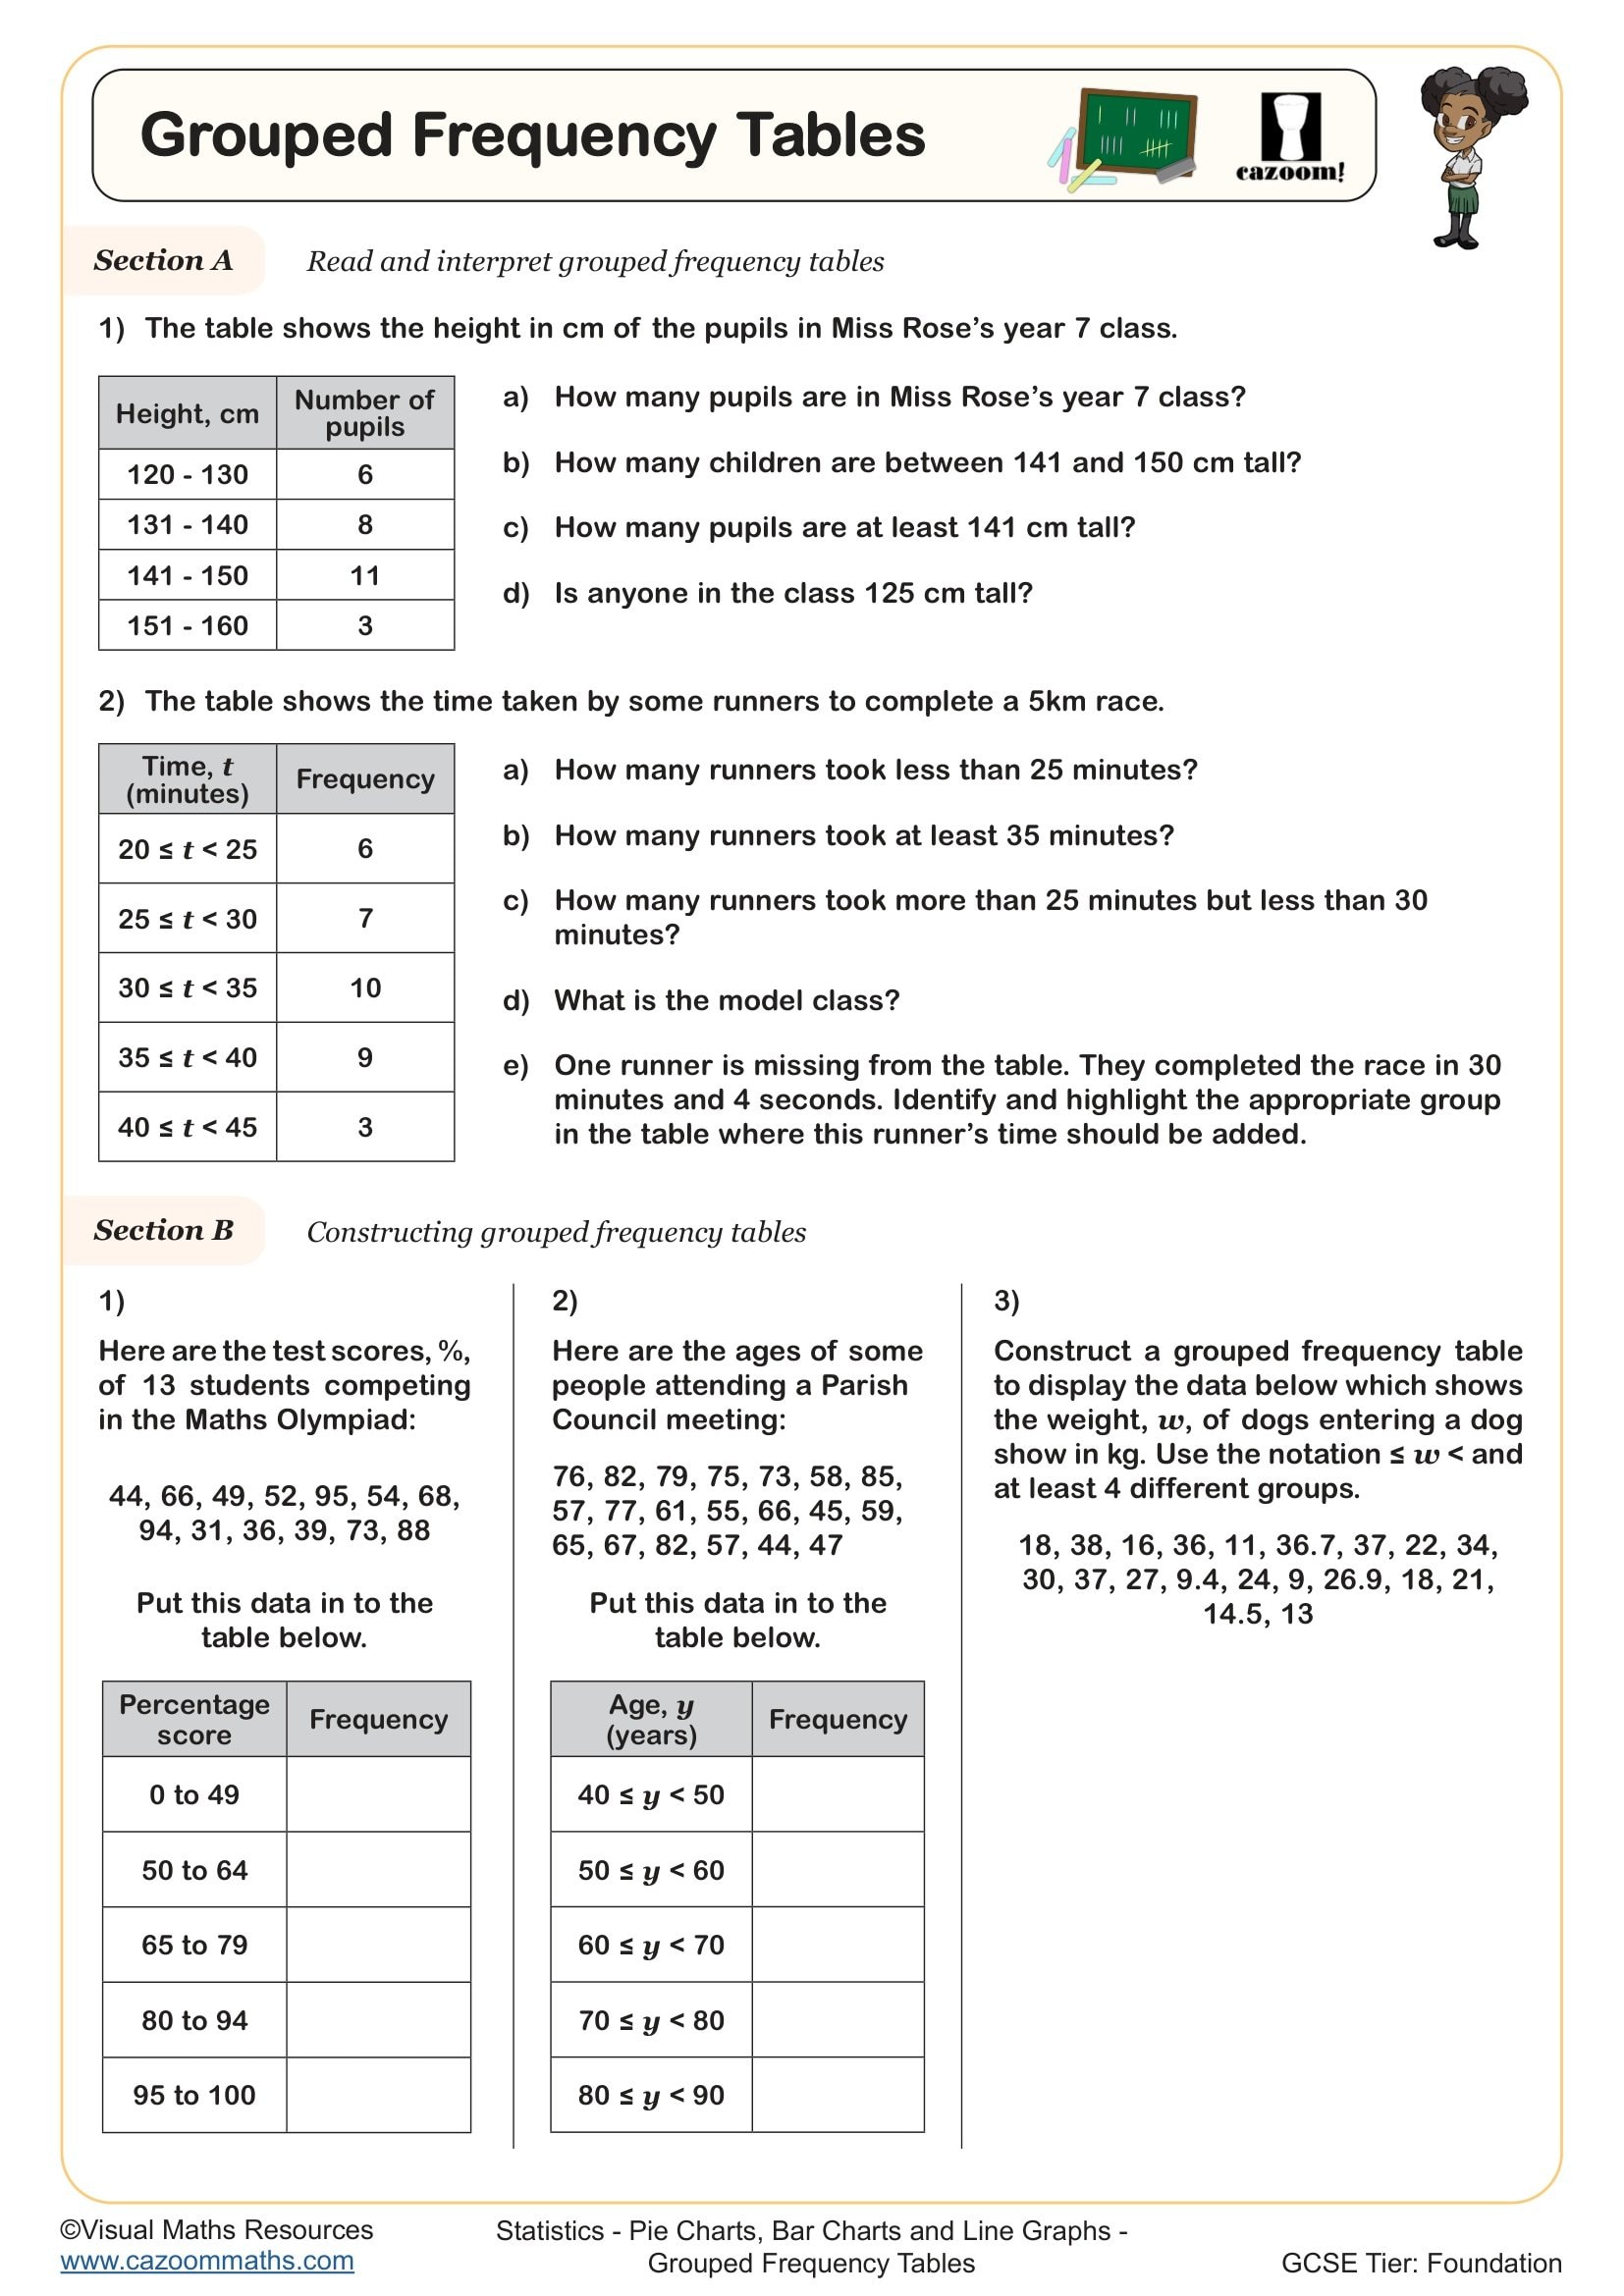
Grouped Frequency Tables
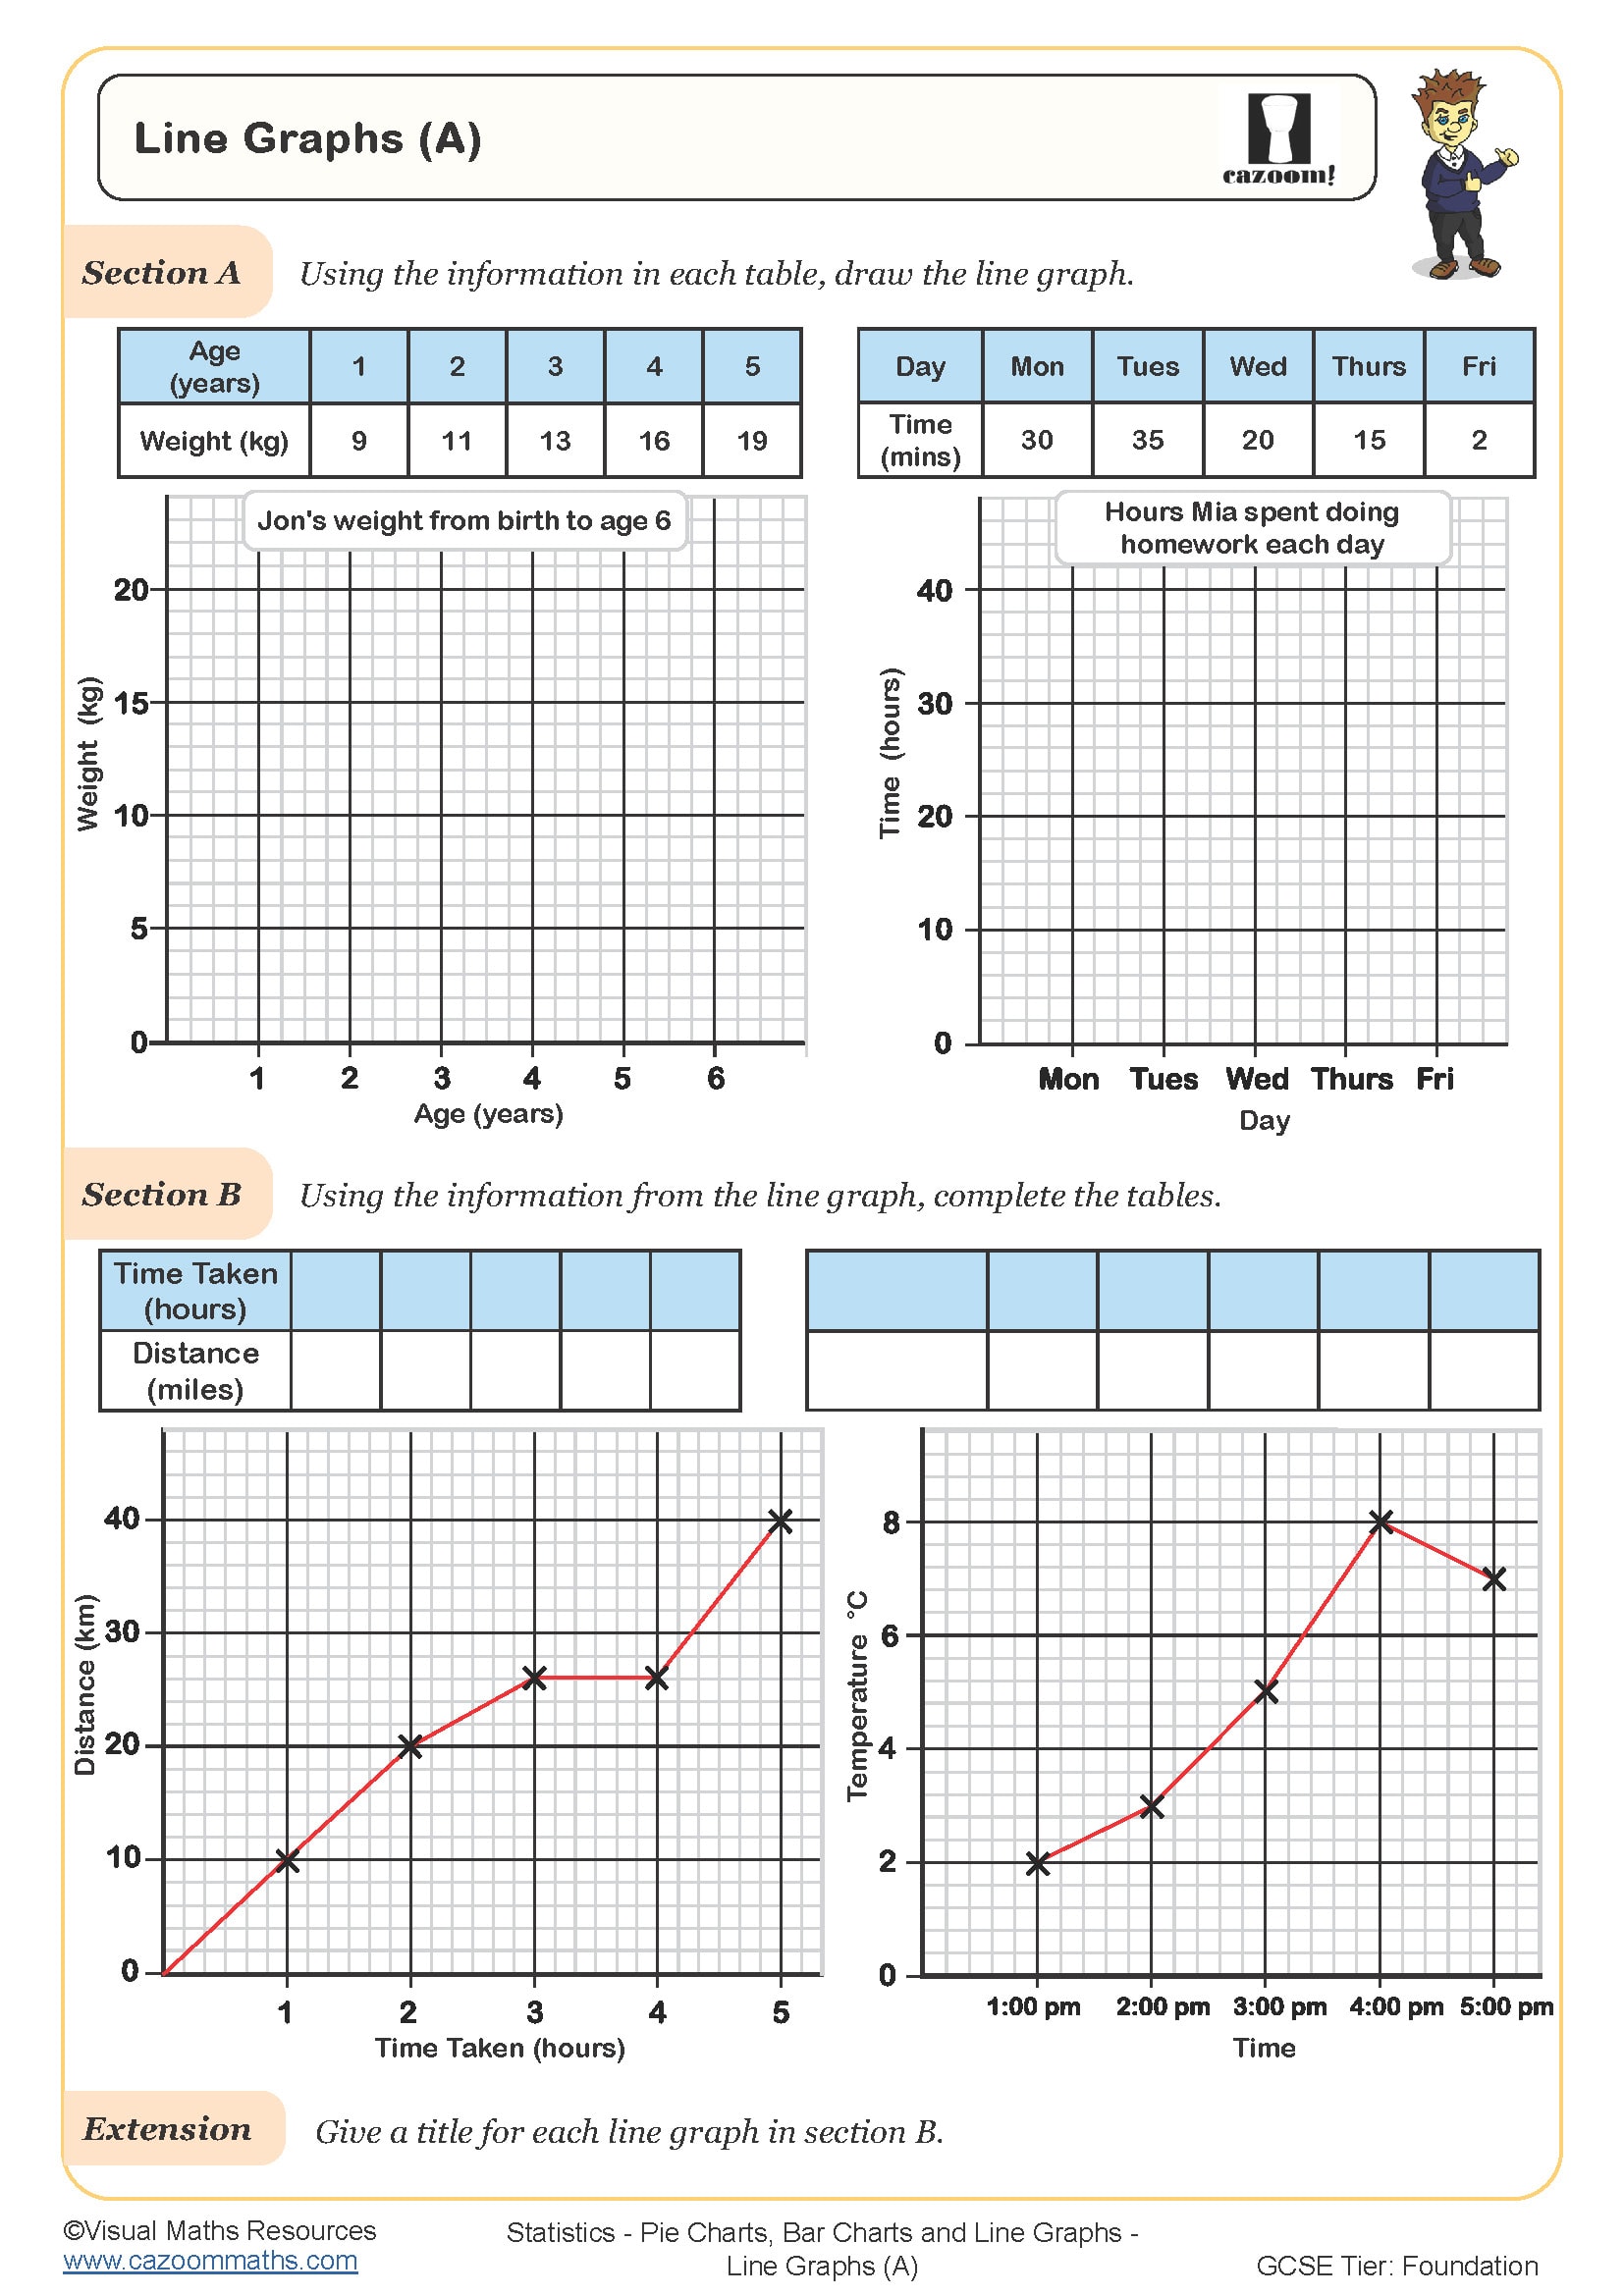
Line Graphs (A)
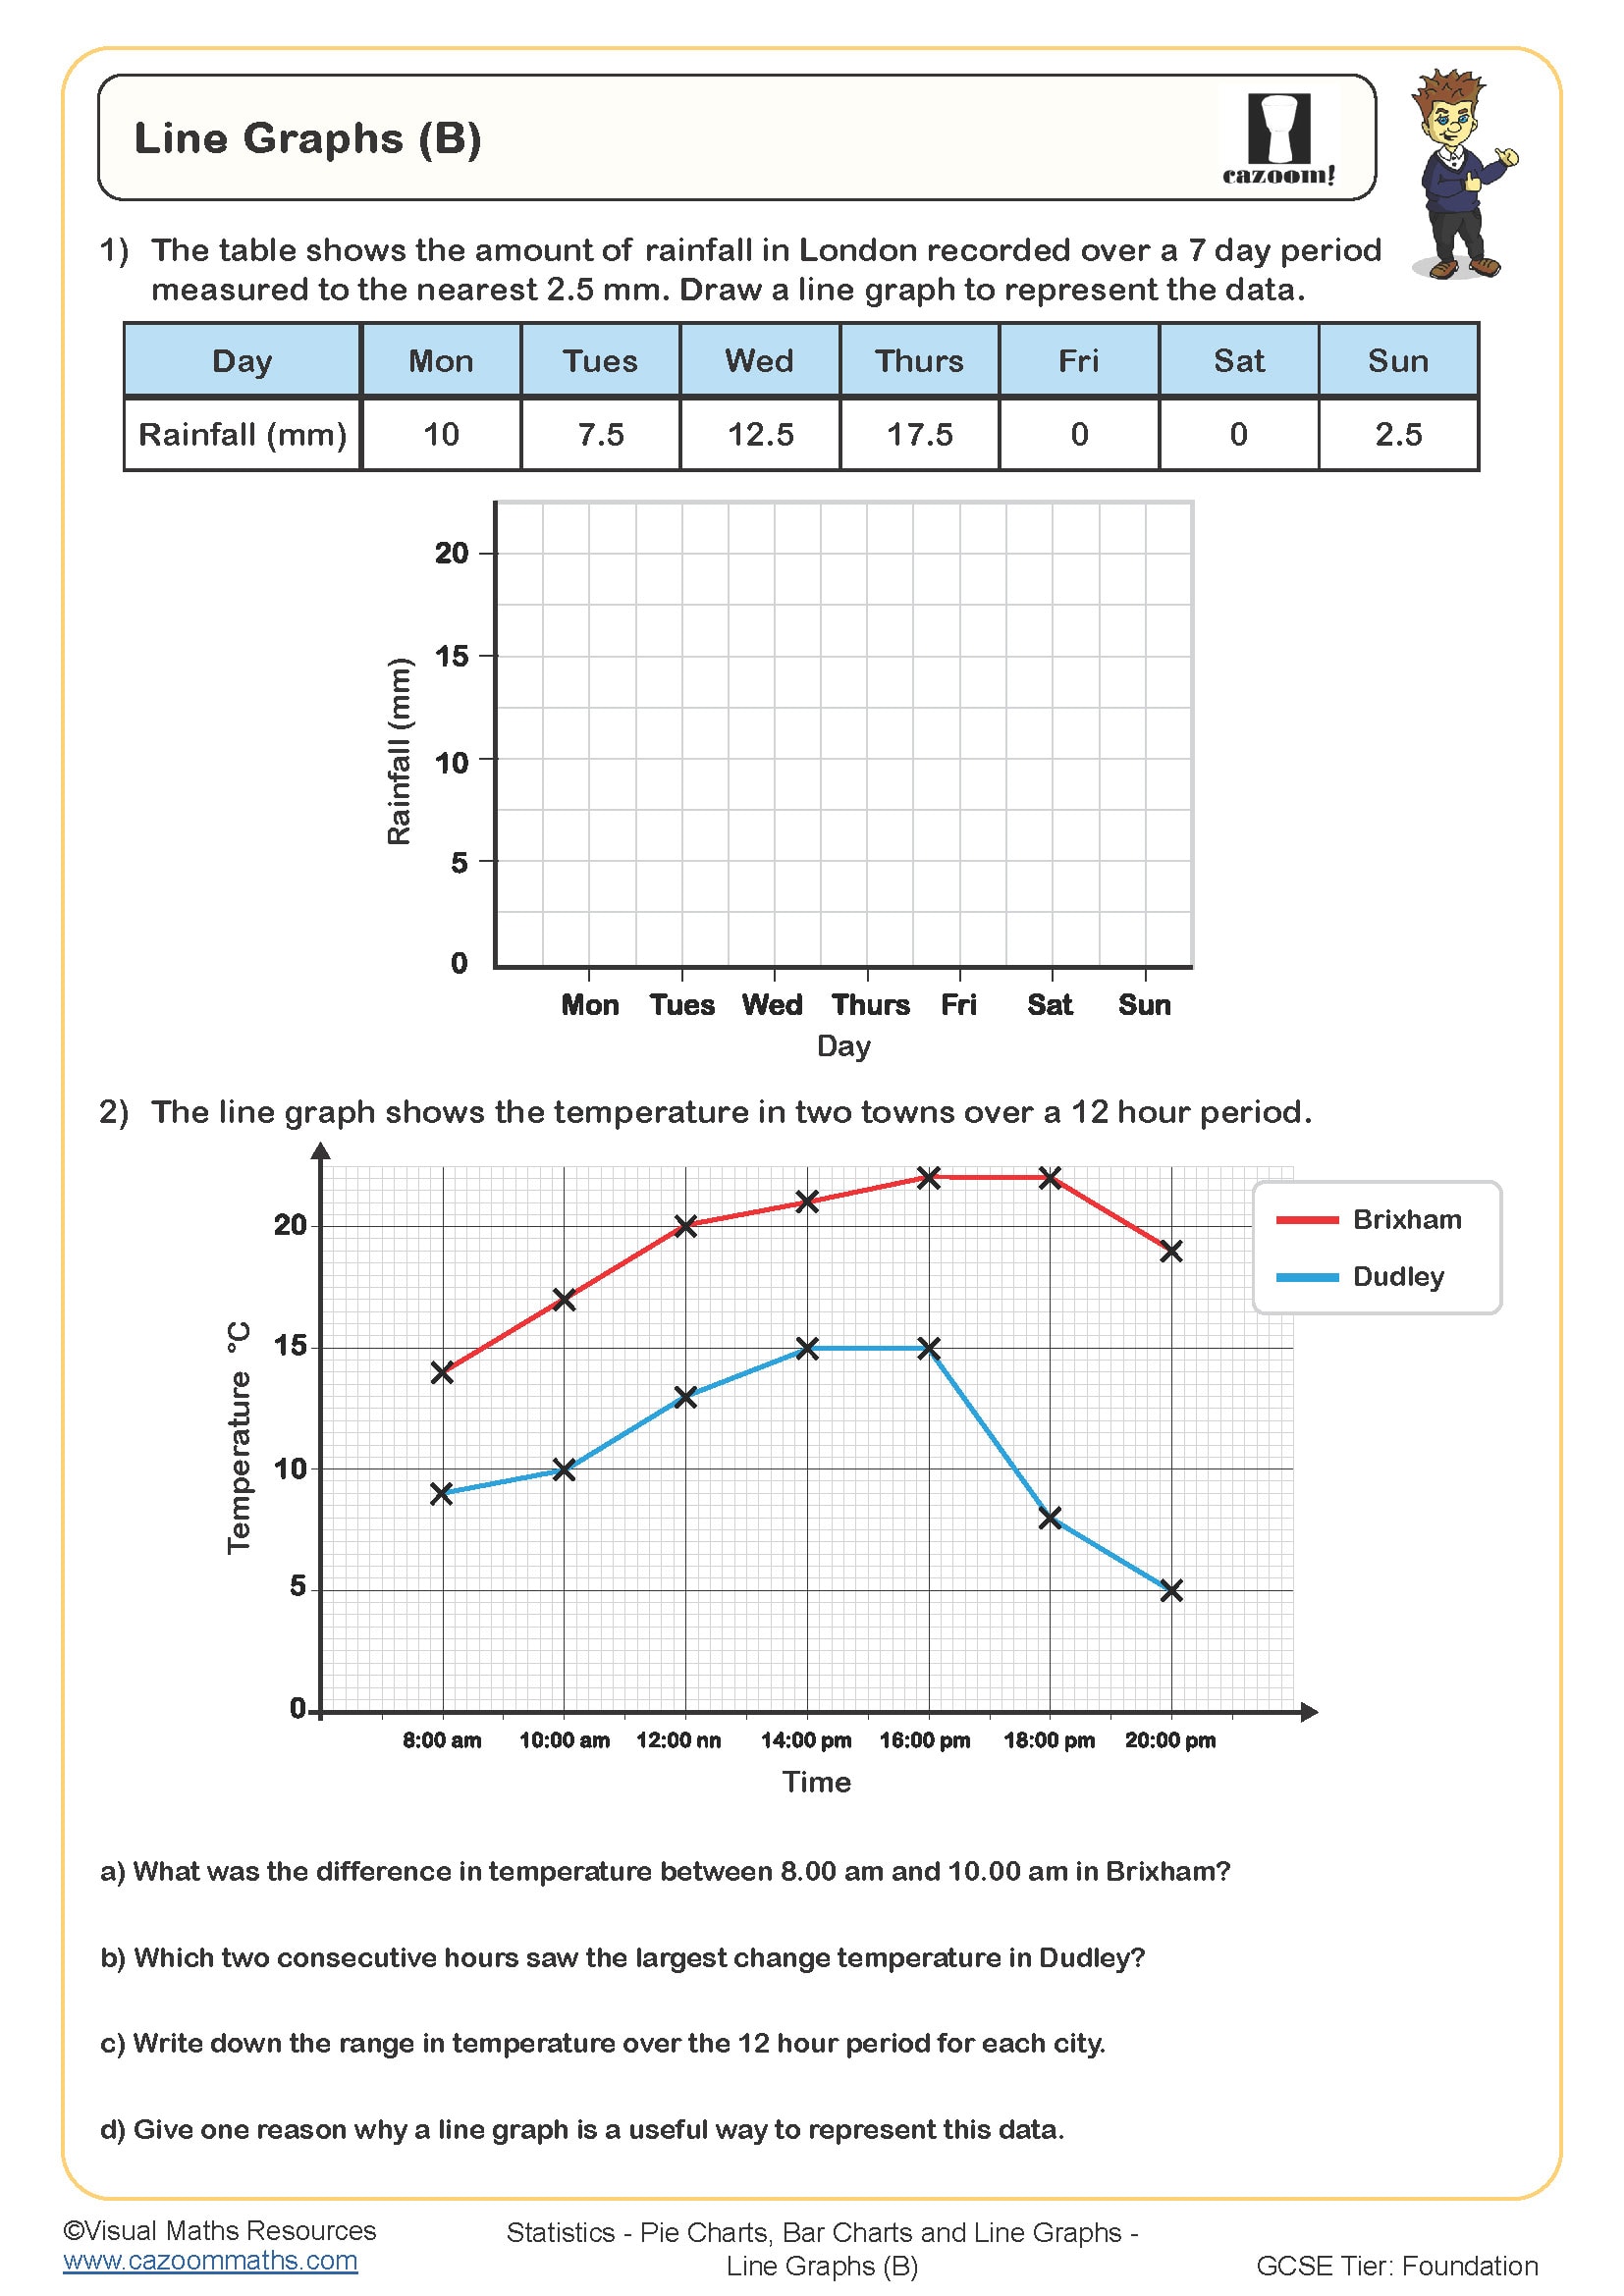
Line Graphs (B)
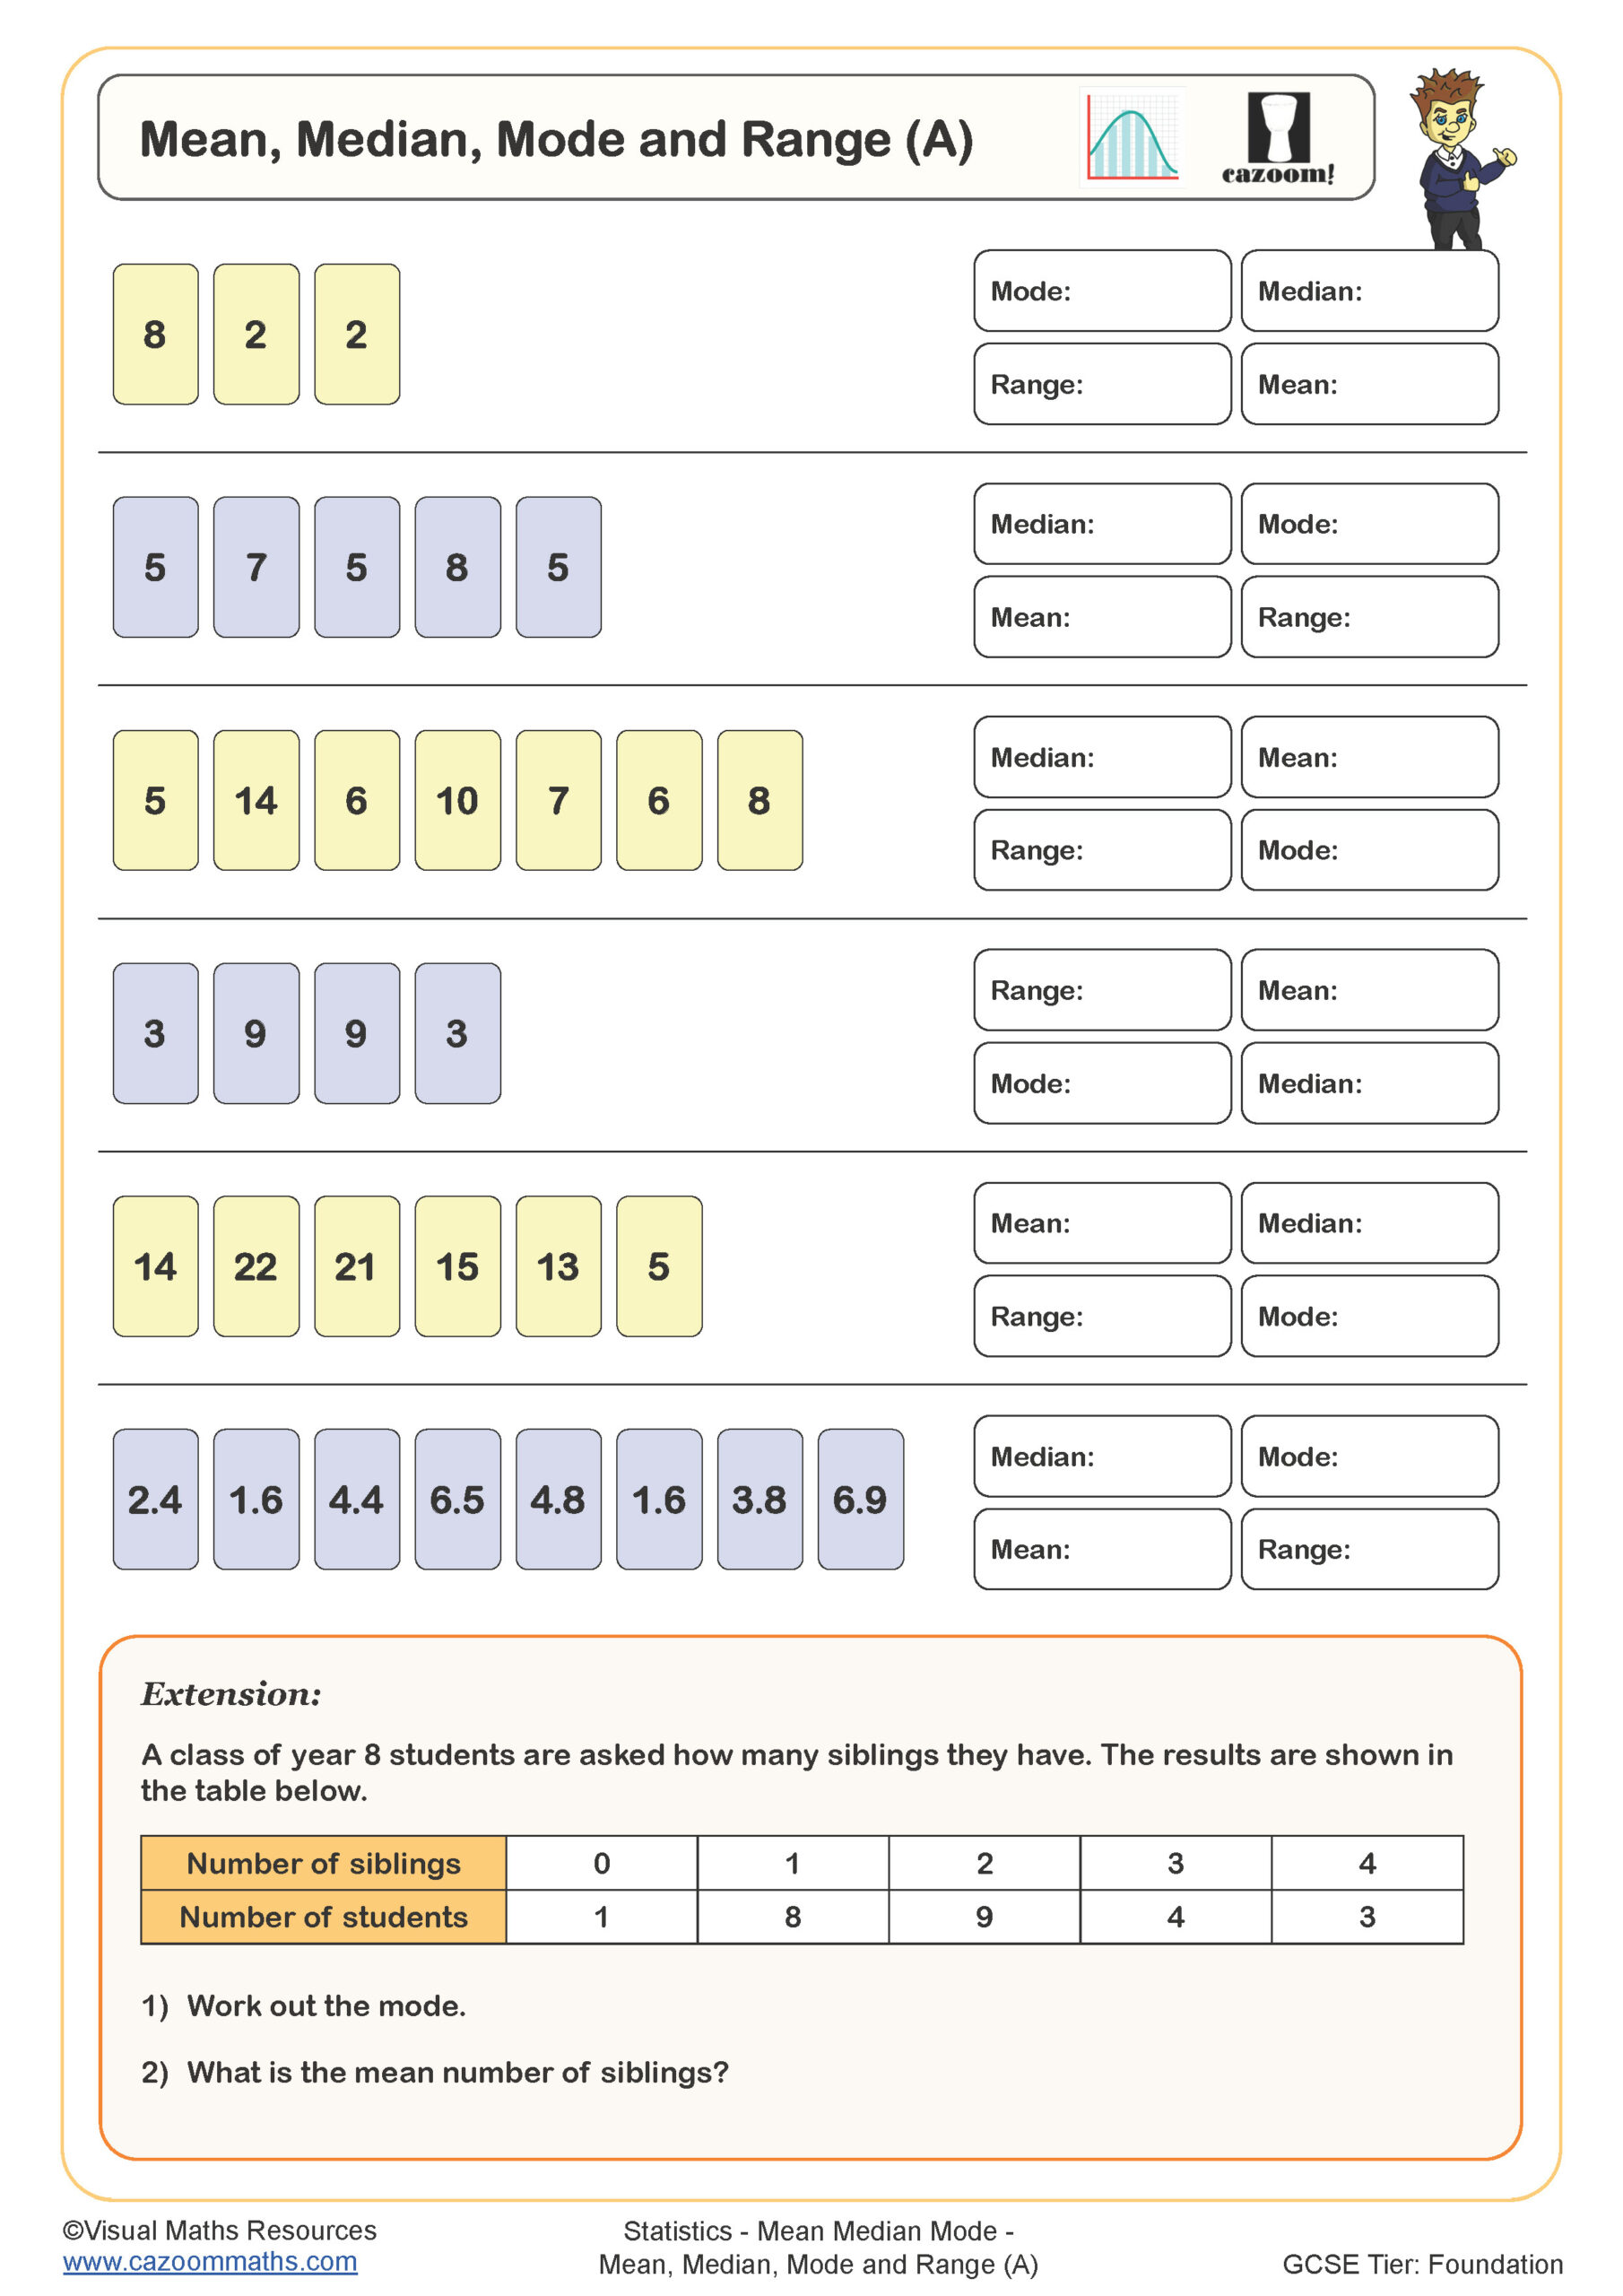
Mean, Median, Mode and Range (A)
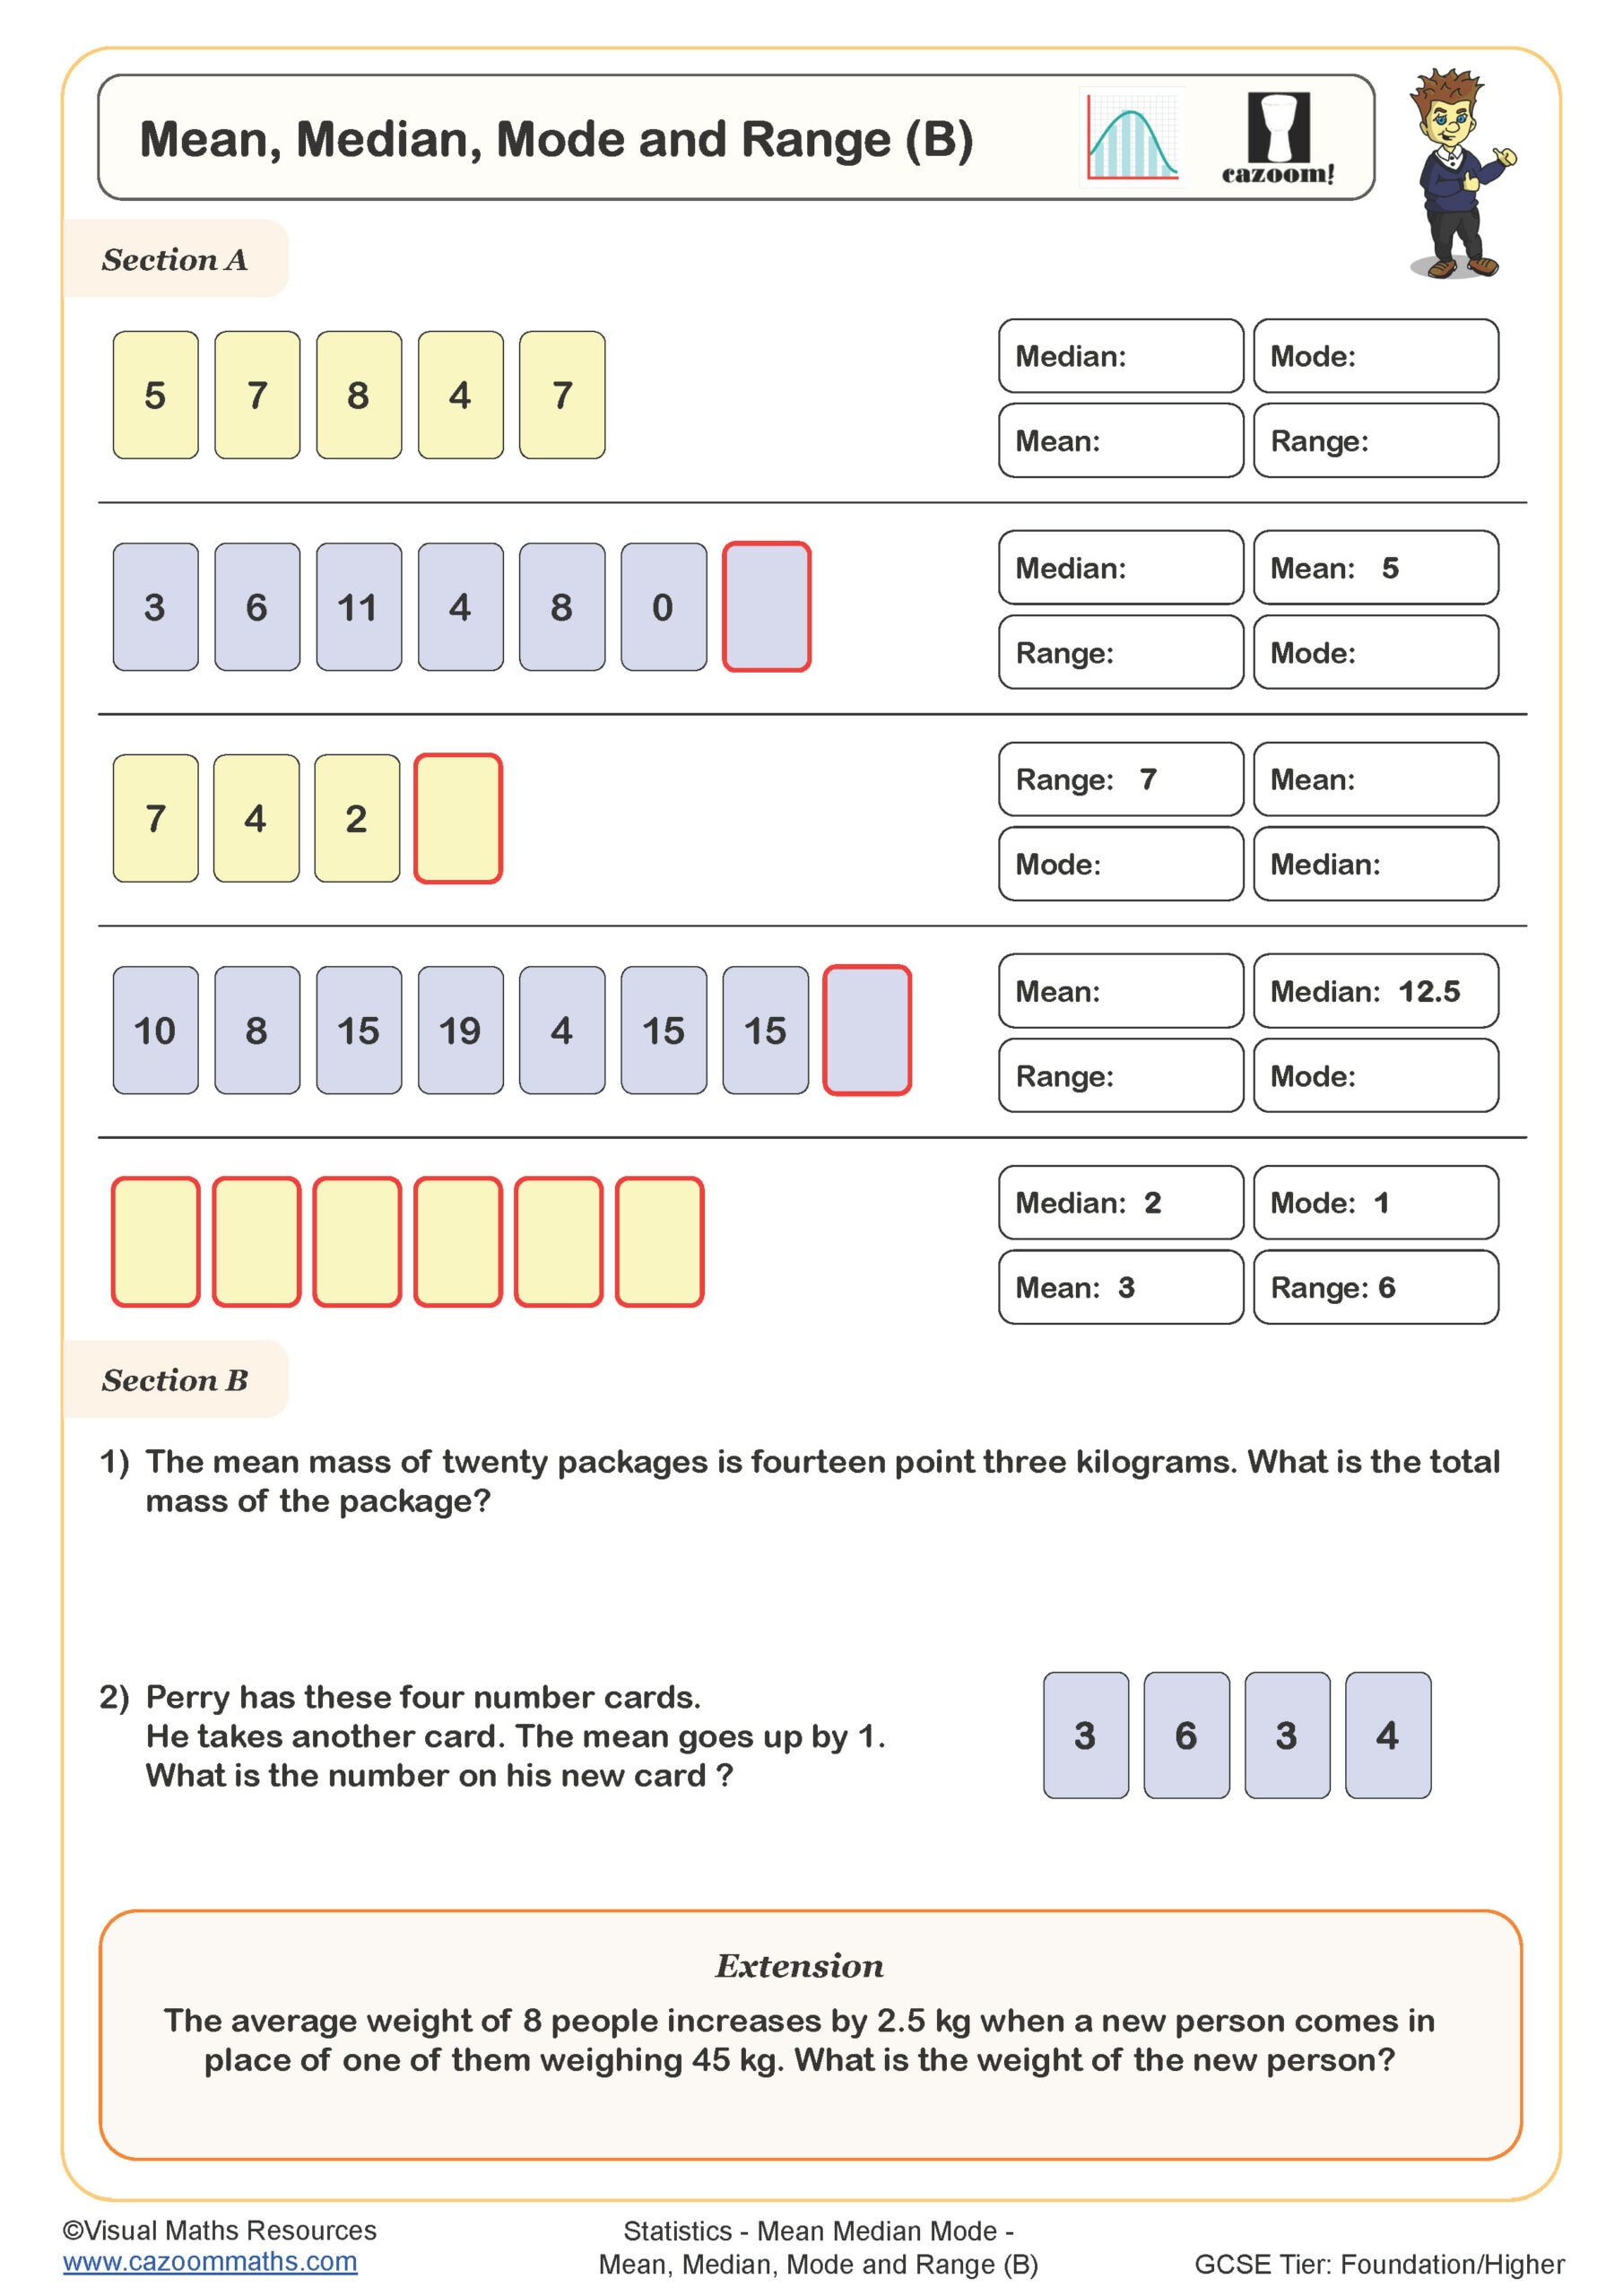
Mean, Median, Mode and Range (B)
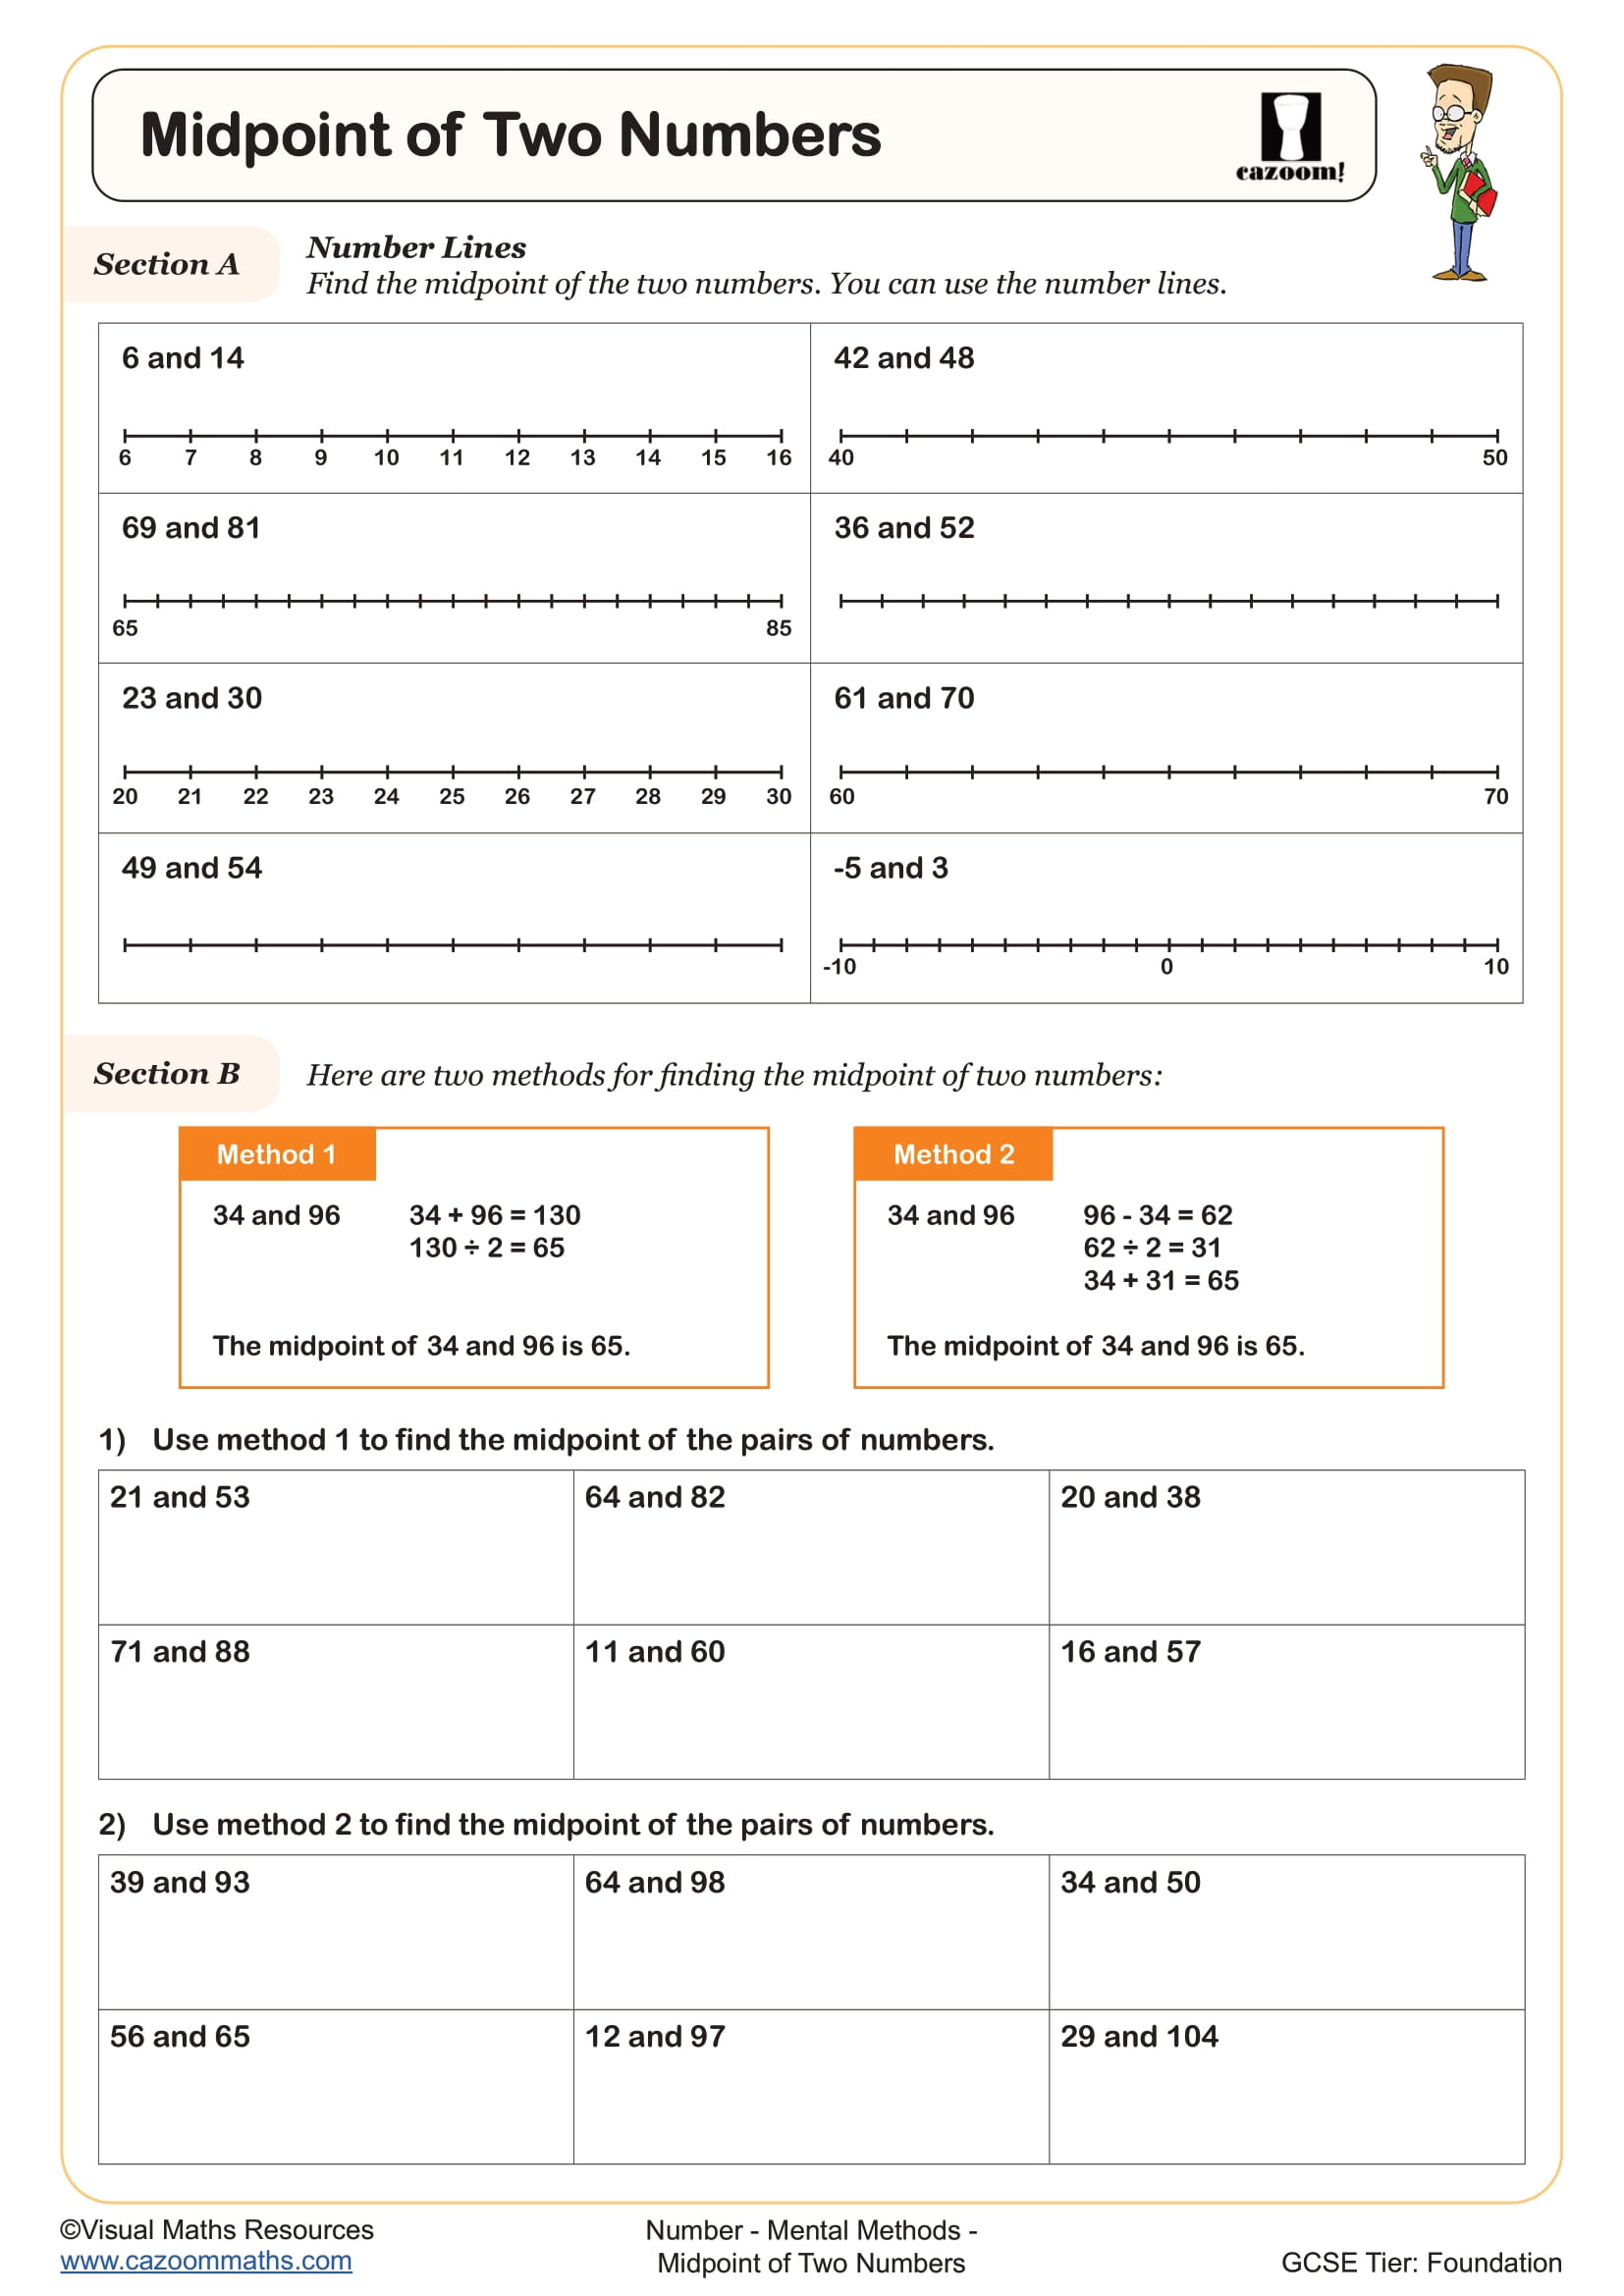
Midpoint of Two Numbers
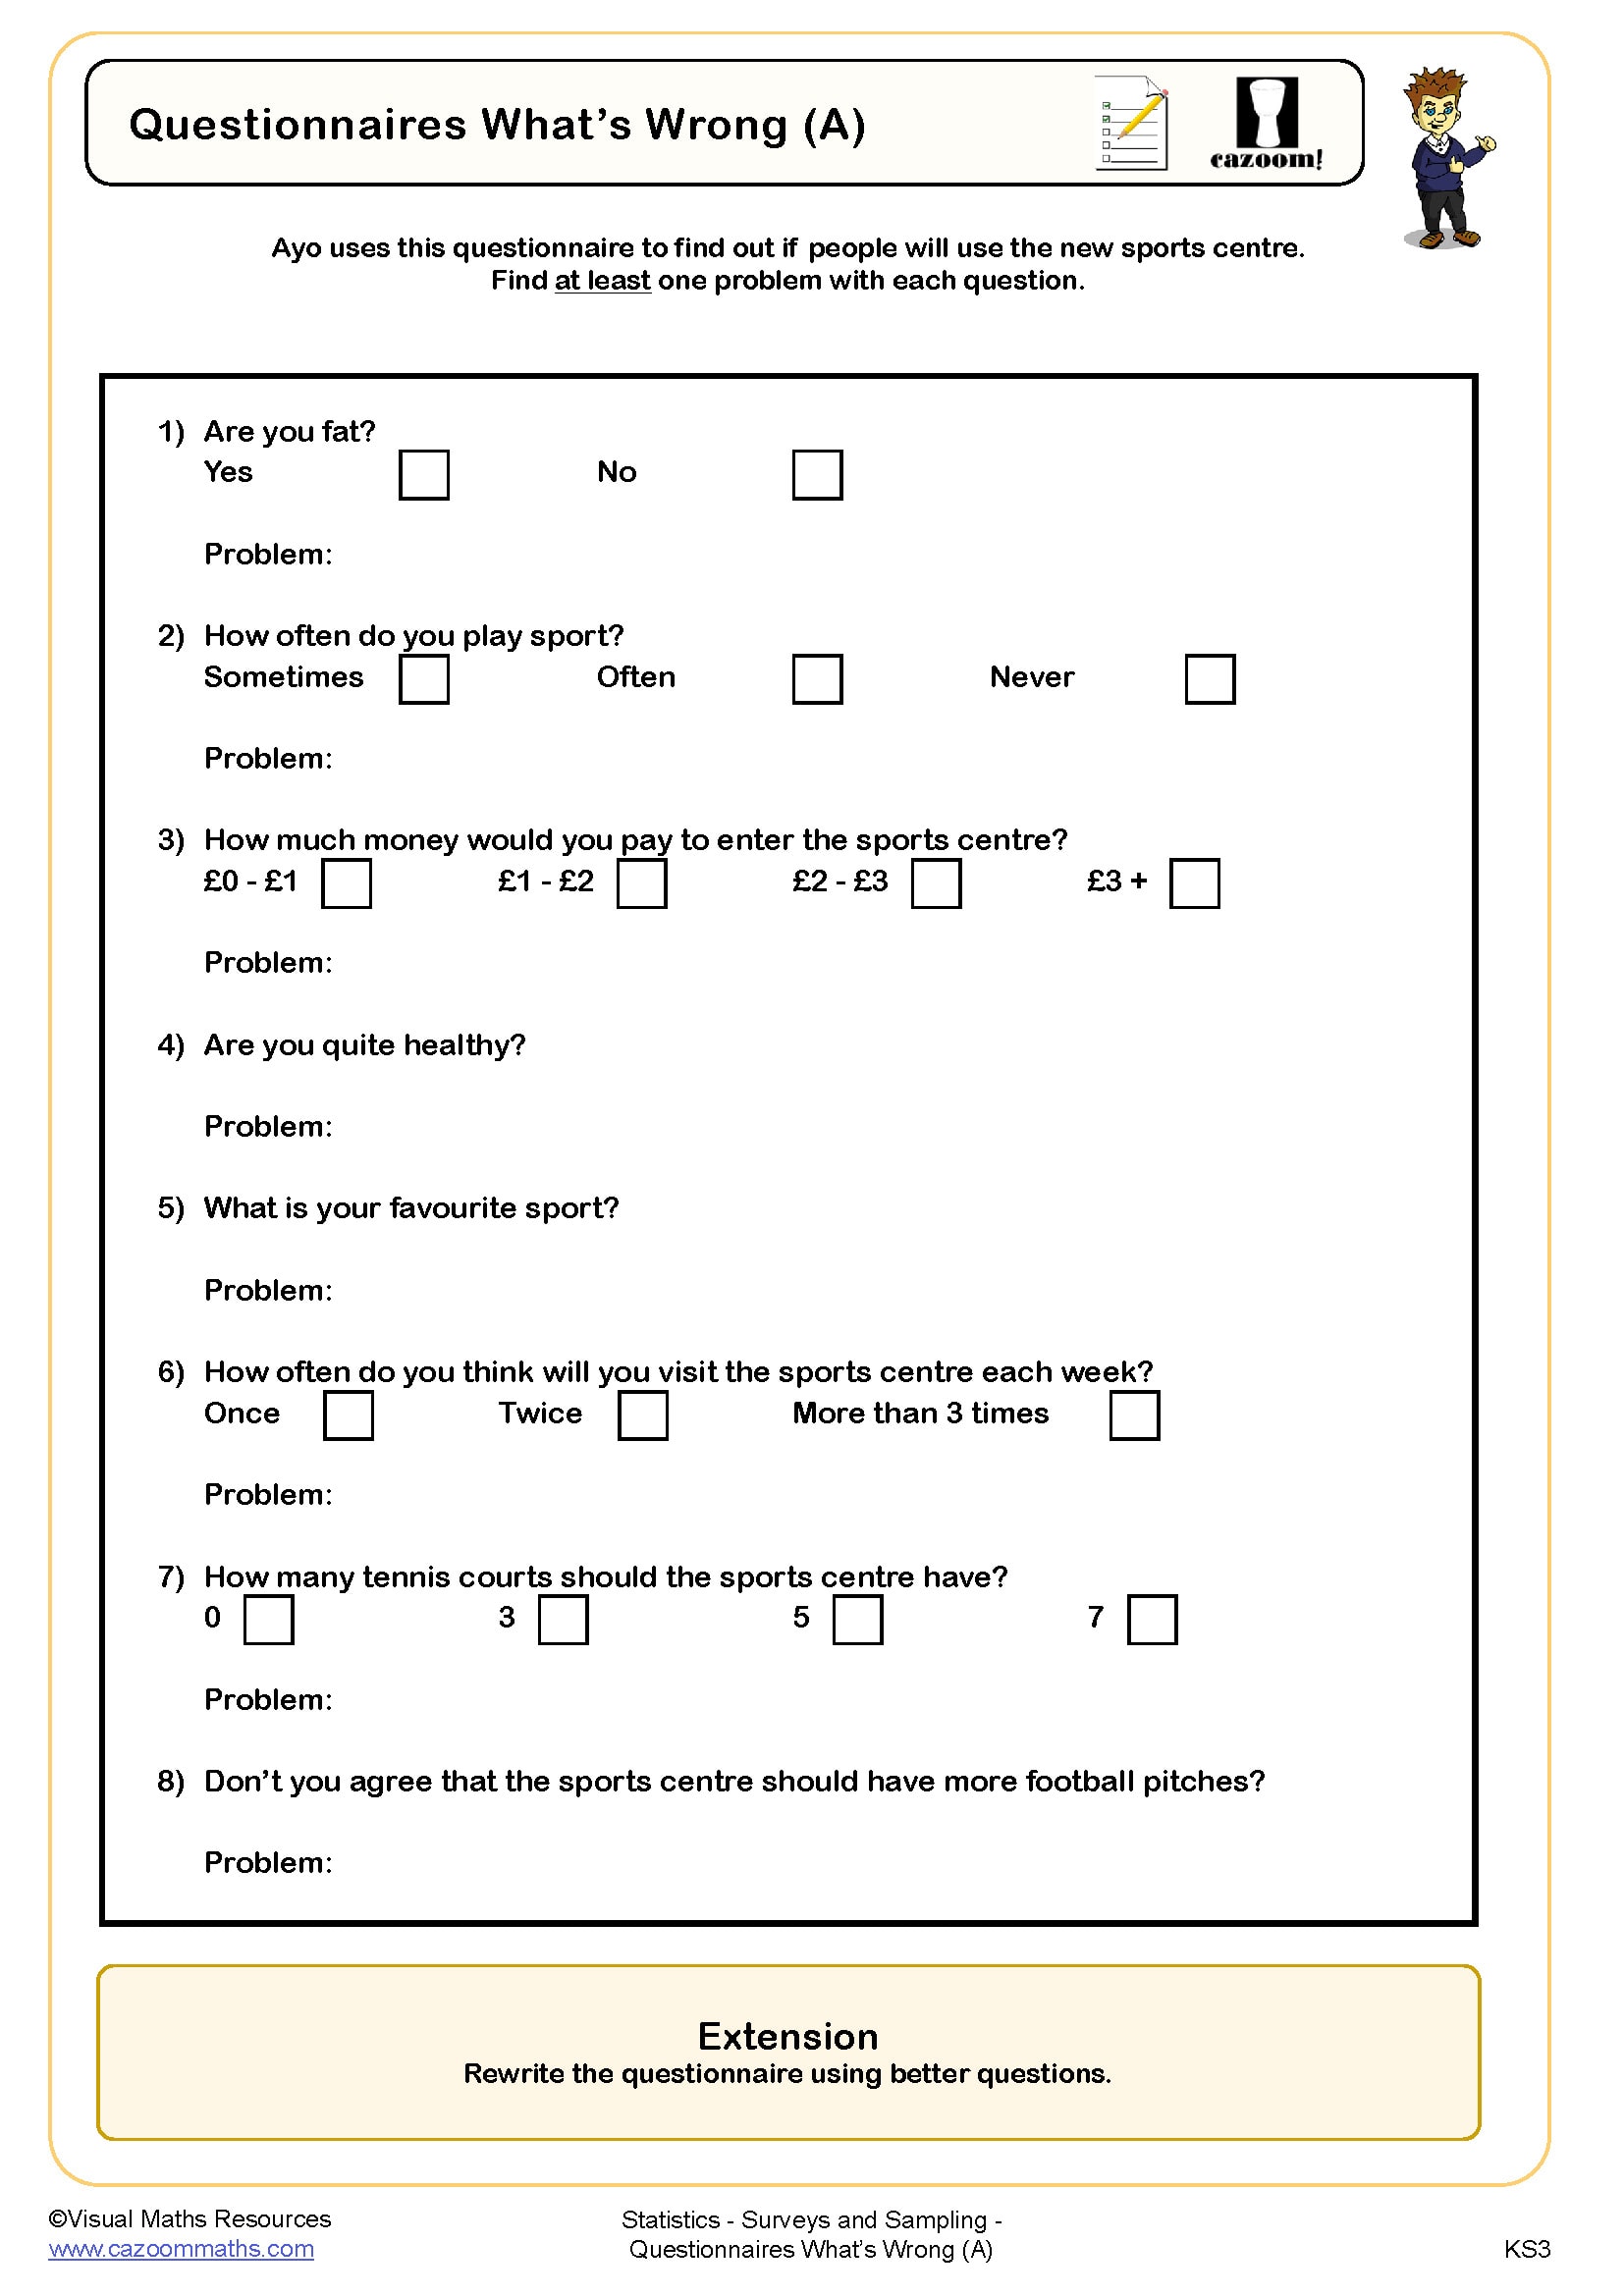
Questionnaires What's Wrong (A)
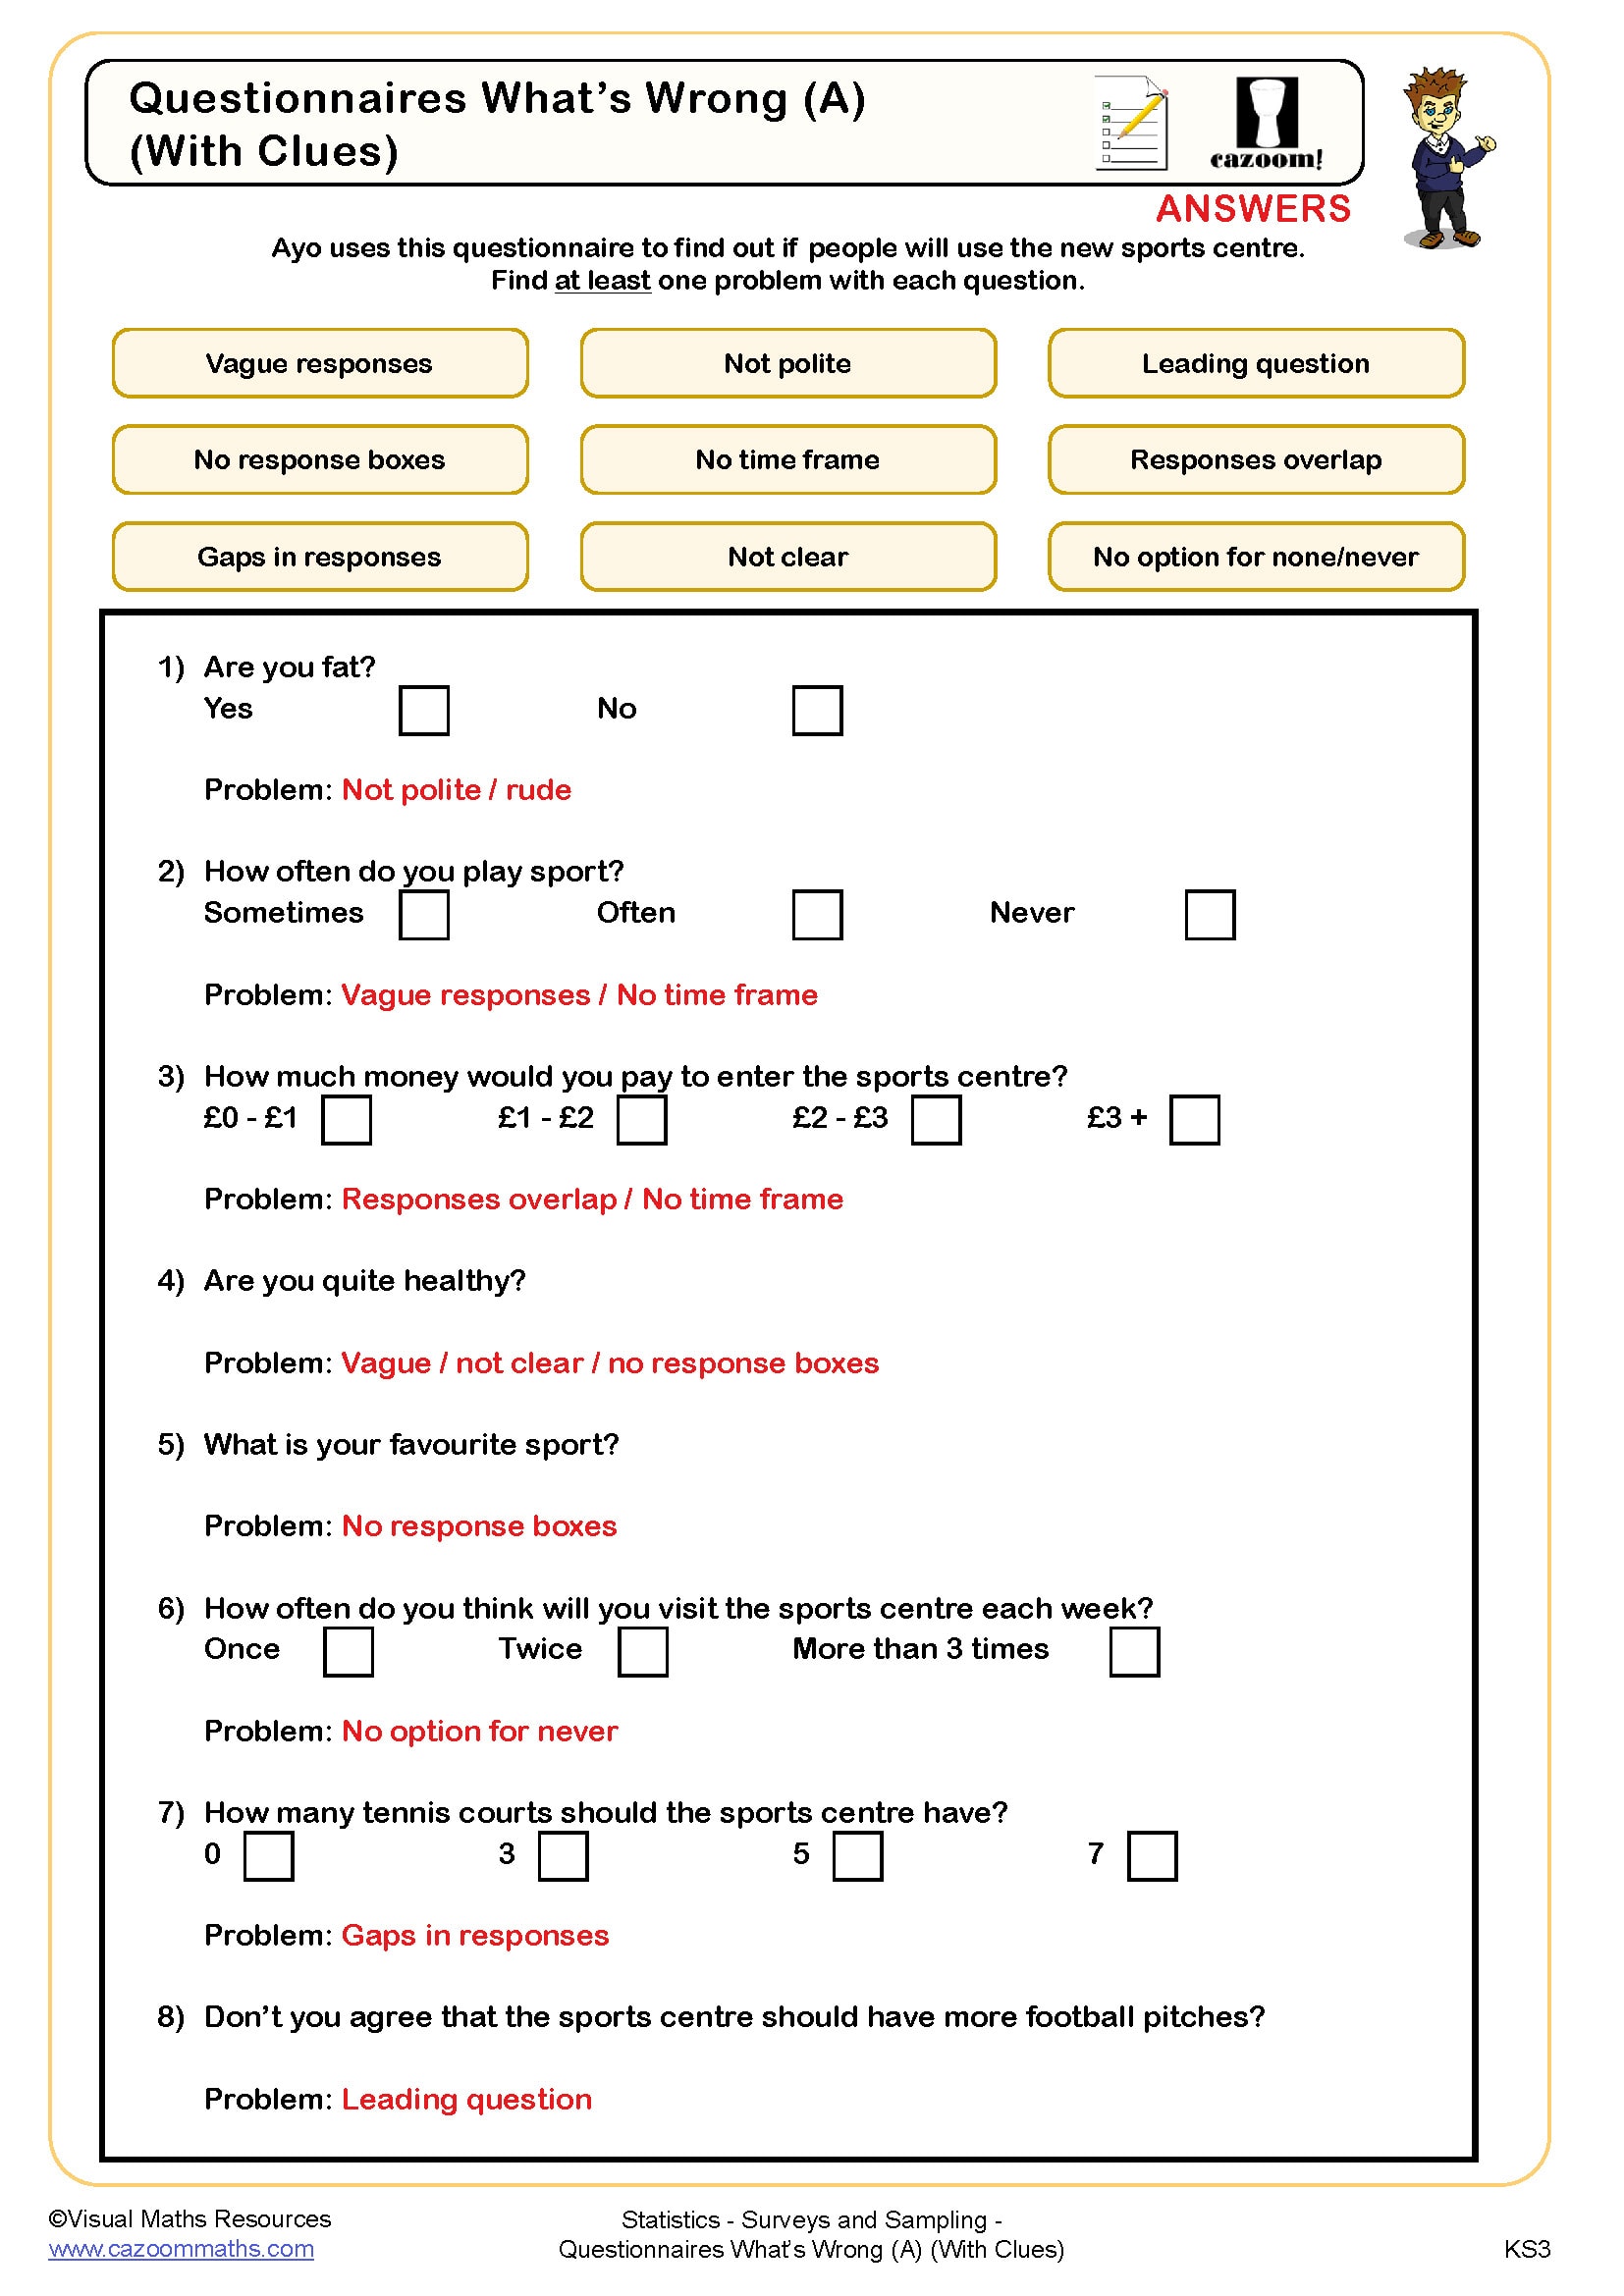
Questionnaires What's Wrong (A) (With Clues)
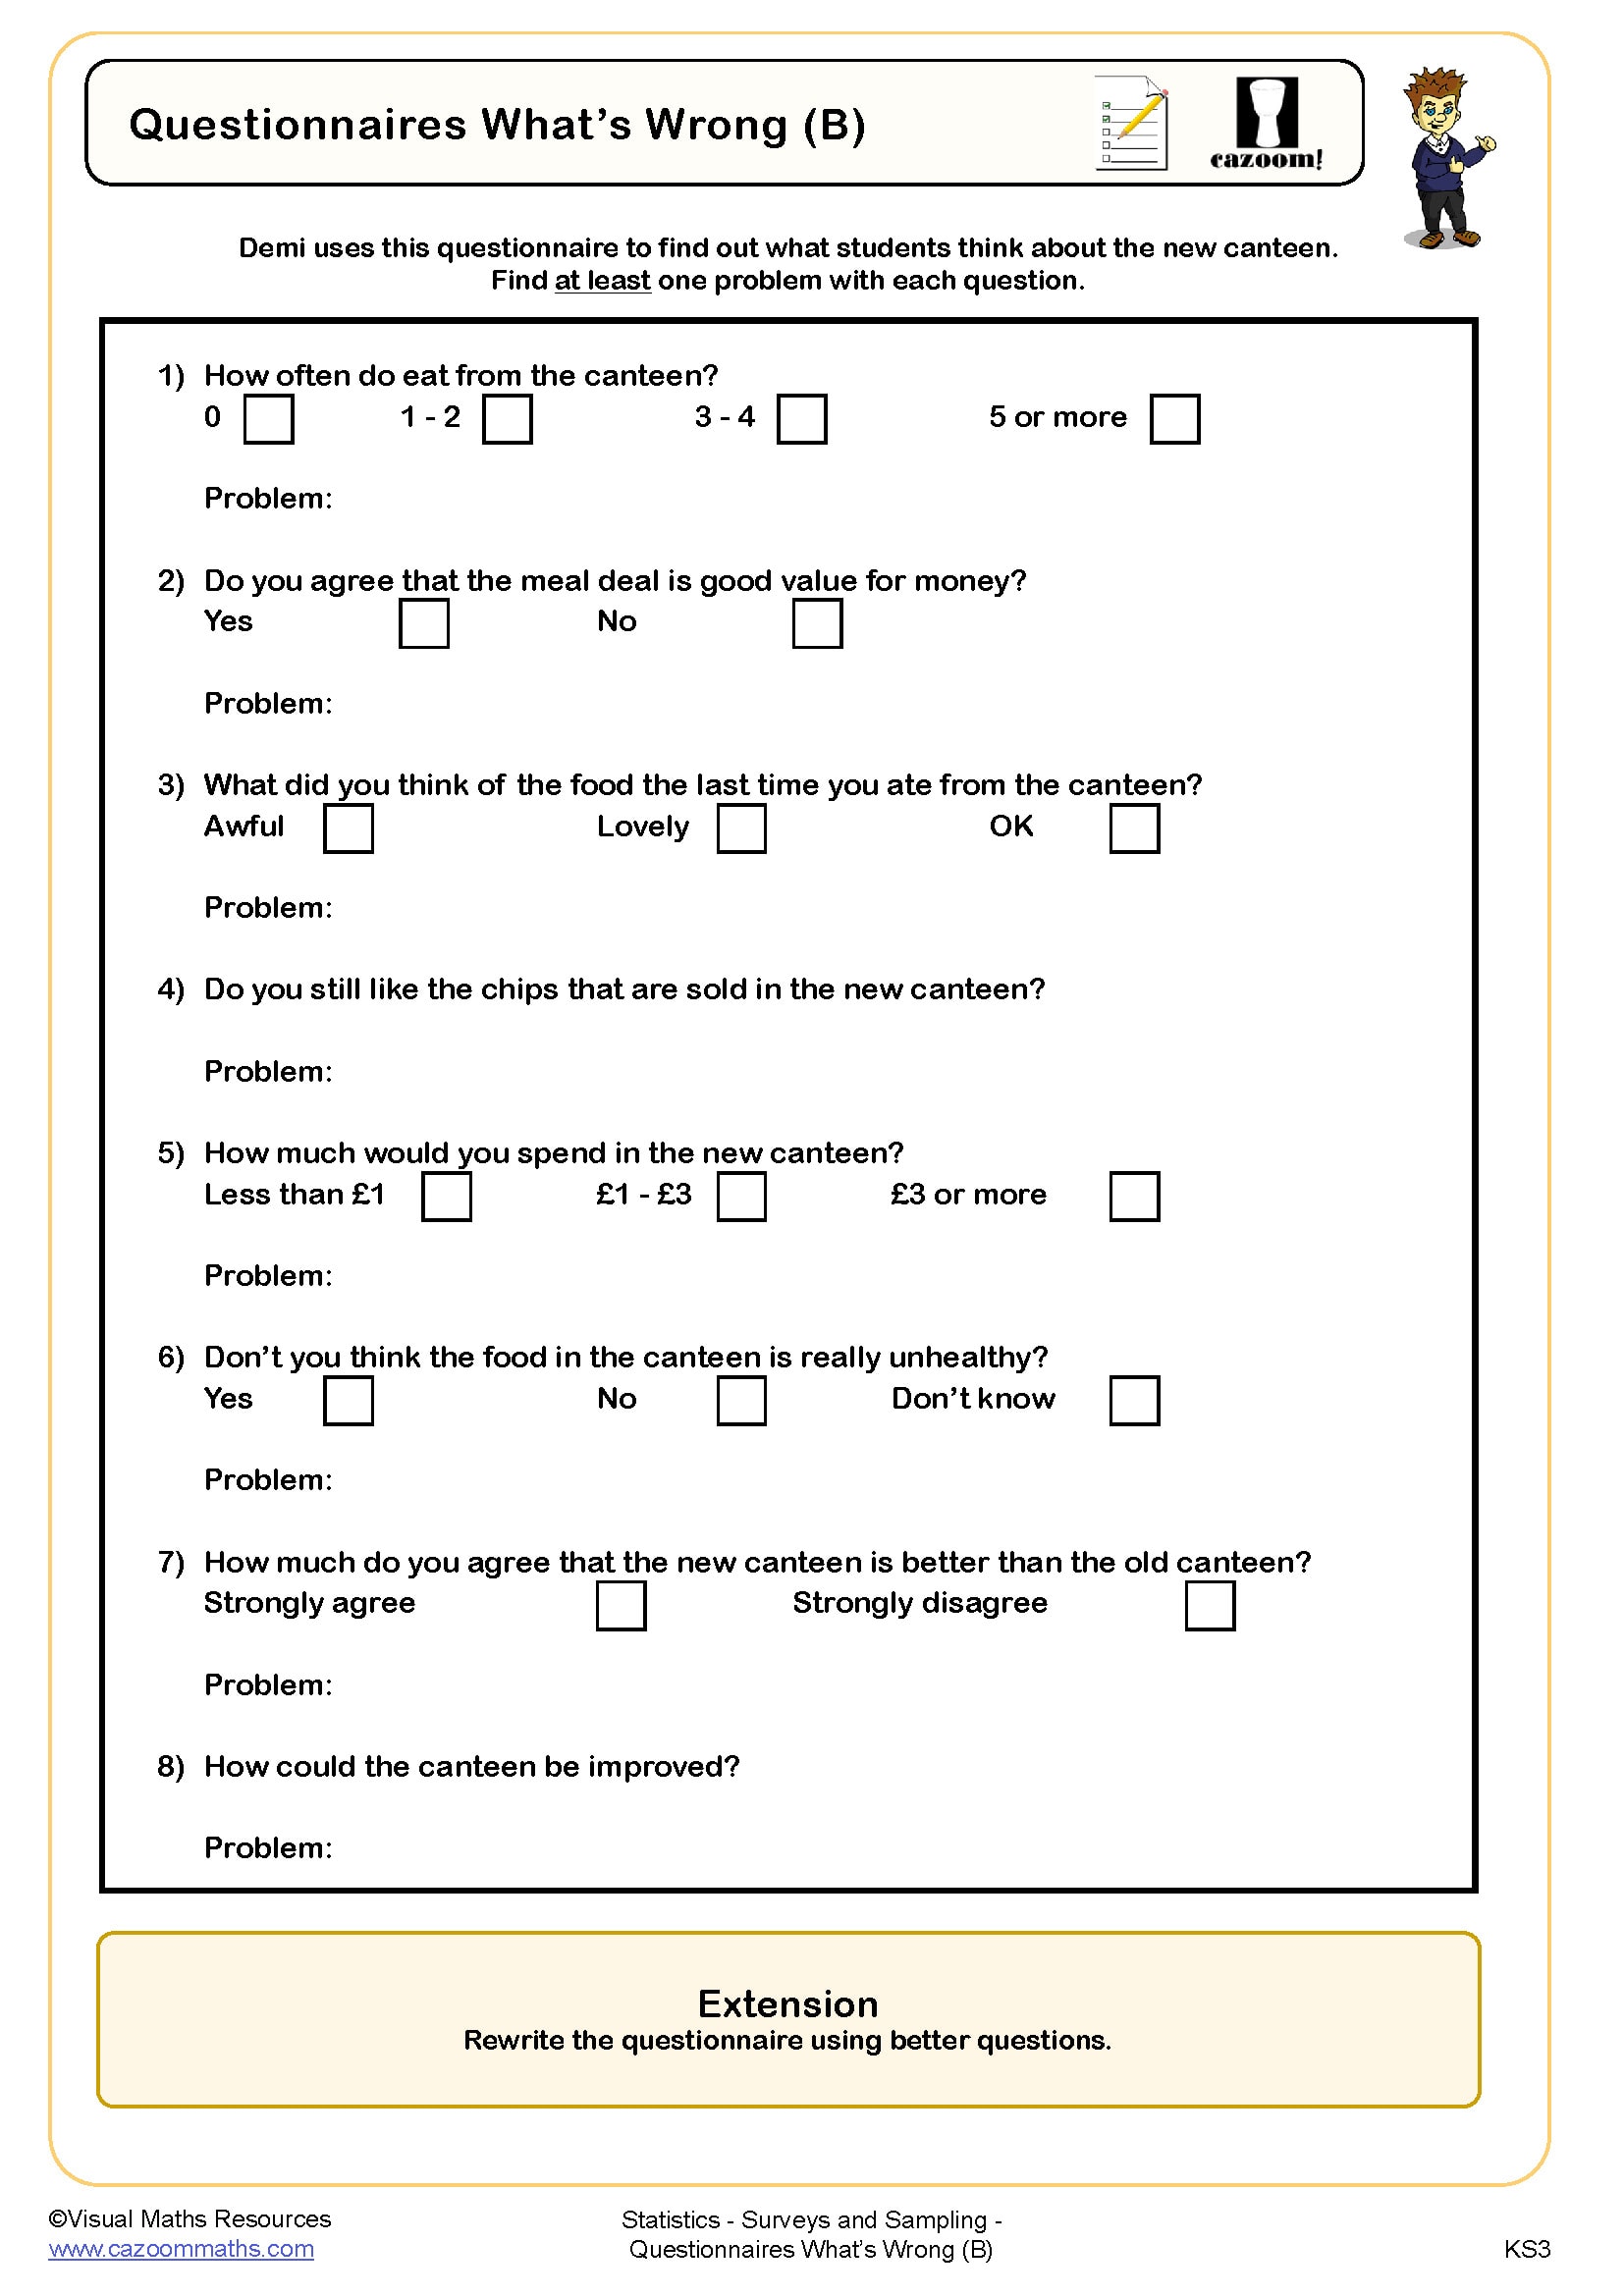
Questionnaires What's Wrong (B)
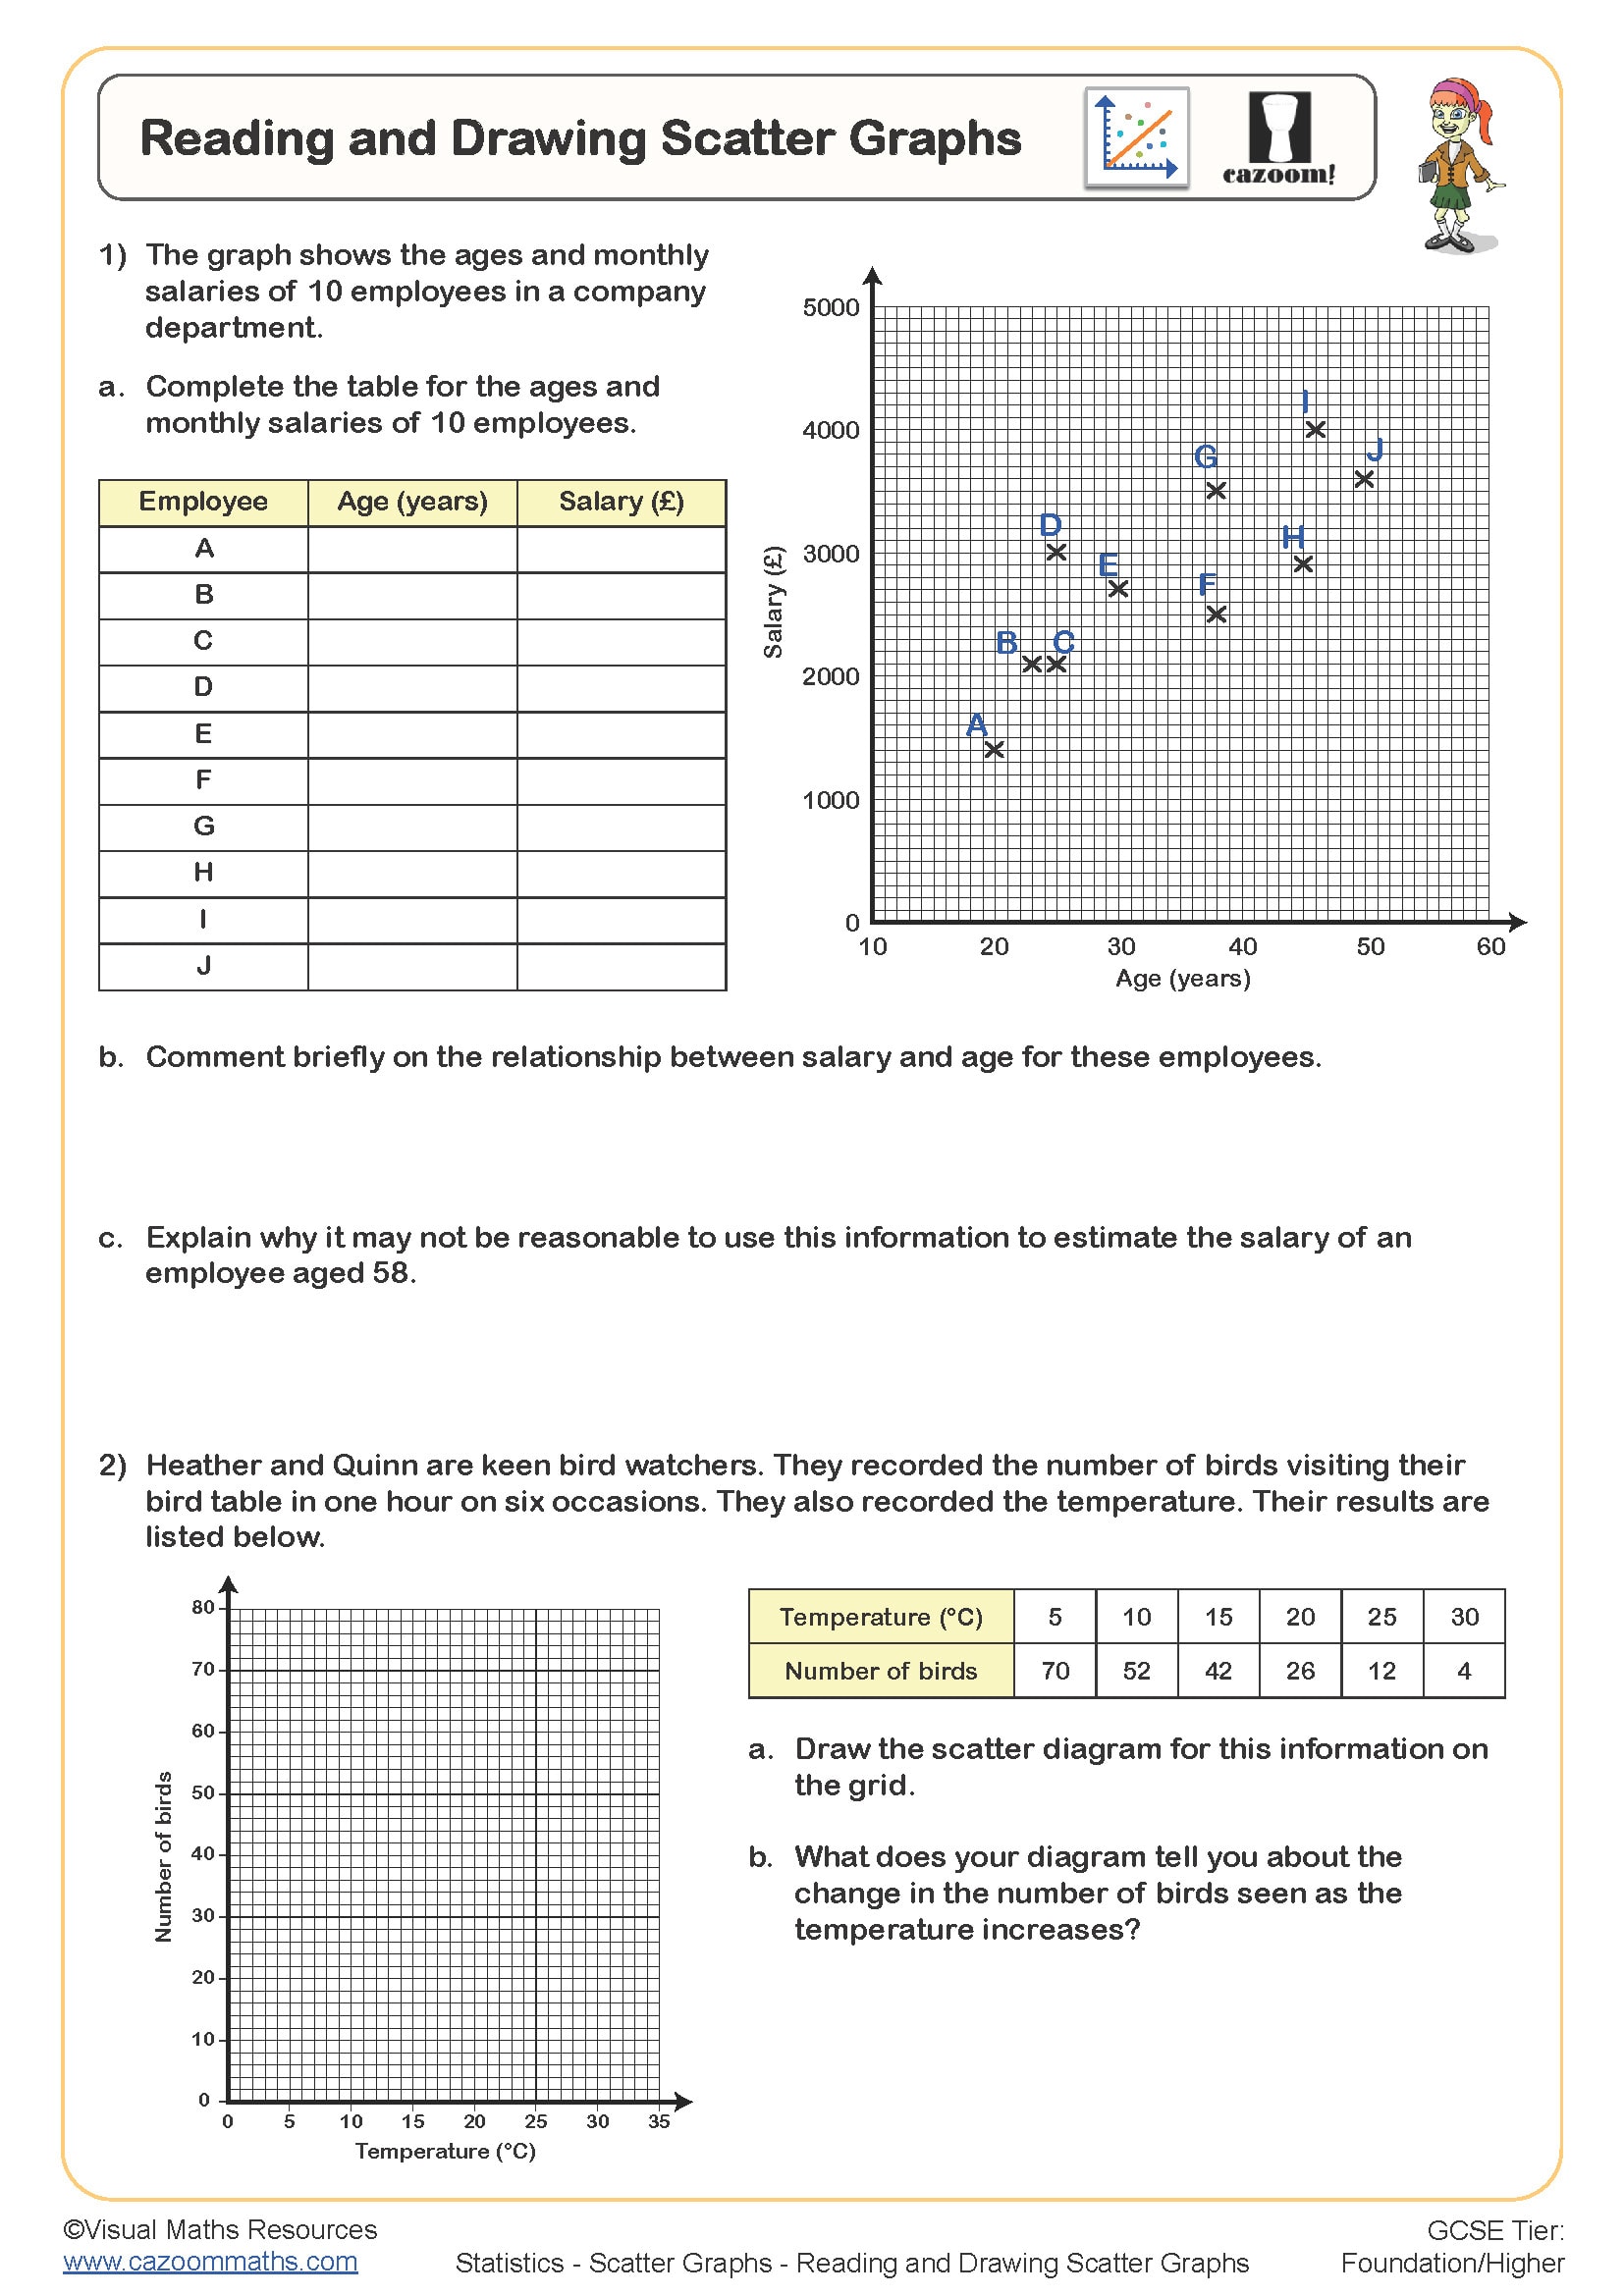
Reading and Drawing Scatter Graphs
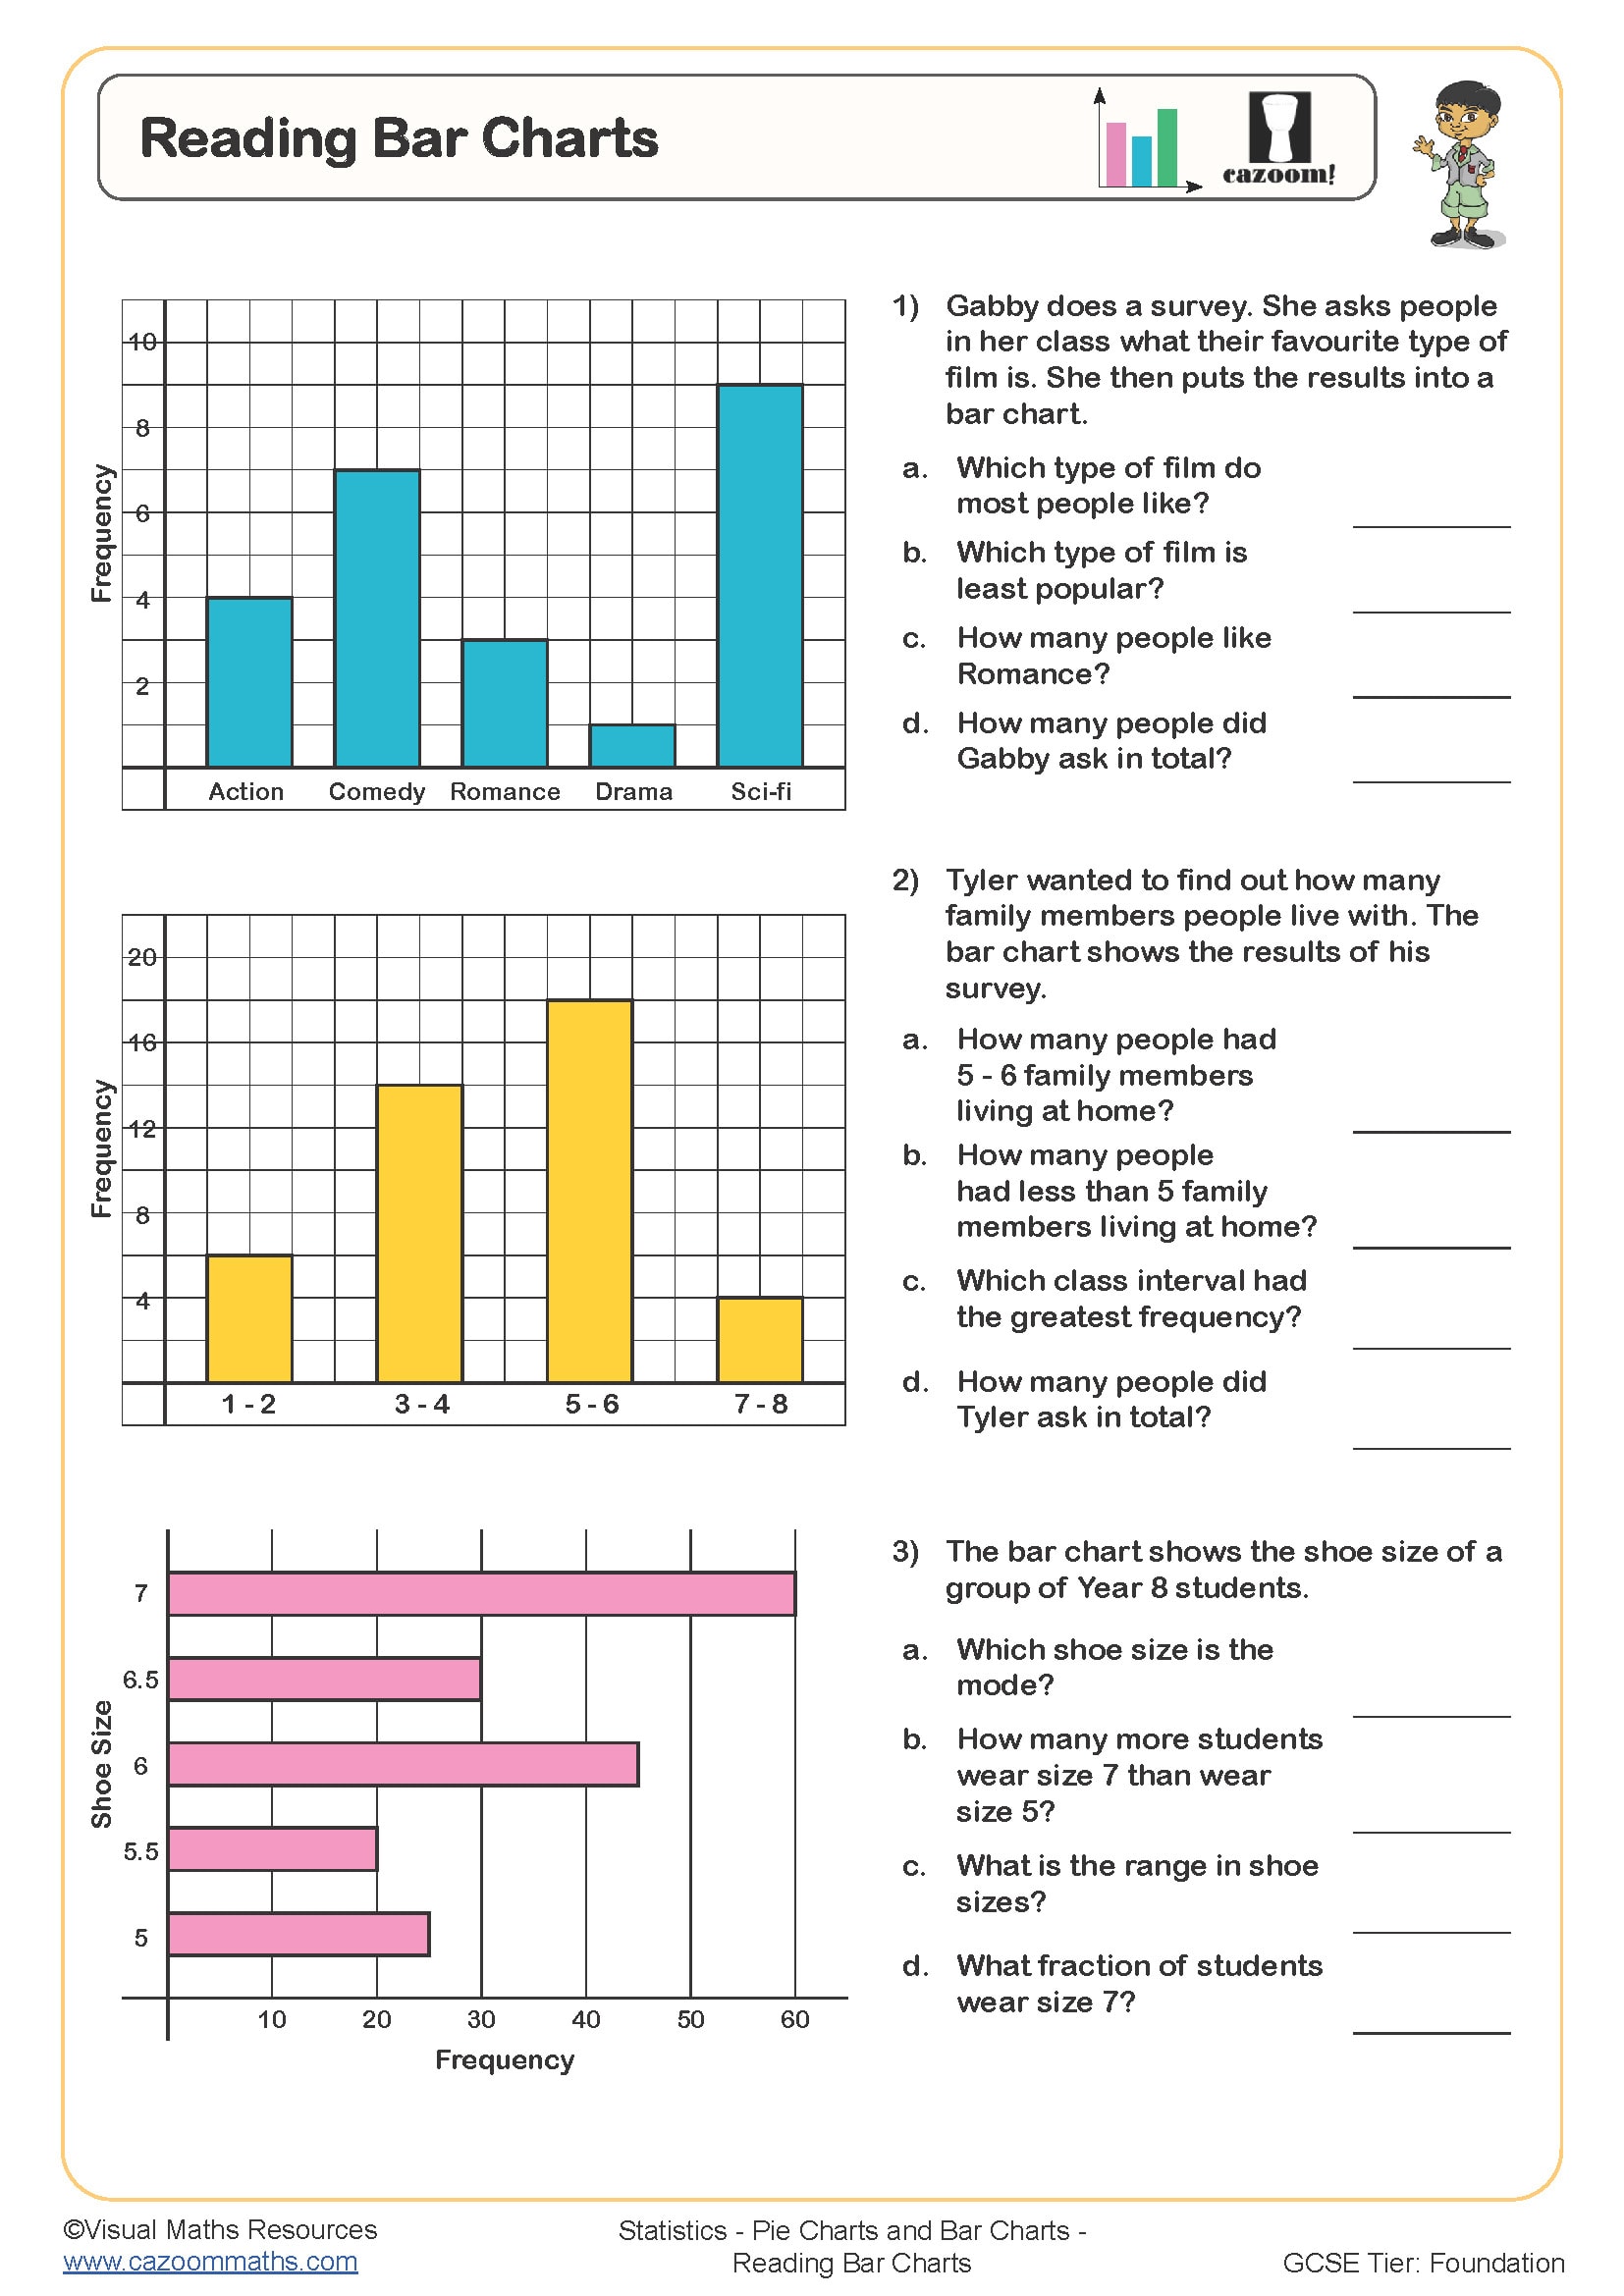
Reading Bar Charts
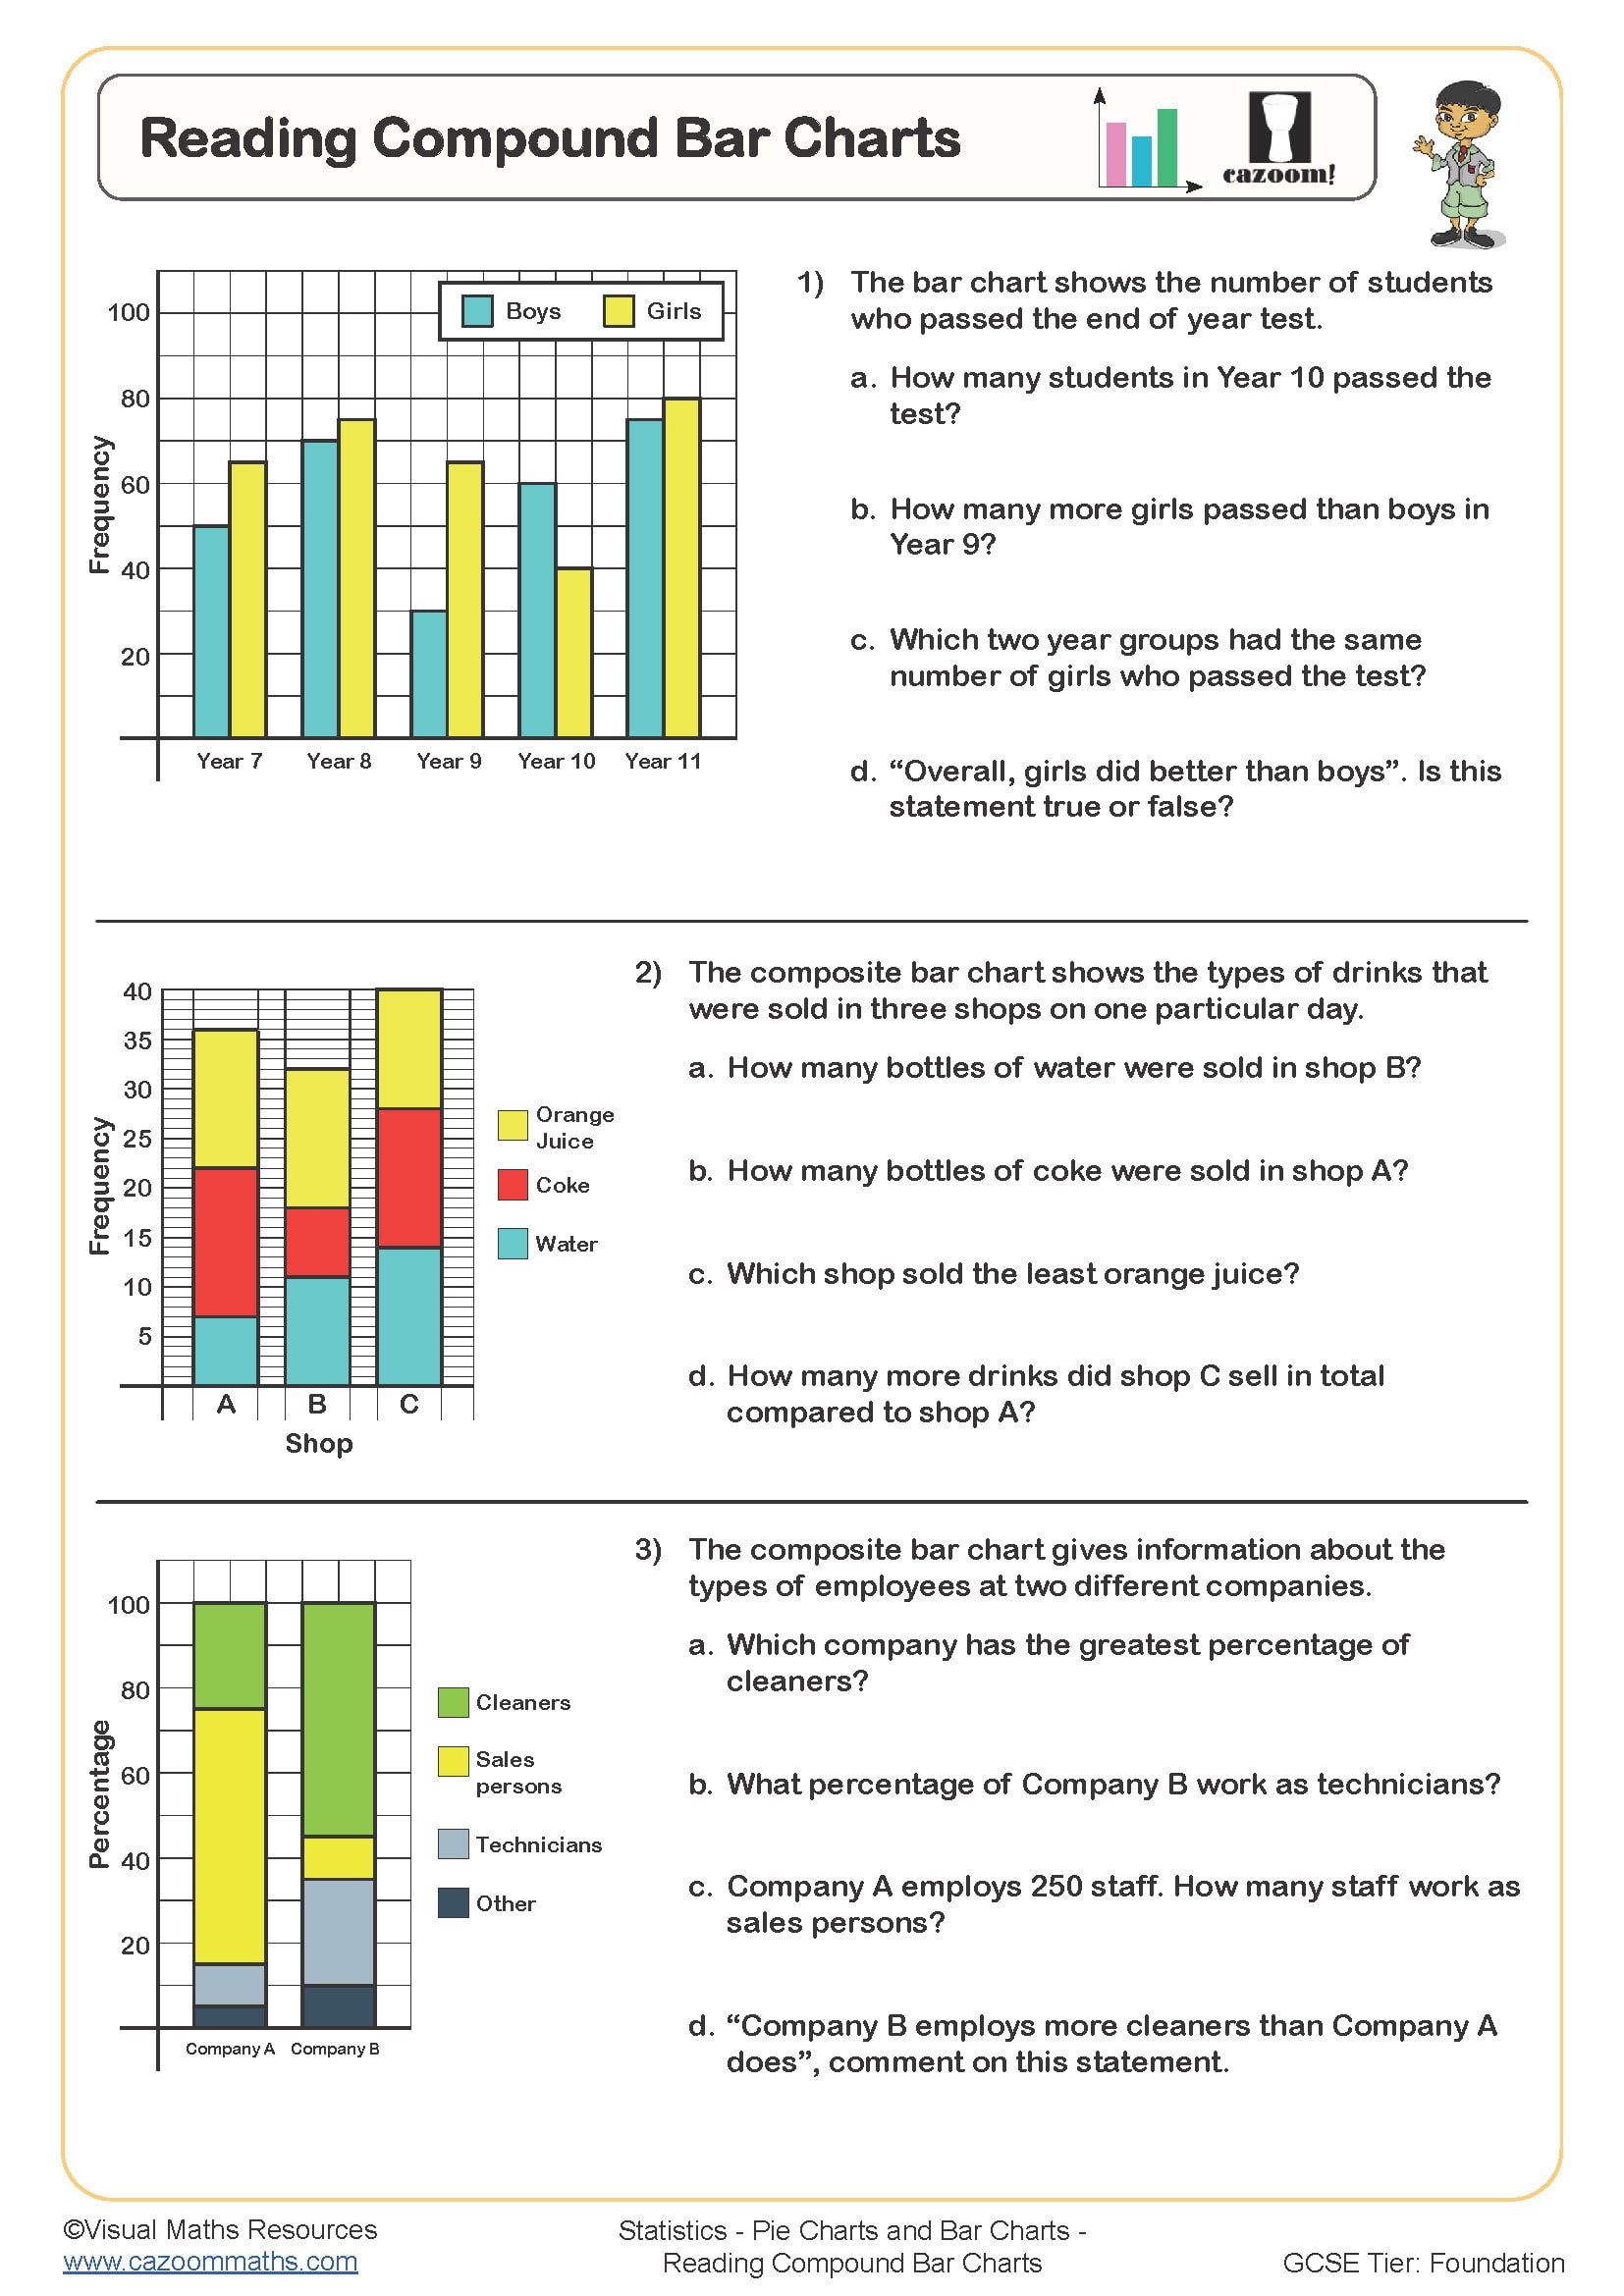
Reading Compound Bar Charts
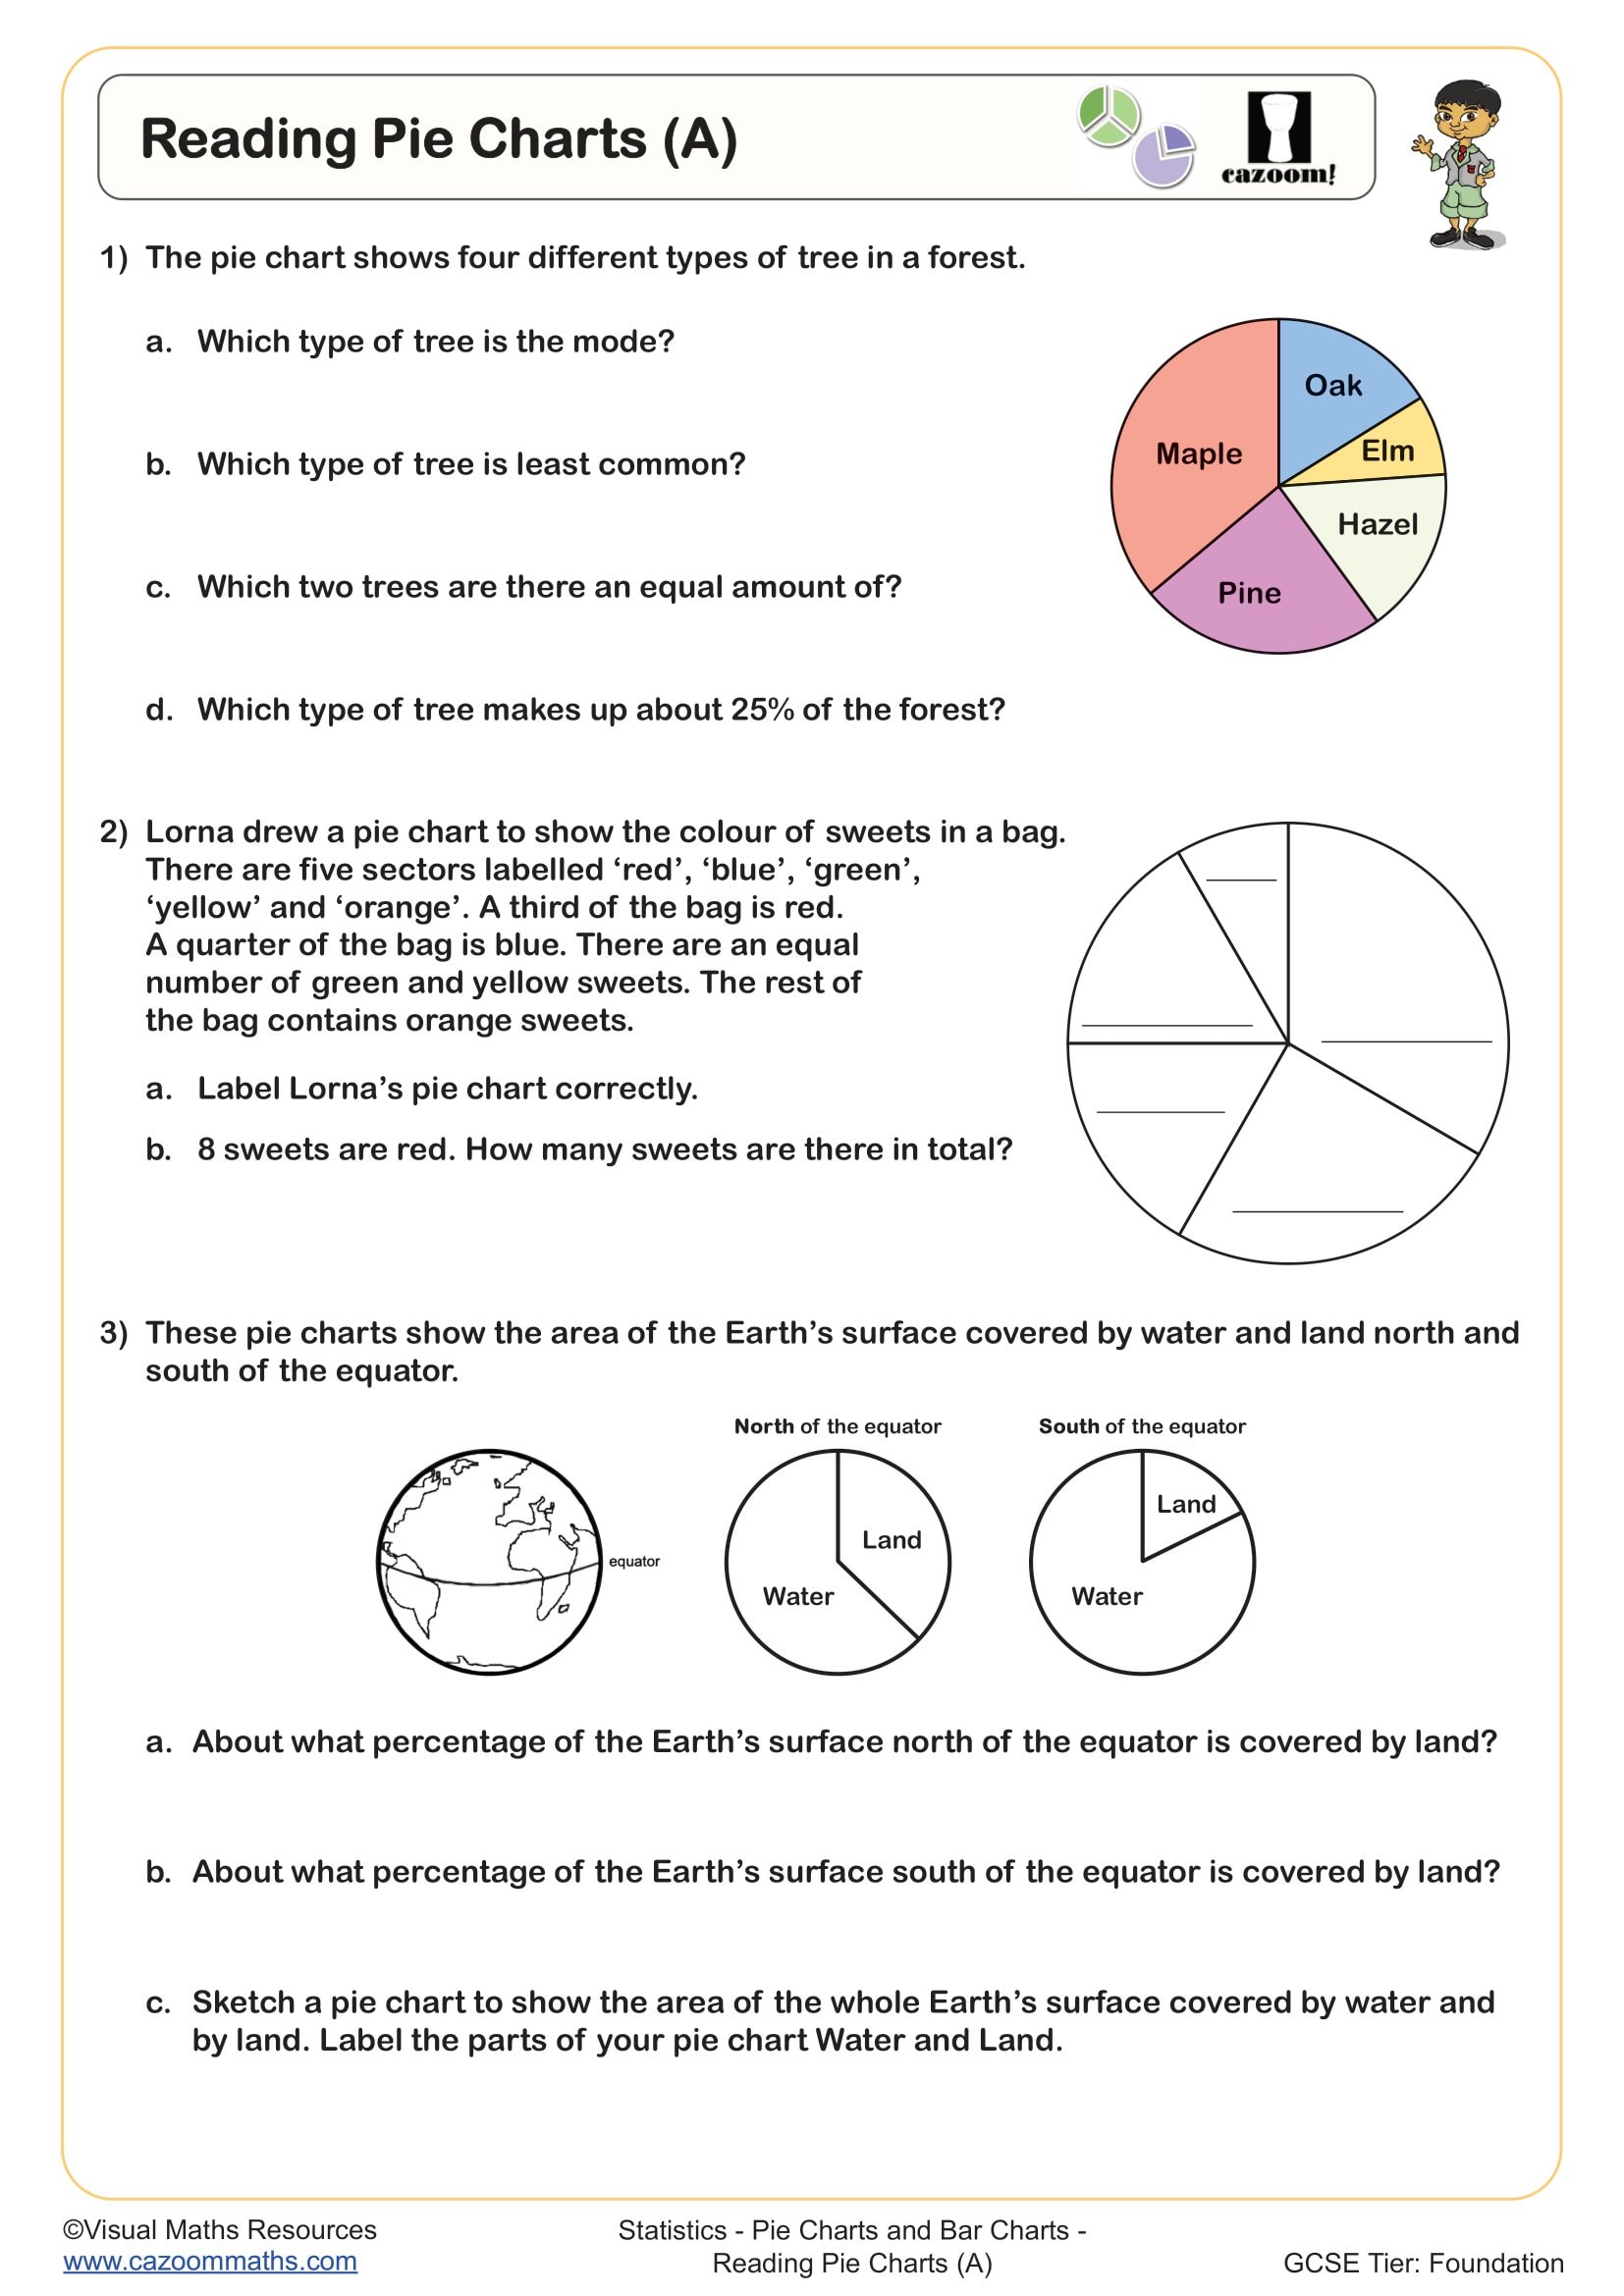
Reading Pie Charts (A)
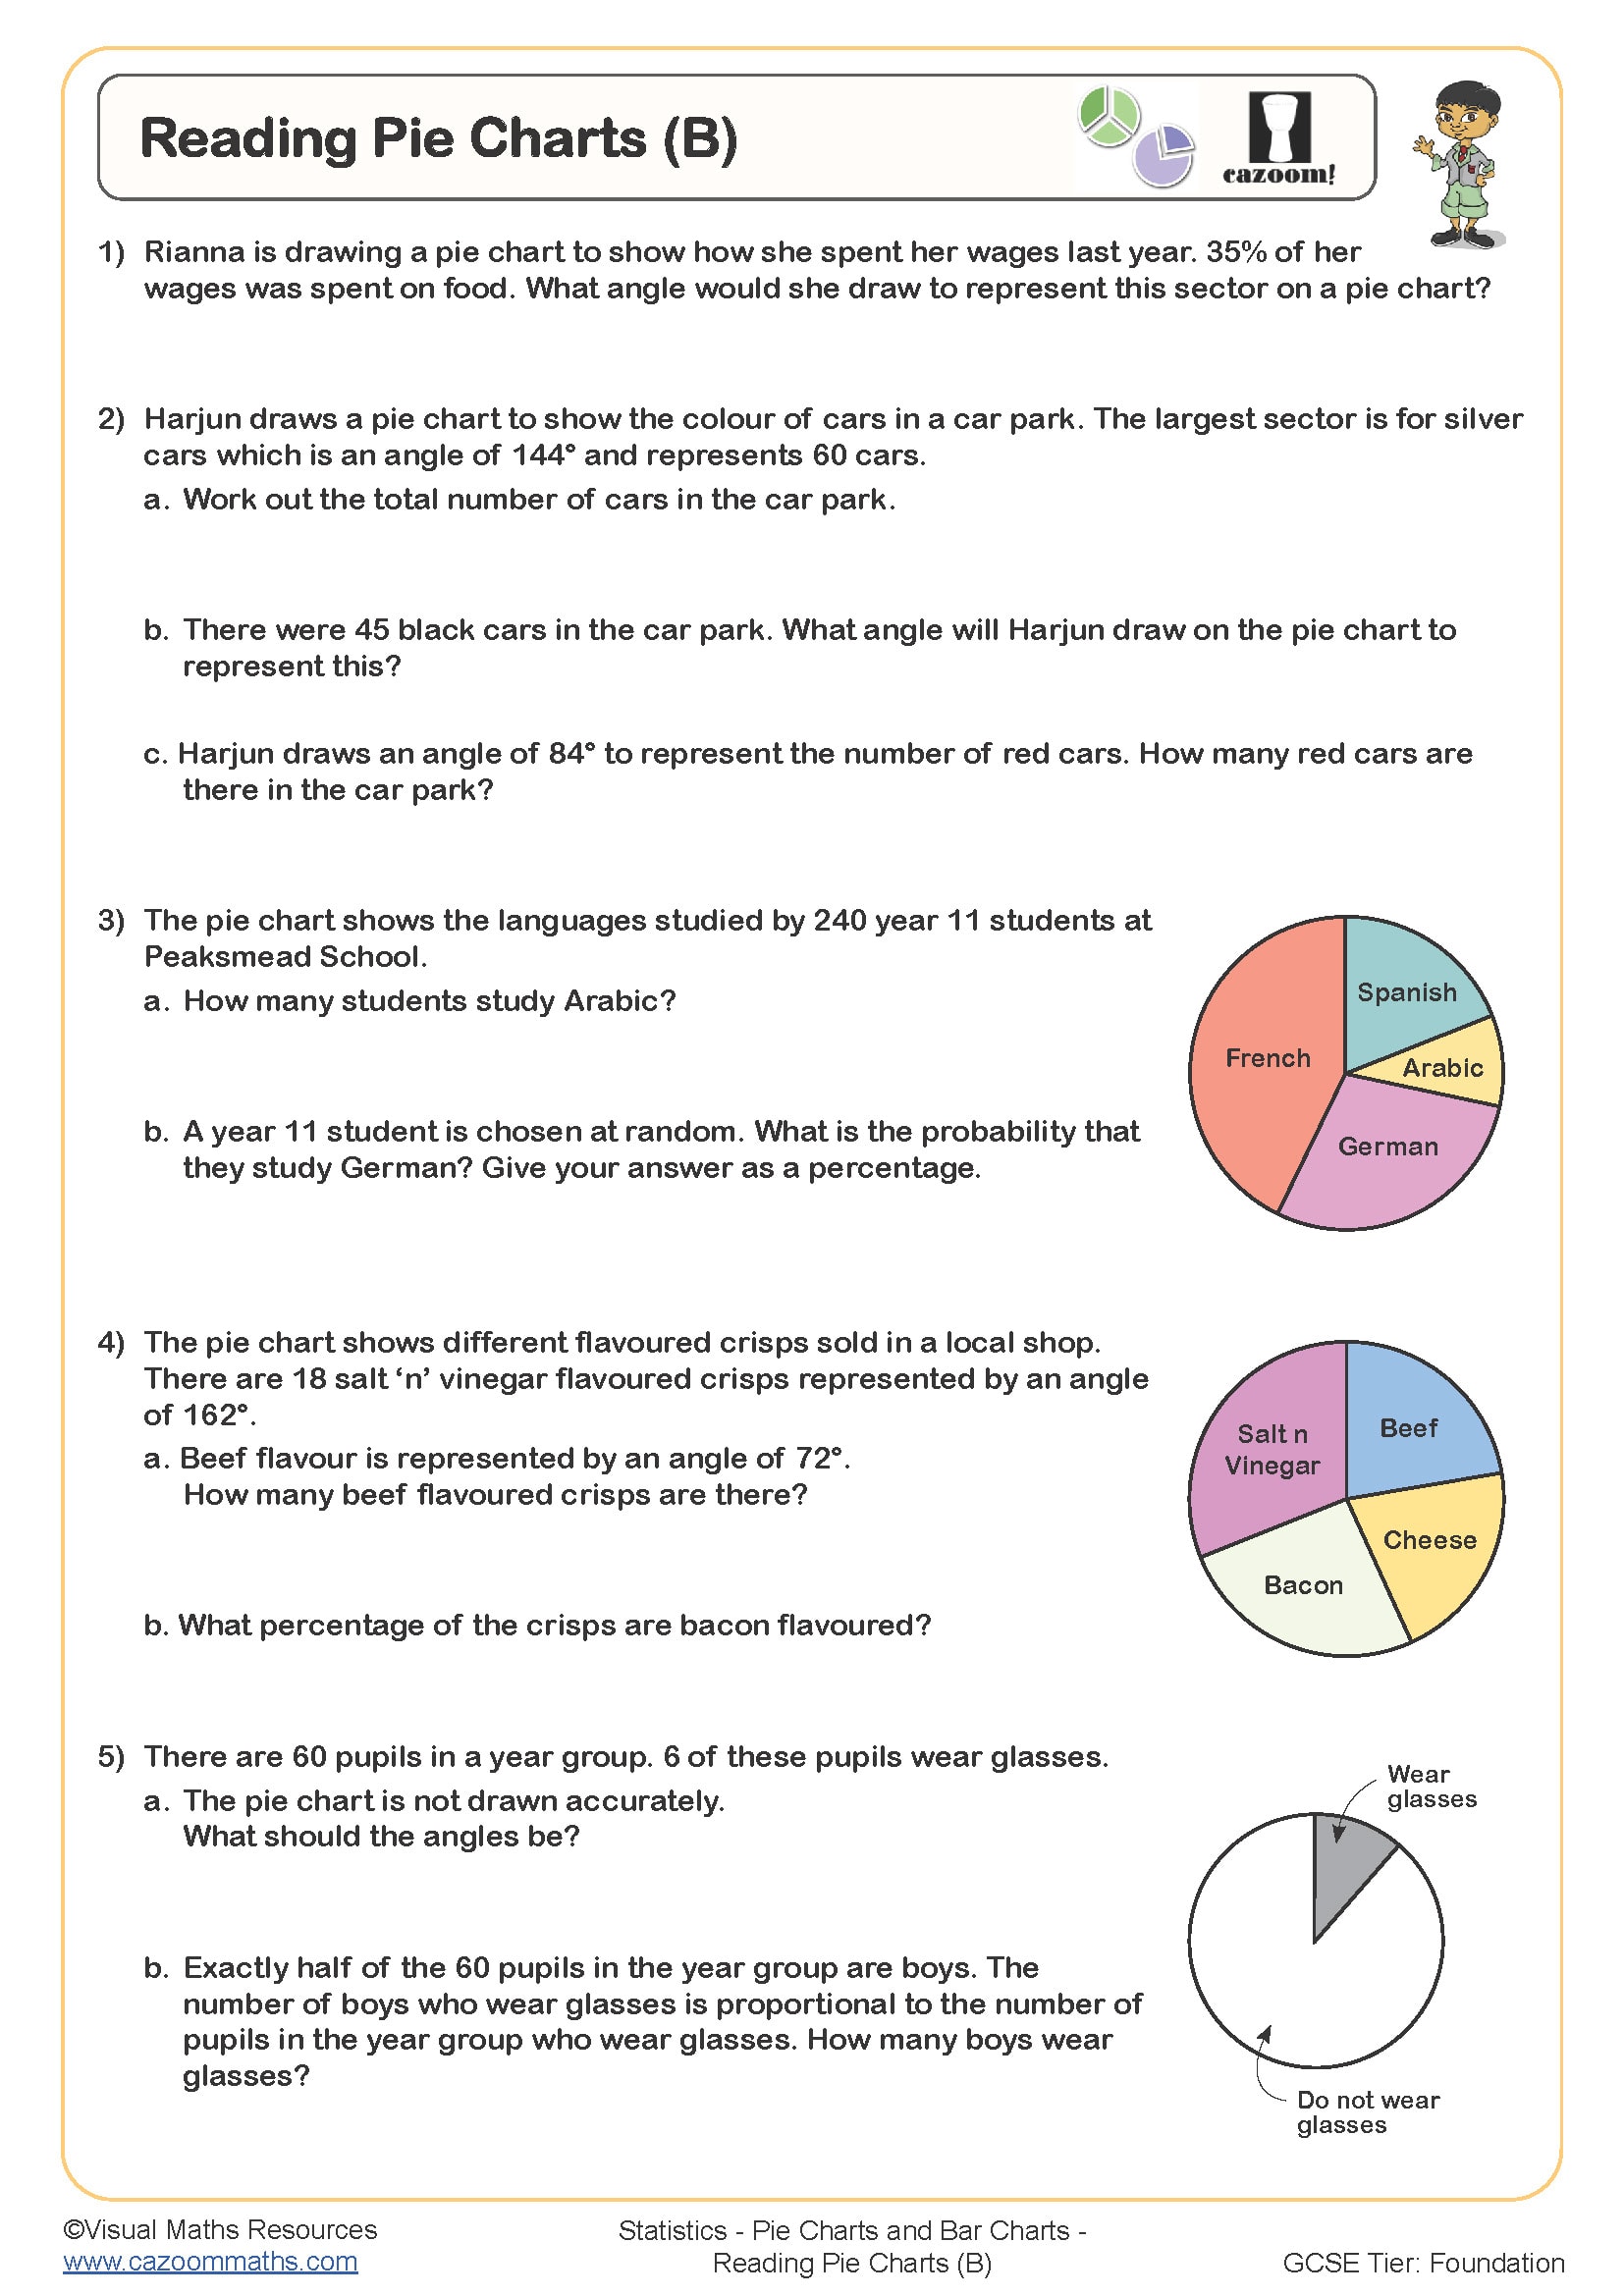
Reading Pie Charts (B)
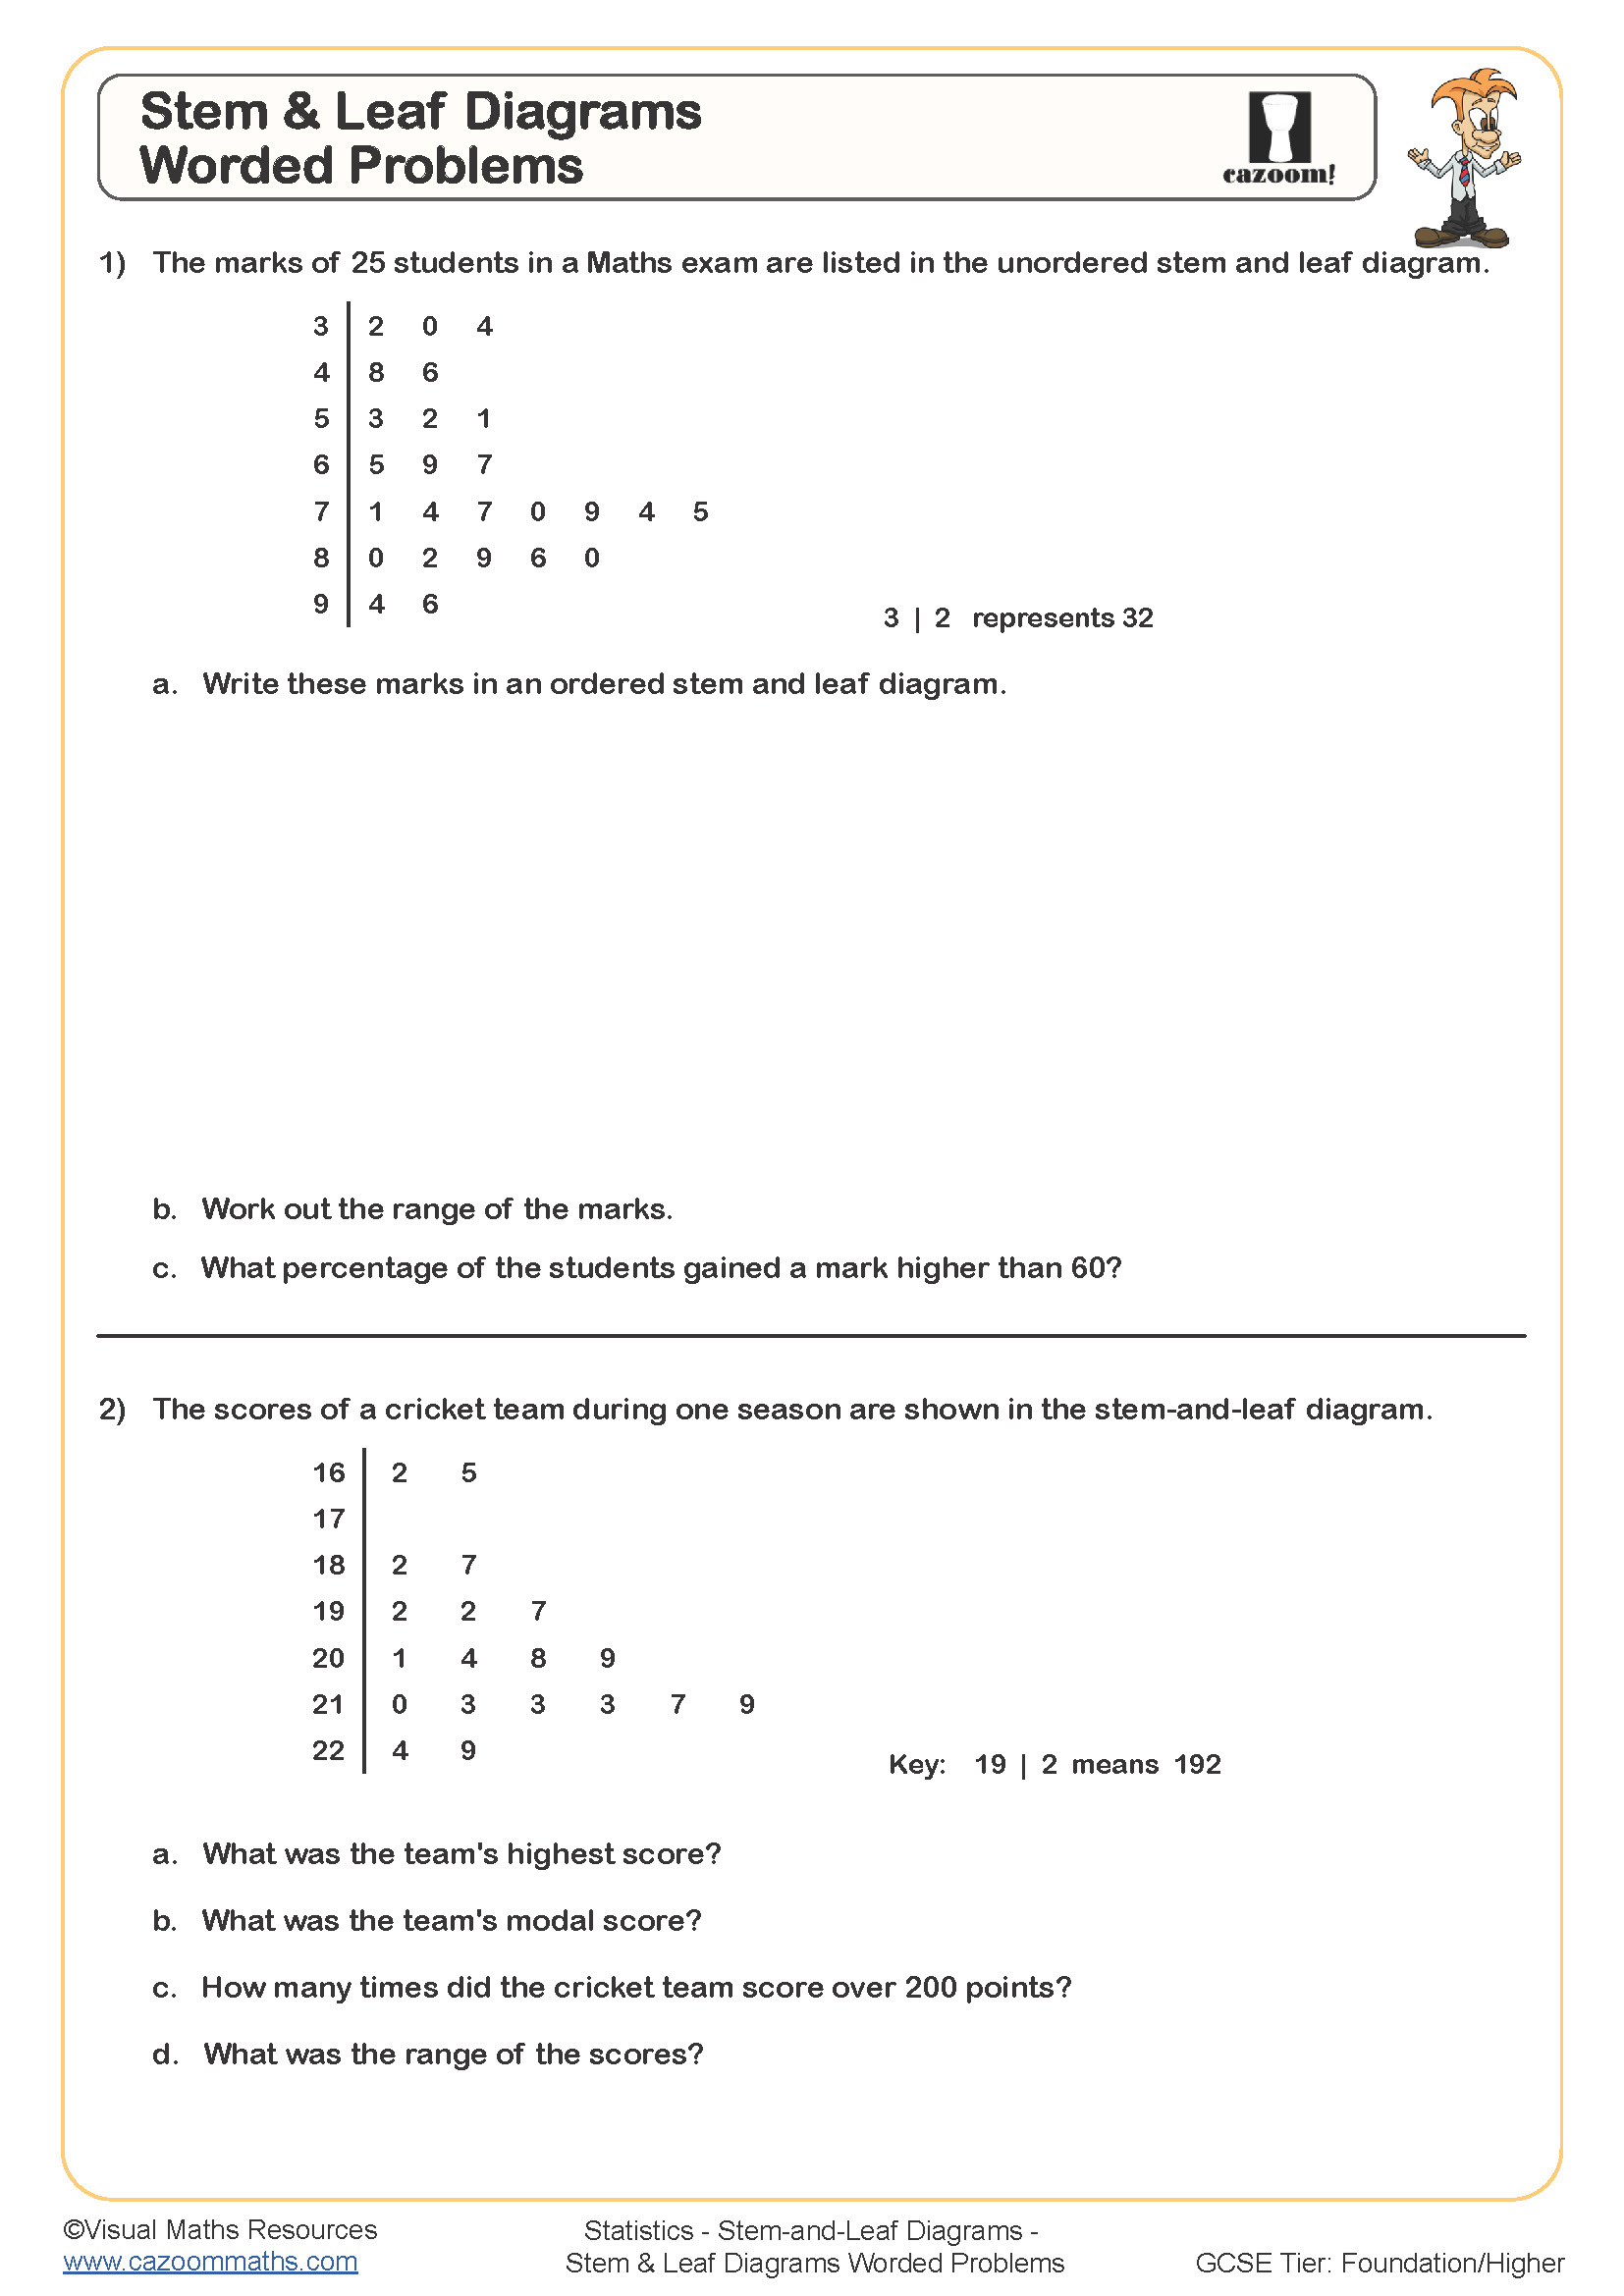
Stem and Leaf Word Problems
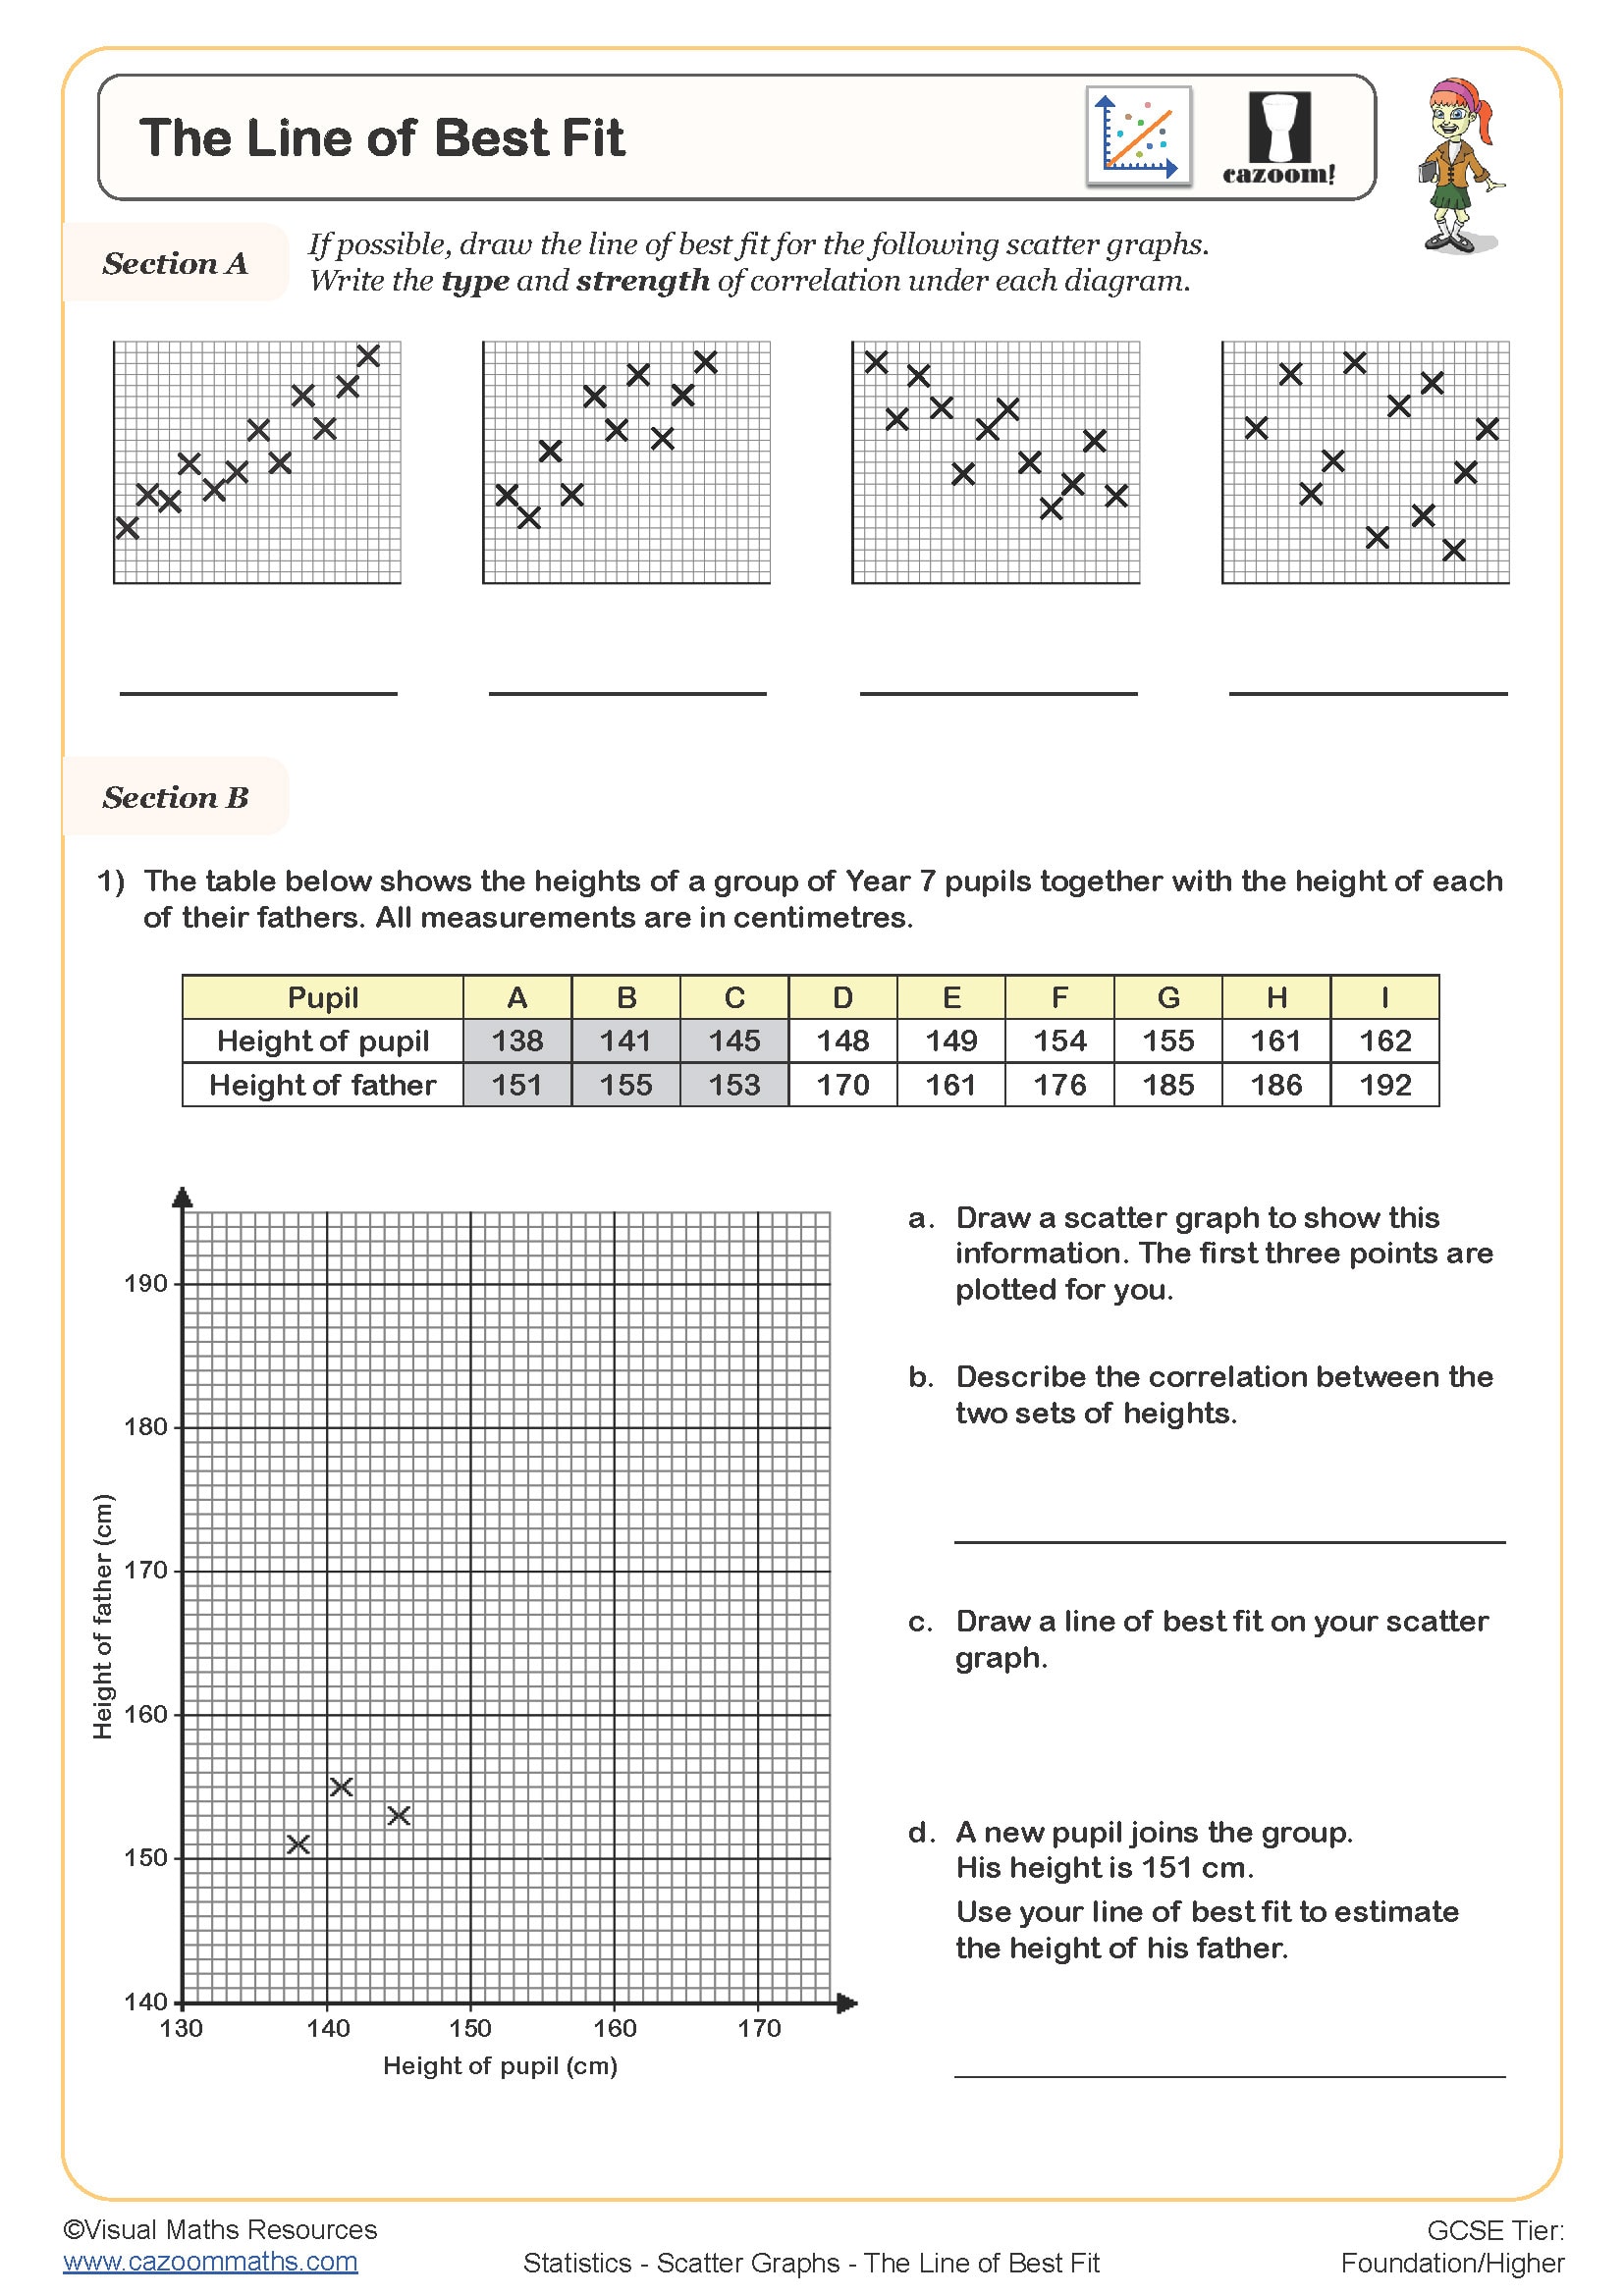
The Line of Best Fit
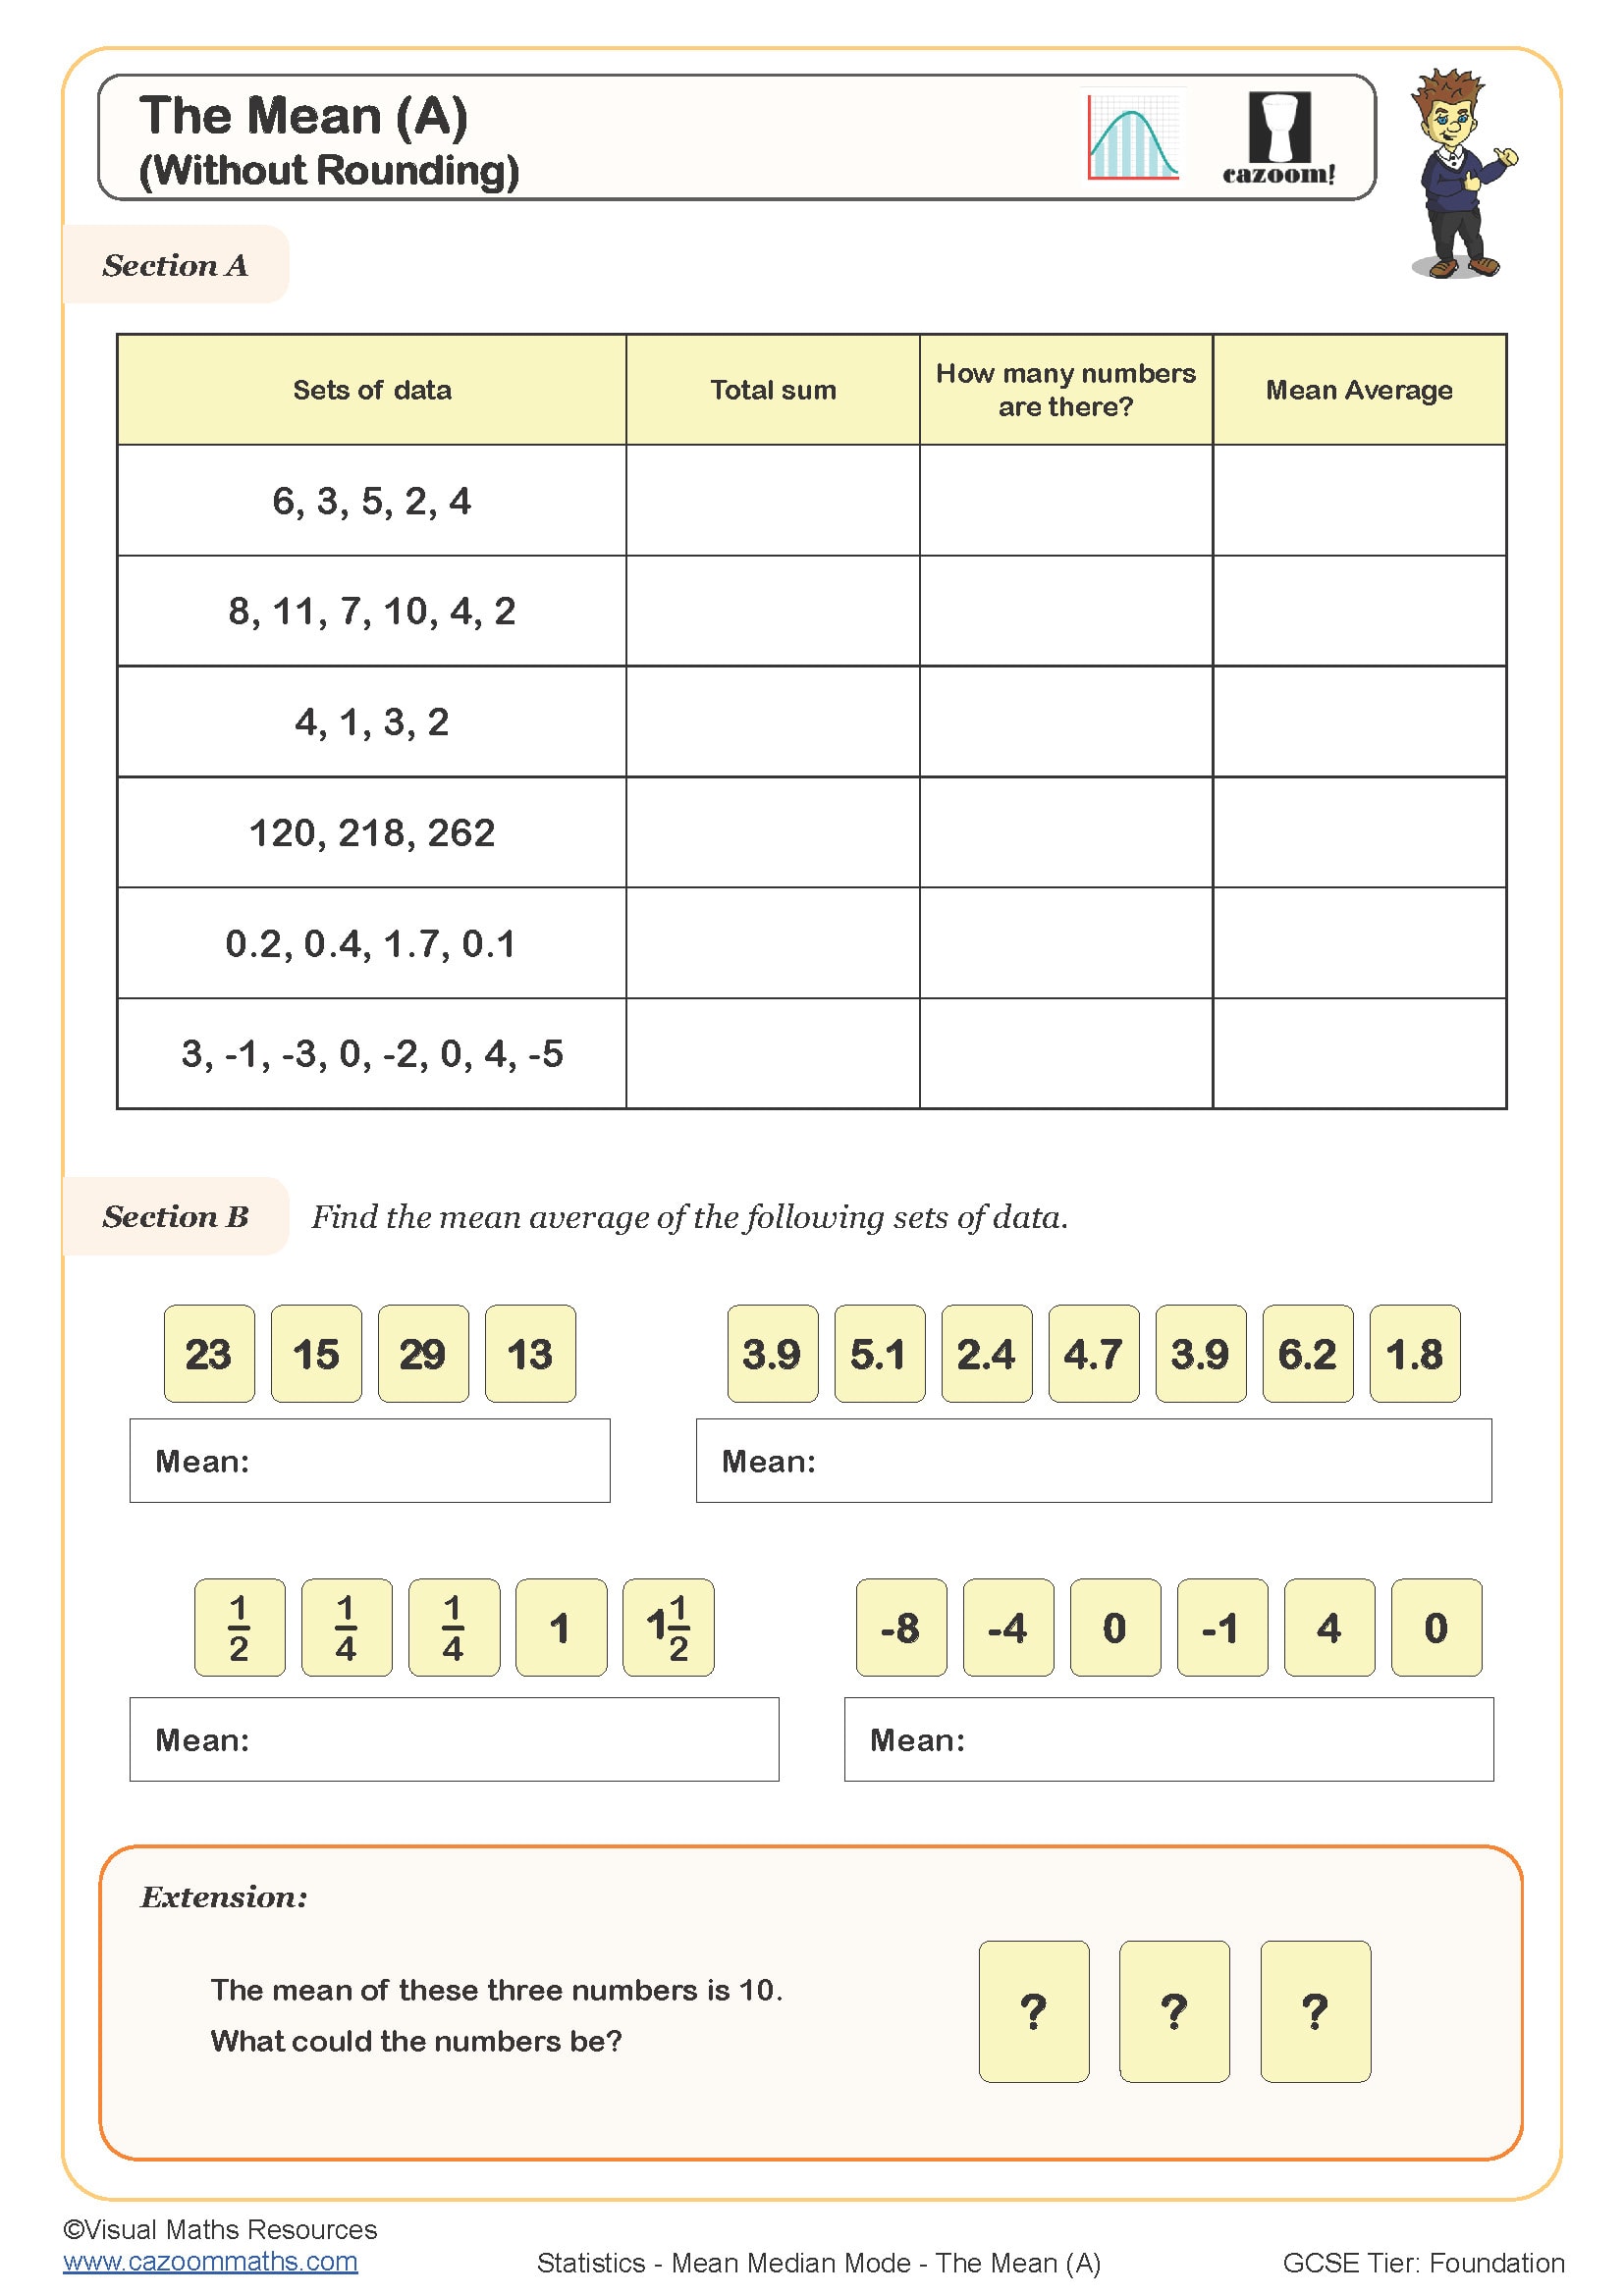
The Mean (A)
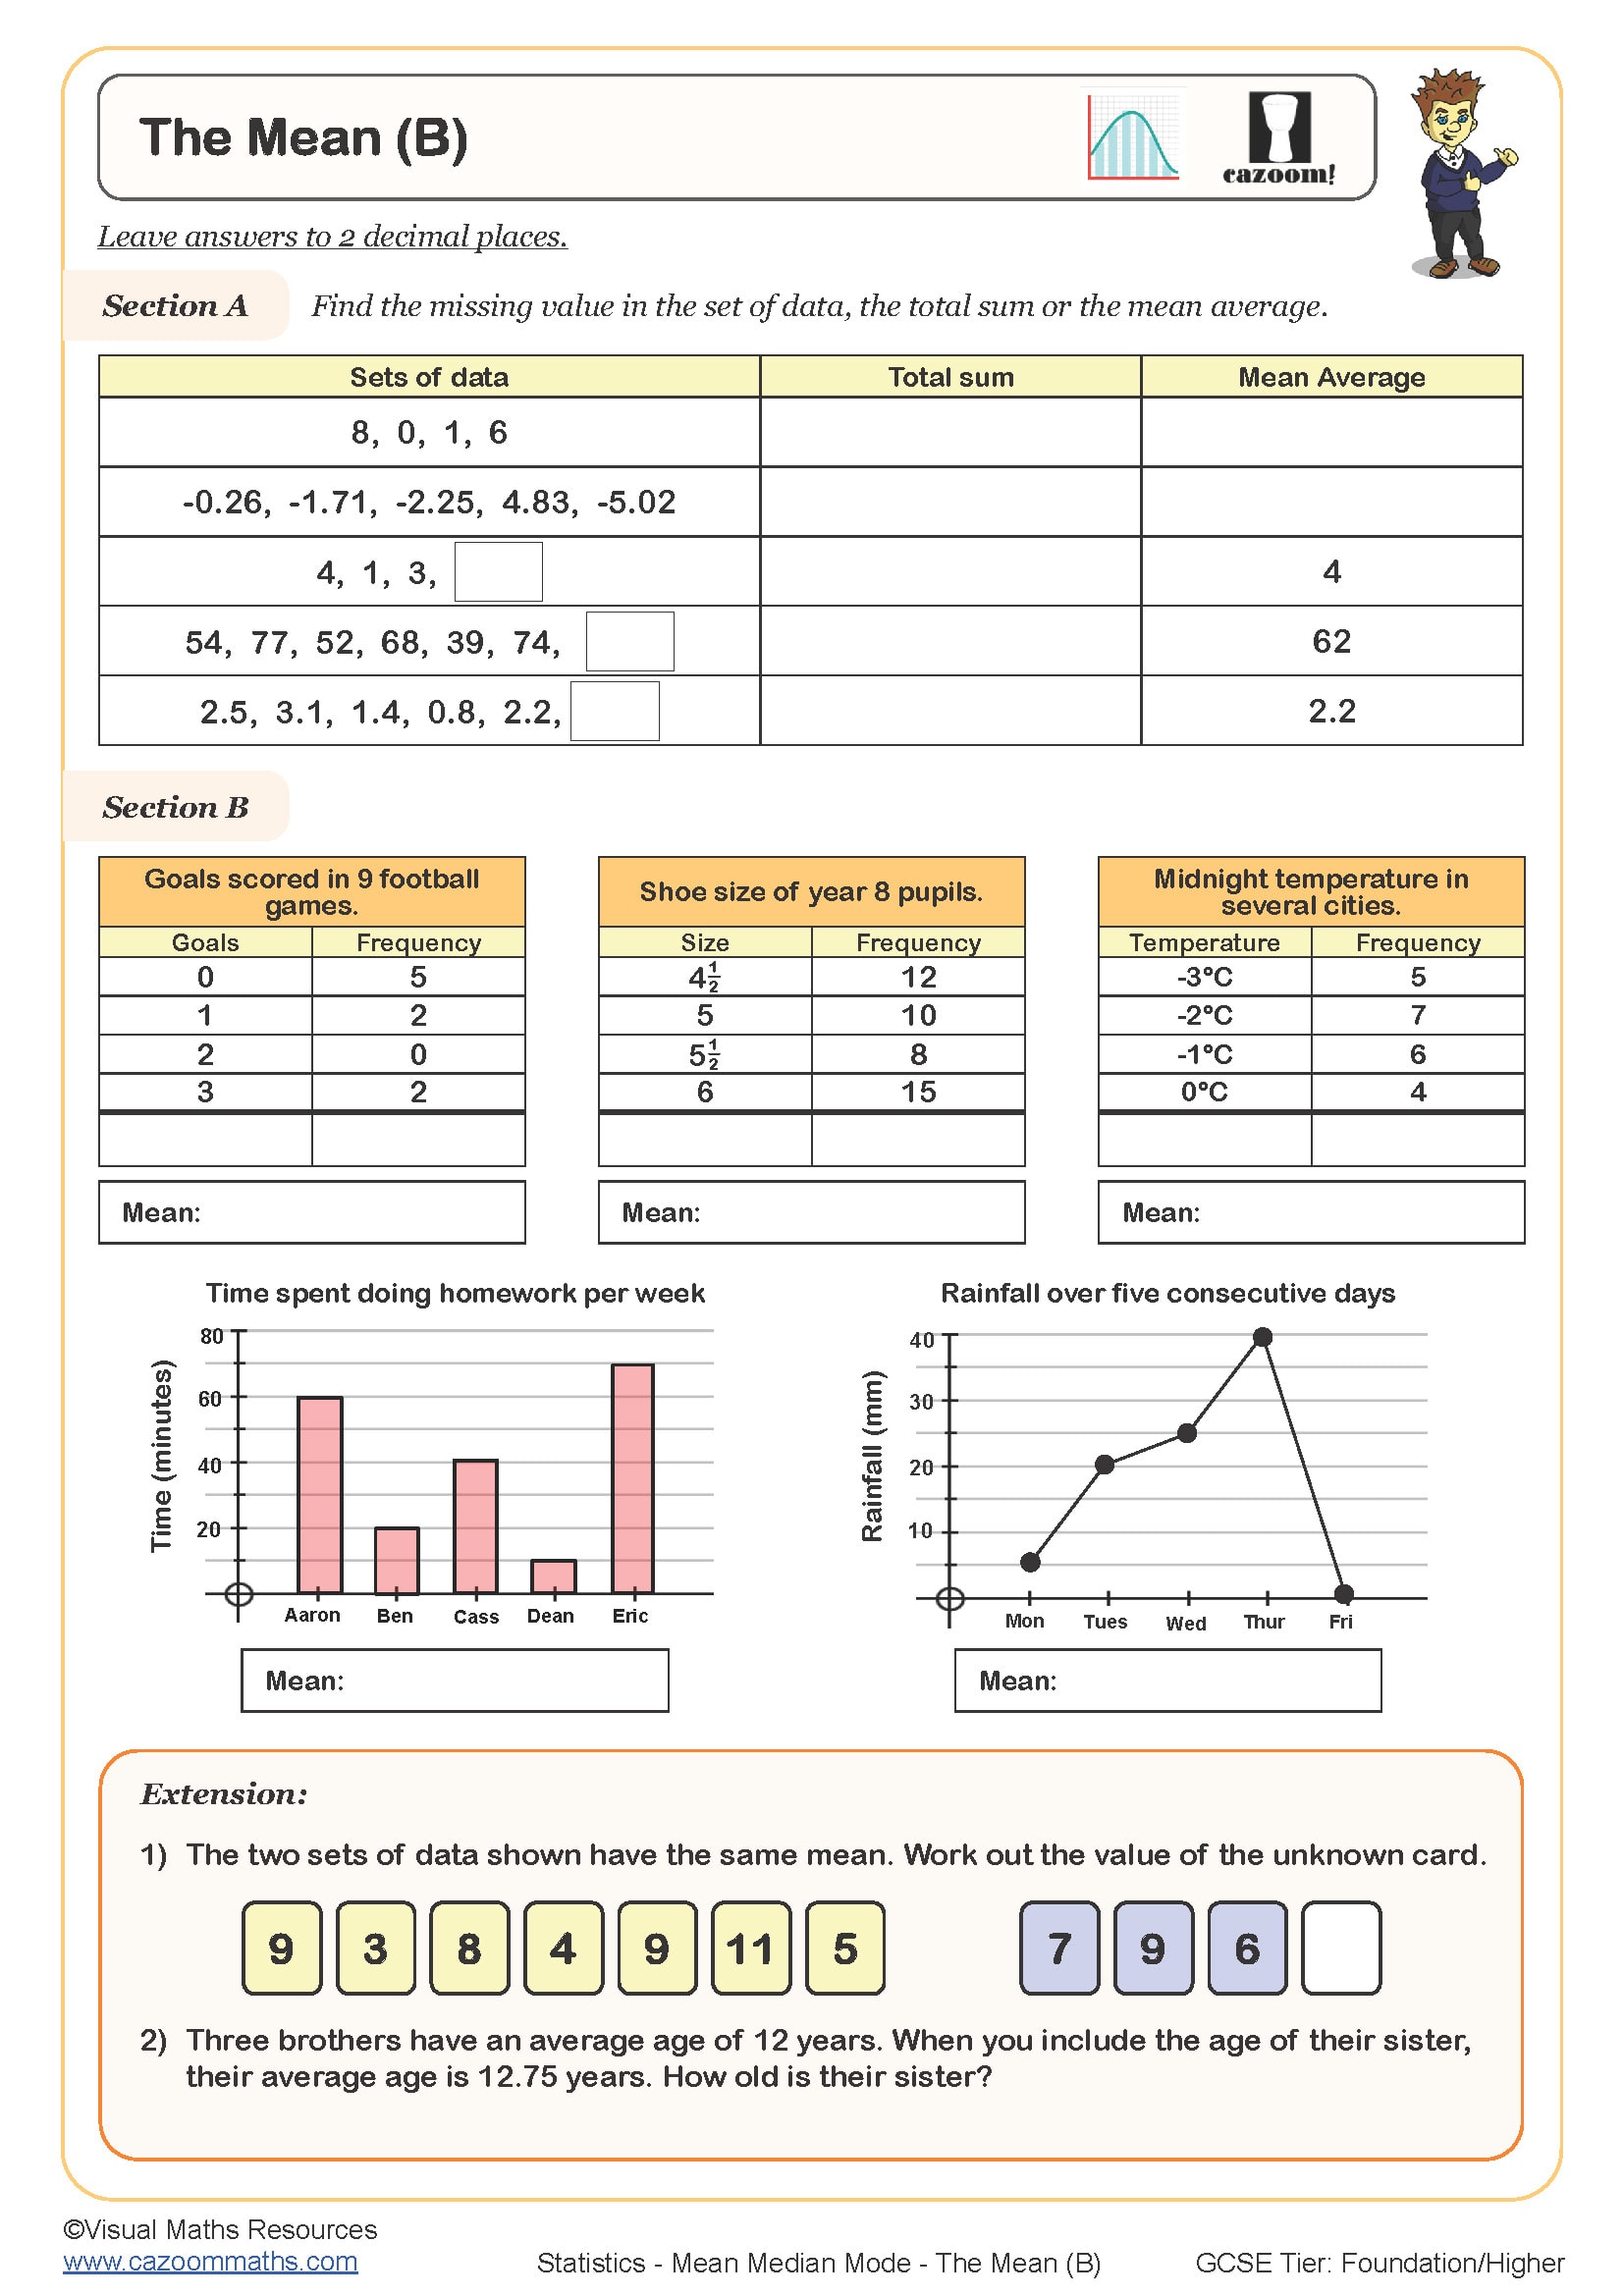
The Mean (B)
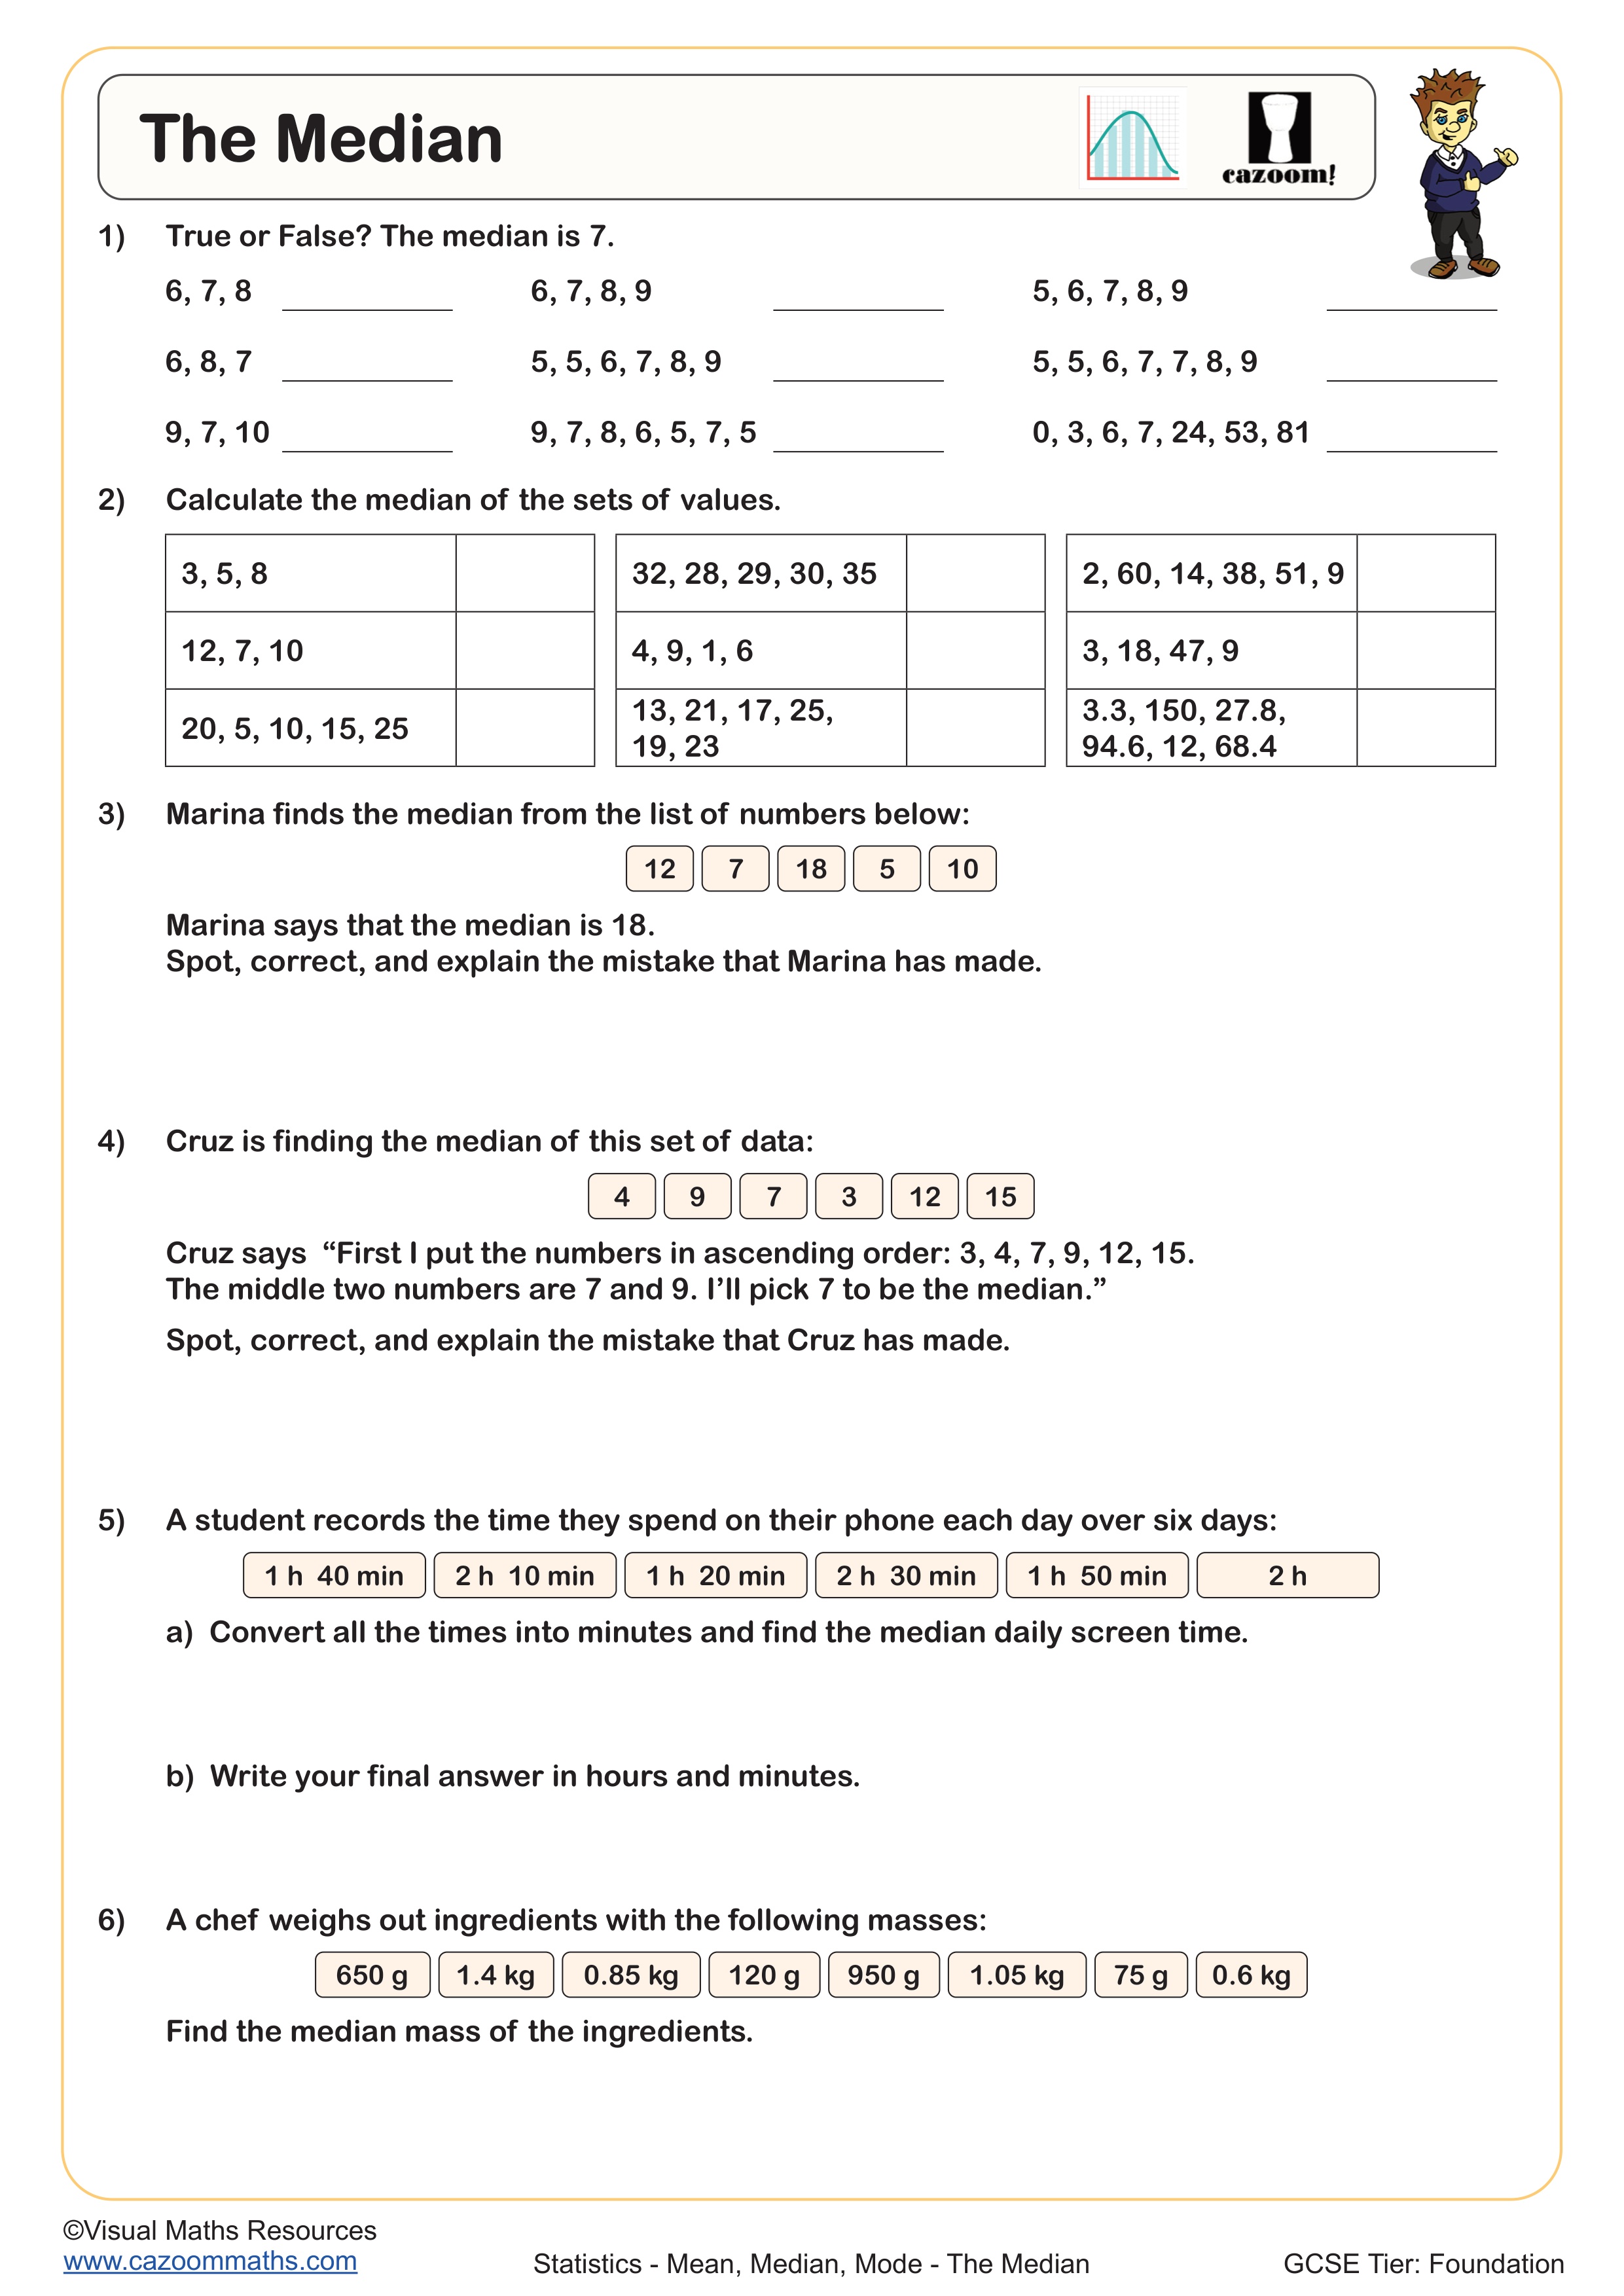
The Median
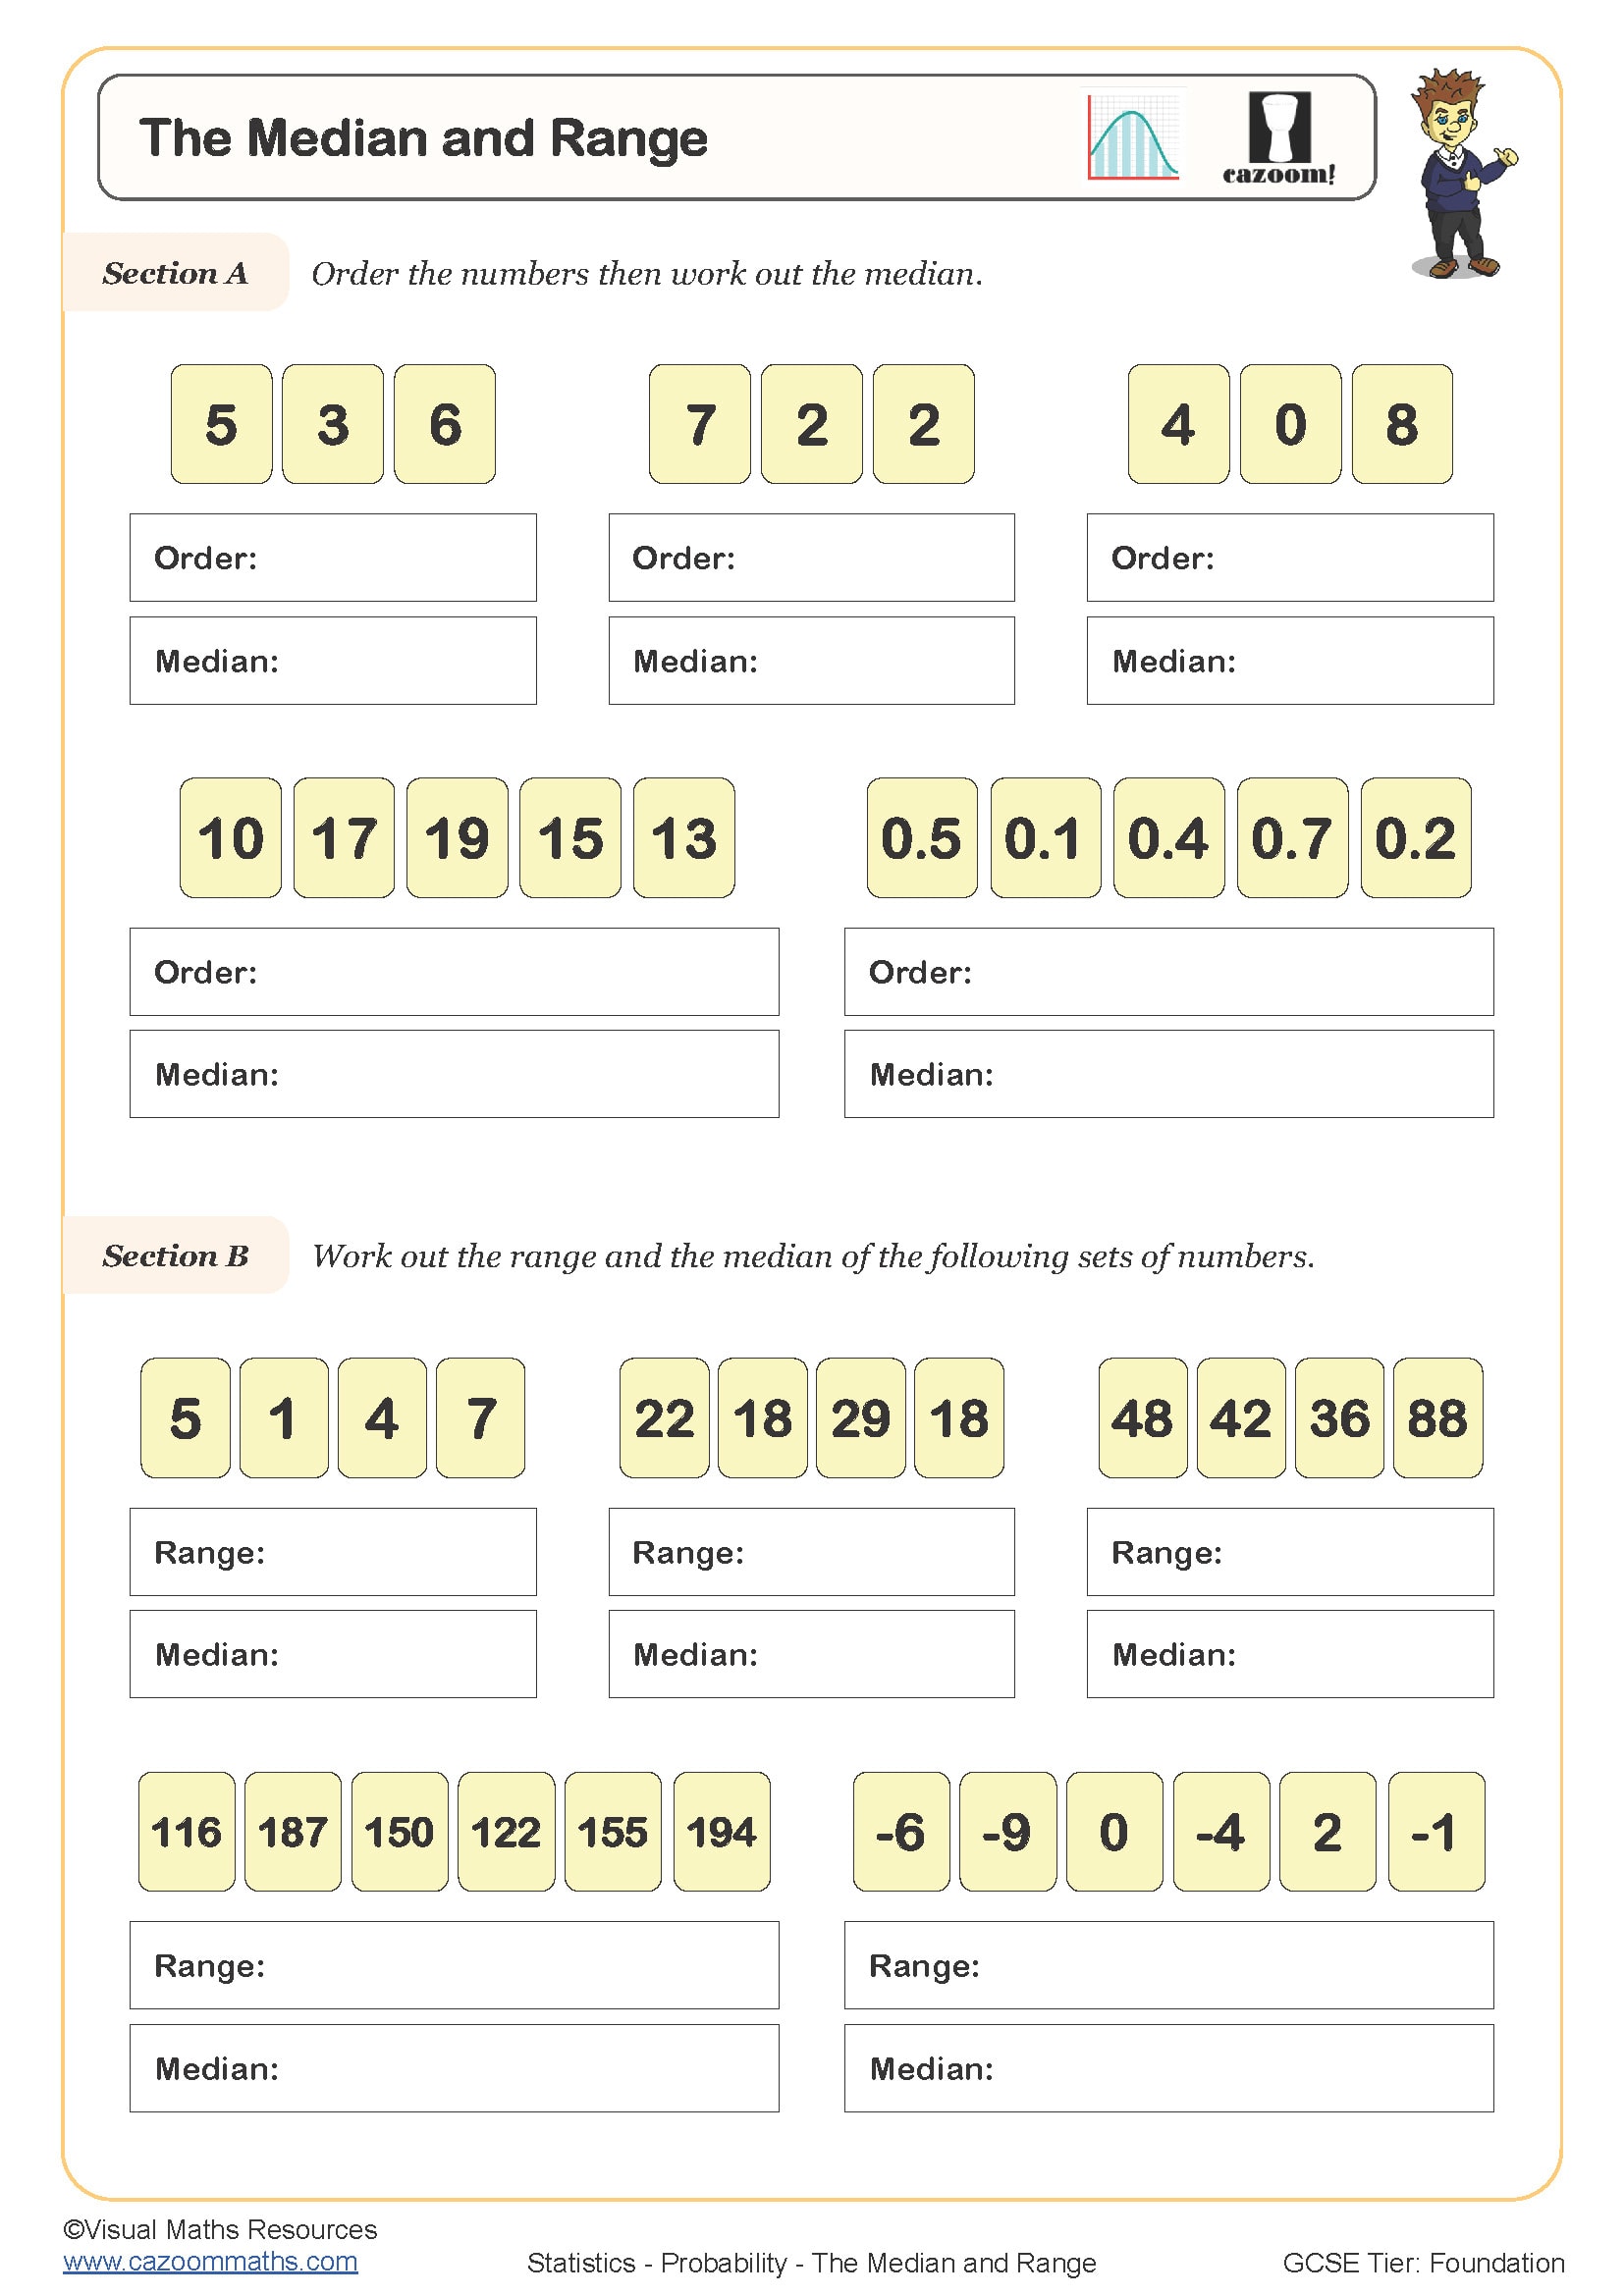
The Median and Range
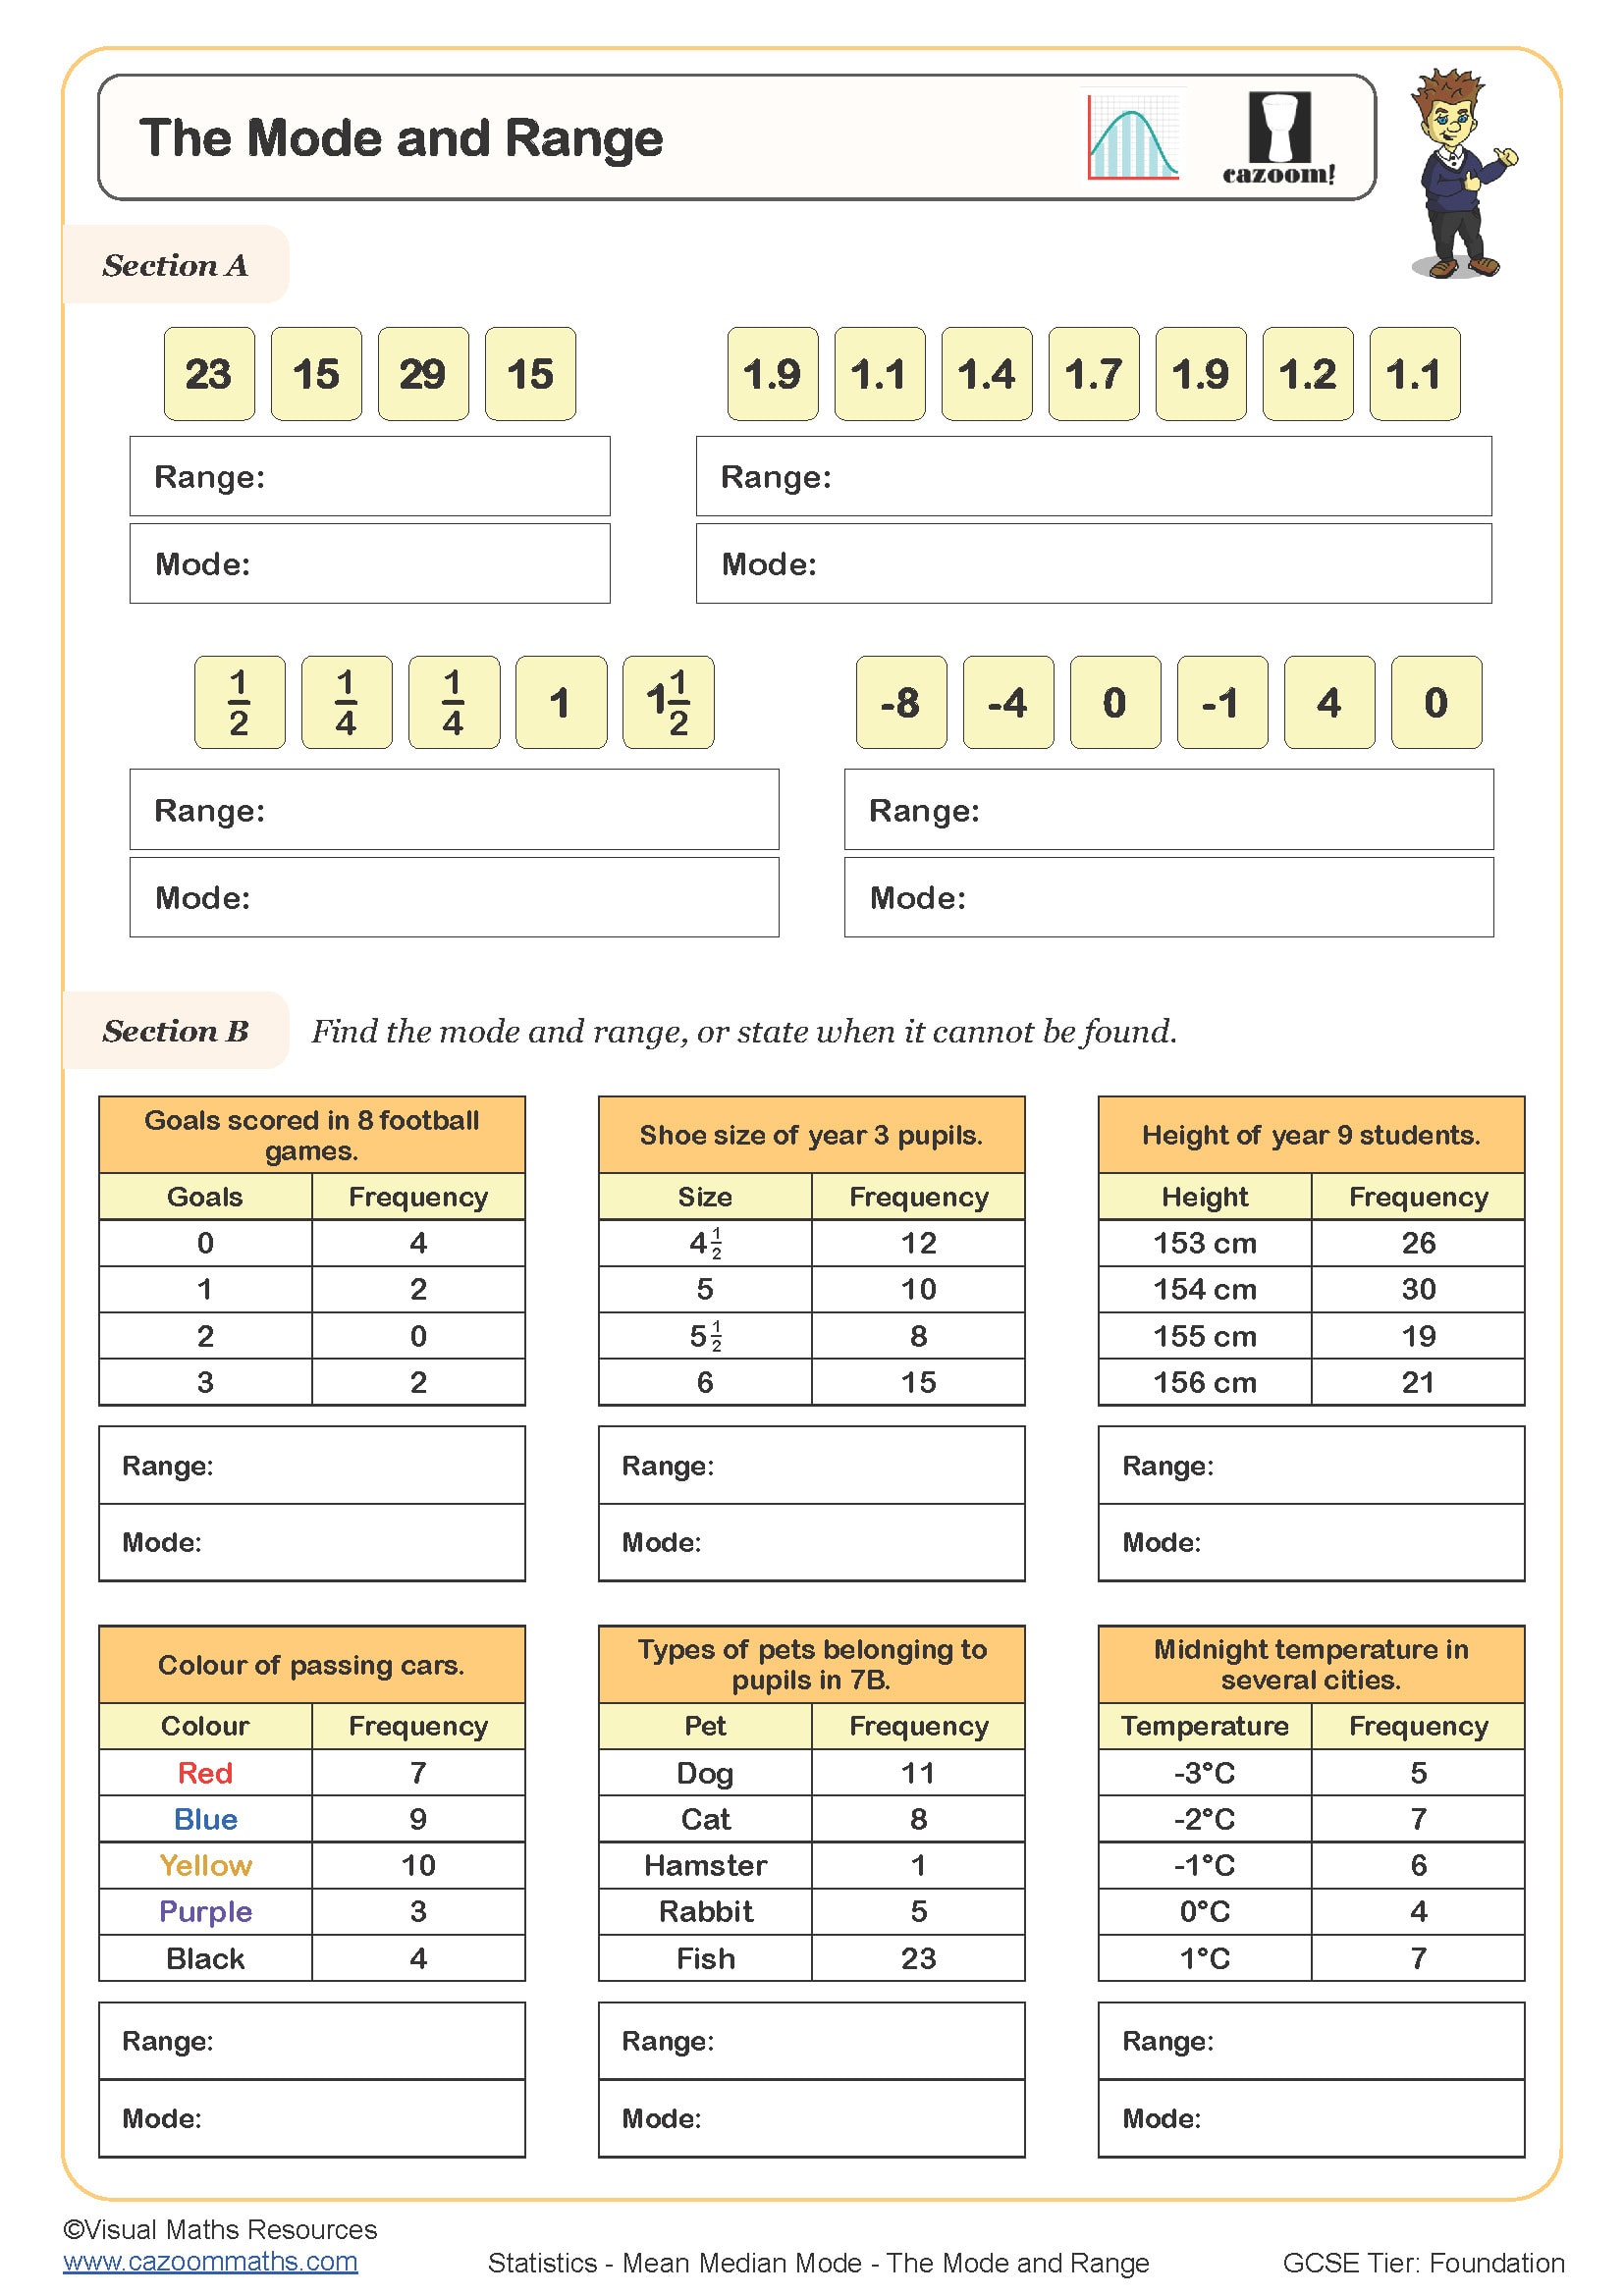
The Mode and Range
All worksheets are created by the team of experienced teachers at Cazoom Maths.
How Do Year 7 Statistics Worksheets Build Mathematical Confidence?
The formal mathematical language introduced by statistics changes the way students discuss data. It takes intentional practice with terms like "frequency," "distribution," and "correlation" to make the transition from casual observations to precise terminology. These exercises give students the chance to solve problems while accurately using statistical terminology. Fluency in alternating between various representation techniques is developed through regular interaction with diverse datasets. Instead of memorising processes, students learn to choose the right techniques based on the type of data. The progression through progressively complex scenarios reflects real-world problem-solving, where making the correct decision is just as important as carrying out calculations accurately. Confusion that frequently occurs when students encounter statistics without adequate background knowledge is avoided by this methodical development.
Specific learning benefits include:
• Masters data collection and organisation methods
• Develops critical thinking through interpretation
• Strengthens numerical reasoning with datasets
• Builds graph construction accuracy
• Establishes GCSE statistics foundations
• Increases calculation speed and precision
• Improves mathematical communication skills
What Statistics Skills Do Year 7 Worksheets Develop?
Moving from concrete examples to abstract reasoning, these worksheets scaffold learning through carefully sequenced topics. Initial exercises use familiar contexts like school surveys before introducing formal statistical problems. The materials balance computational practice with interpretive skills, ensuring students can process data and articulate findings clearly. Each topic connects to the next, creating a coherent learning journey rather than isolated skill practice.
The core skills covered include:
• Frequency tables – organising raw data into clear categories
• Bar charts and pictograms – visual representation of categorical data
• Pie charts – understanding proportions and angle calculations
• Mean, median and mode – finding averages from data sets
• Range – measuring spread in numerical data
• Line graphs – showing change over time
• Probability basics – introducing likelihood and simple experiments
• Data collection methods – designing surveys and avoiding bias
• Interpreting results – drawing conclusions from statistical evidence
Why Secondary Teachers Trust Our Statistics Resources
Classroom reality demands resources that work immediately without extensive preparation. These statistics worksheets arrive print-ready with clear instructions that students can follow independently, freeing teachers to support individuals who need extra help. The differentiated structure means one resource serves multiple ability levels within the same class, with extension questions challenging advanced learners whilst core exercises remain accessible to all. Answer sheets include detailed work that transforms marking into a diagnostic tool for identifying misconceptions. The variety of question formats reflects the diversity teachers need for different lesson phases – from starter activities to extended investigations. Mixed exercise types prevent the monotony that can develop with repetitive practice, maintaining engagement across longer units of work. This practical design emerged from collaboration with practising secondary maths teachers who understand the daily challenges of statistics instruction.
Where Year 7 Students Use Statistics in Daily Life
Statistical thinking shapes how students navigate information-rich environments beyond school. These worksheets highlight connections between classroom learning and authentic applications, demonstrating why statistical literacy matters for informed decision-making.
• Reading simple graphs in the news and sports
• Comparing attendance or scores at school
• Summarising survey results
• Tracking goals over time
• Looking at weather trends