Statistics Worksheets
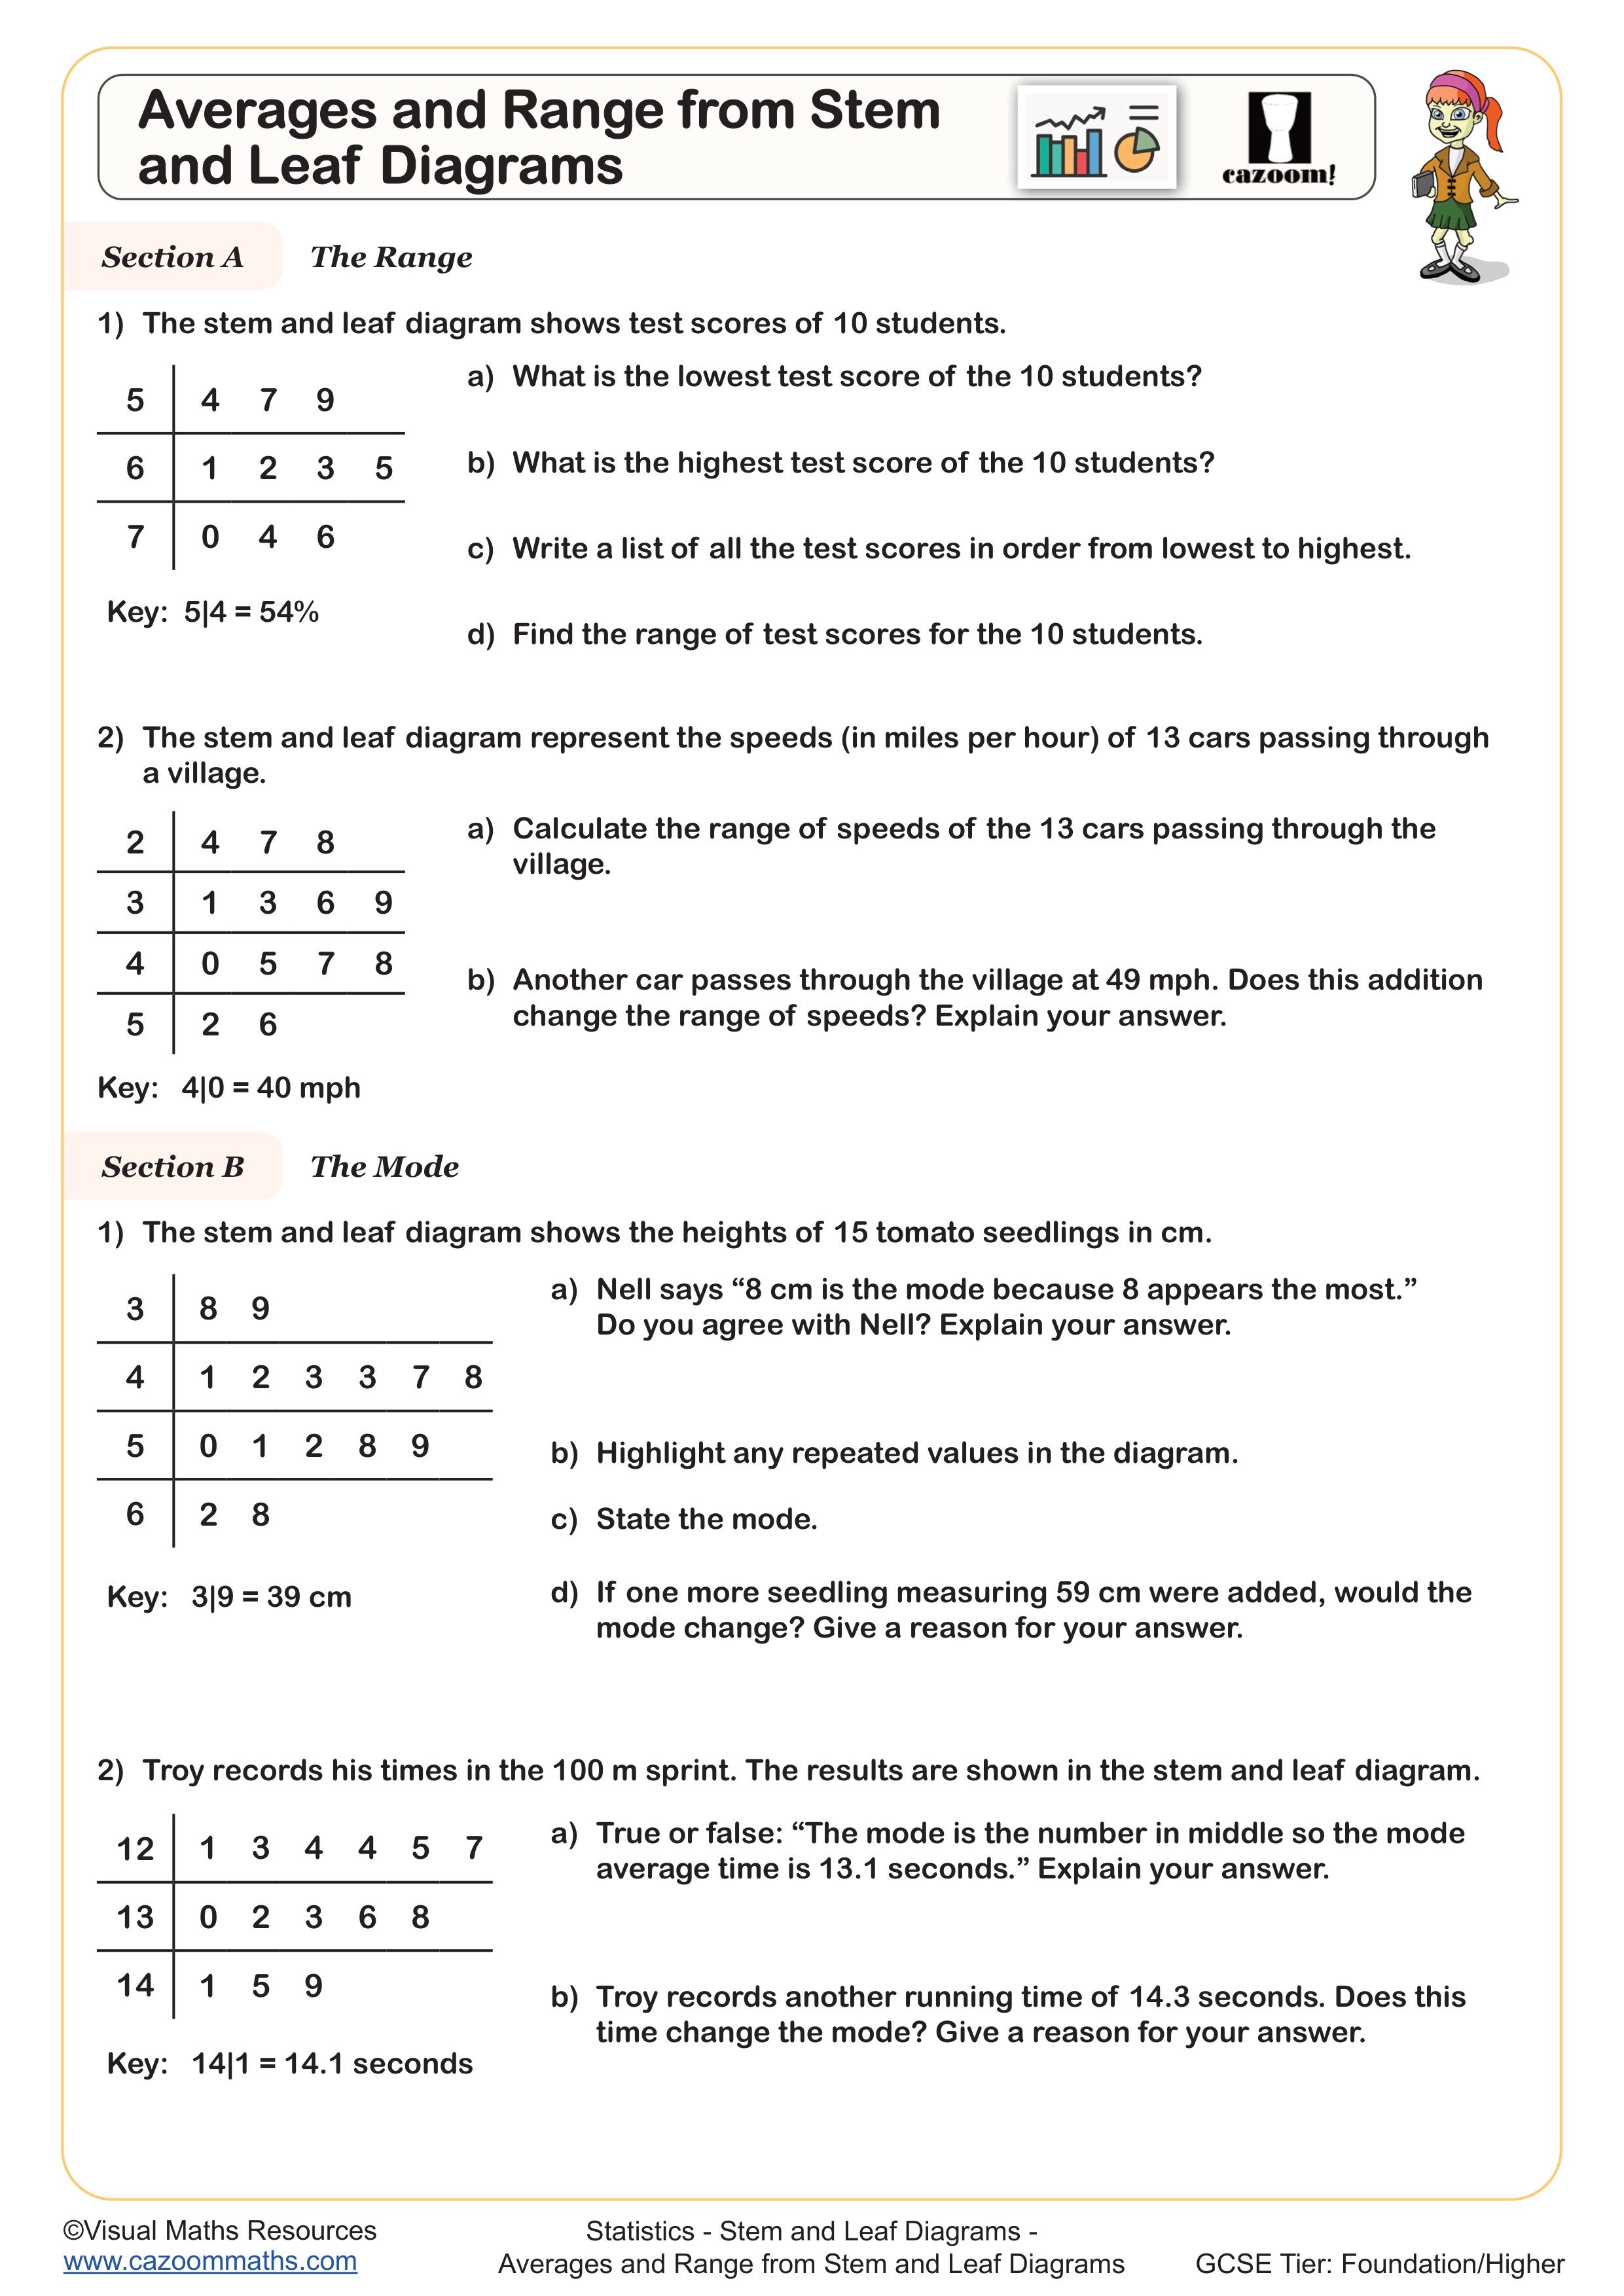
Averages from Stem and Leaf Diagrams
Year groups: 7, 8
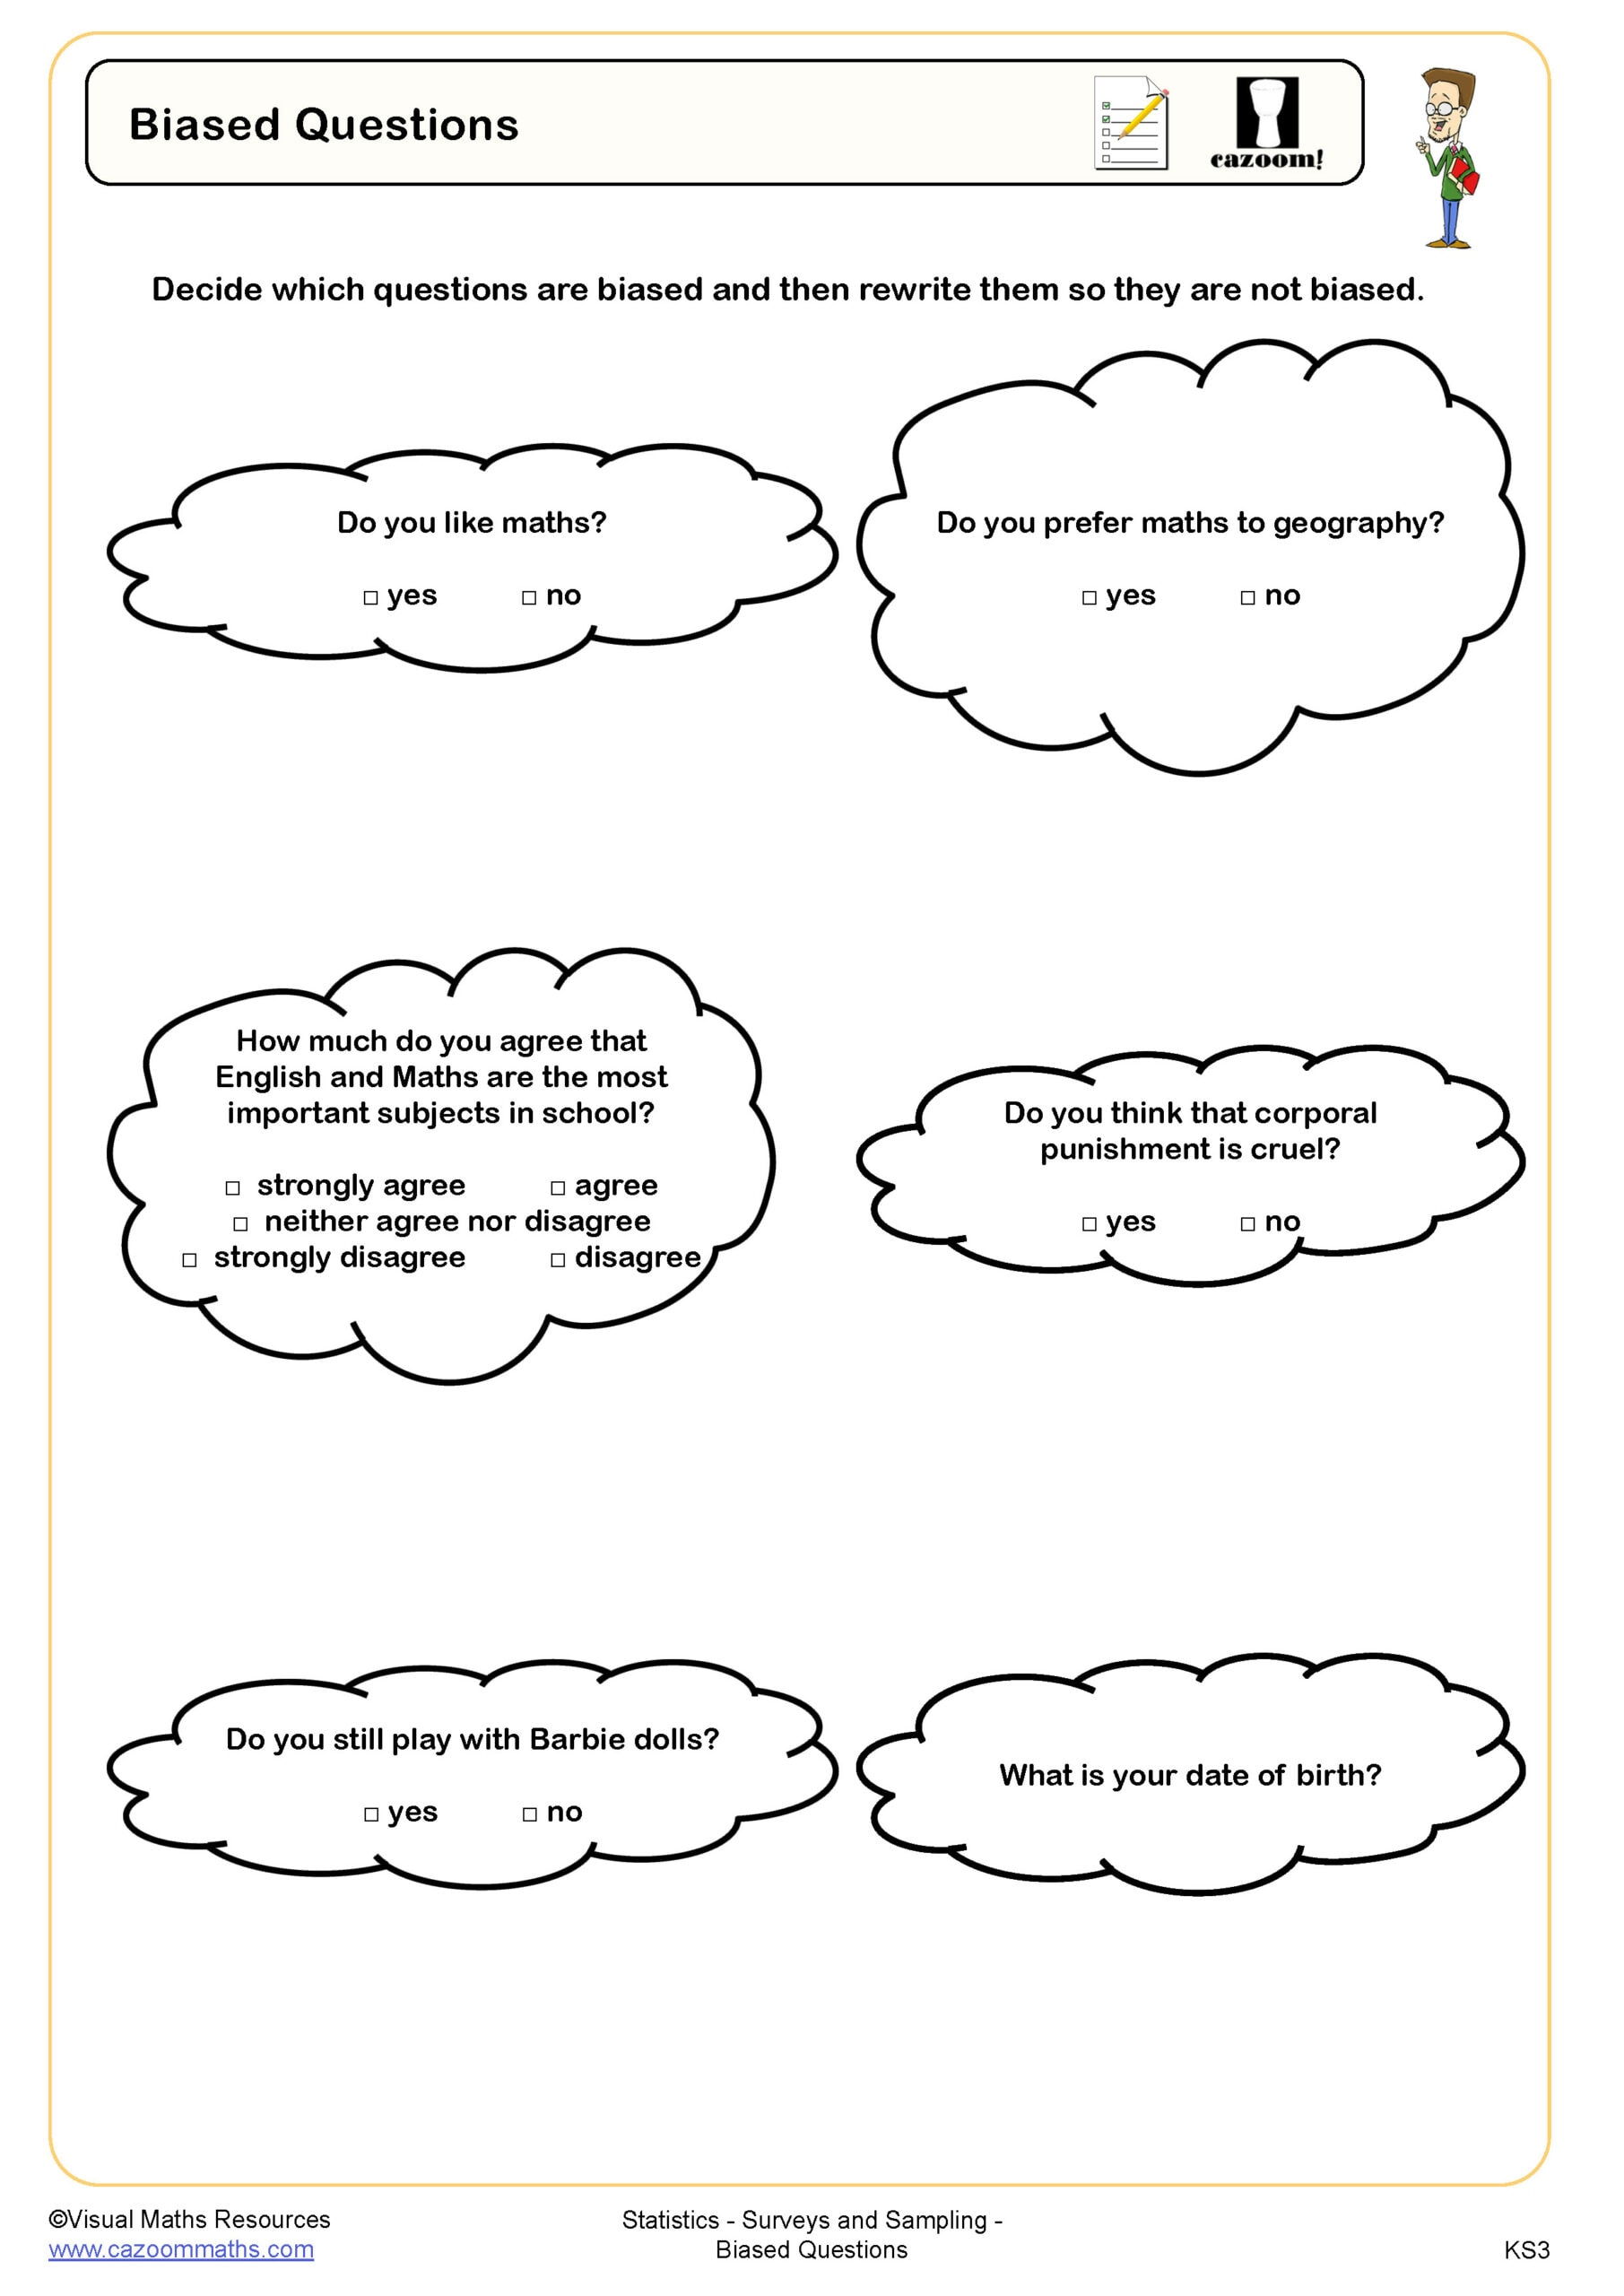
Biased Questions
Year groups: 7, 8
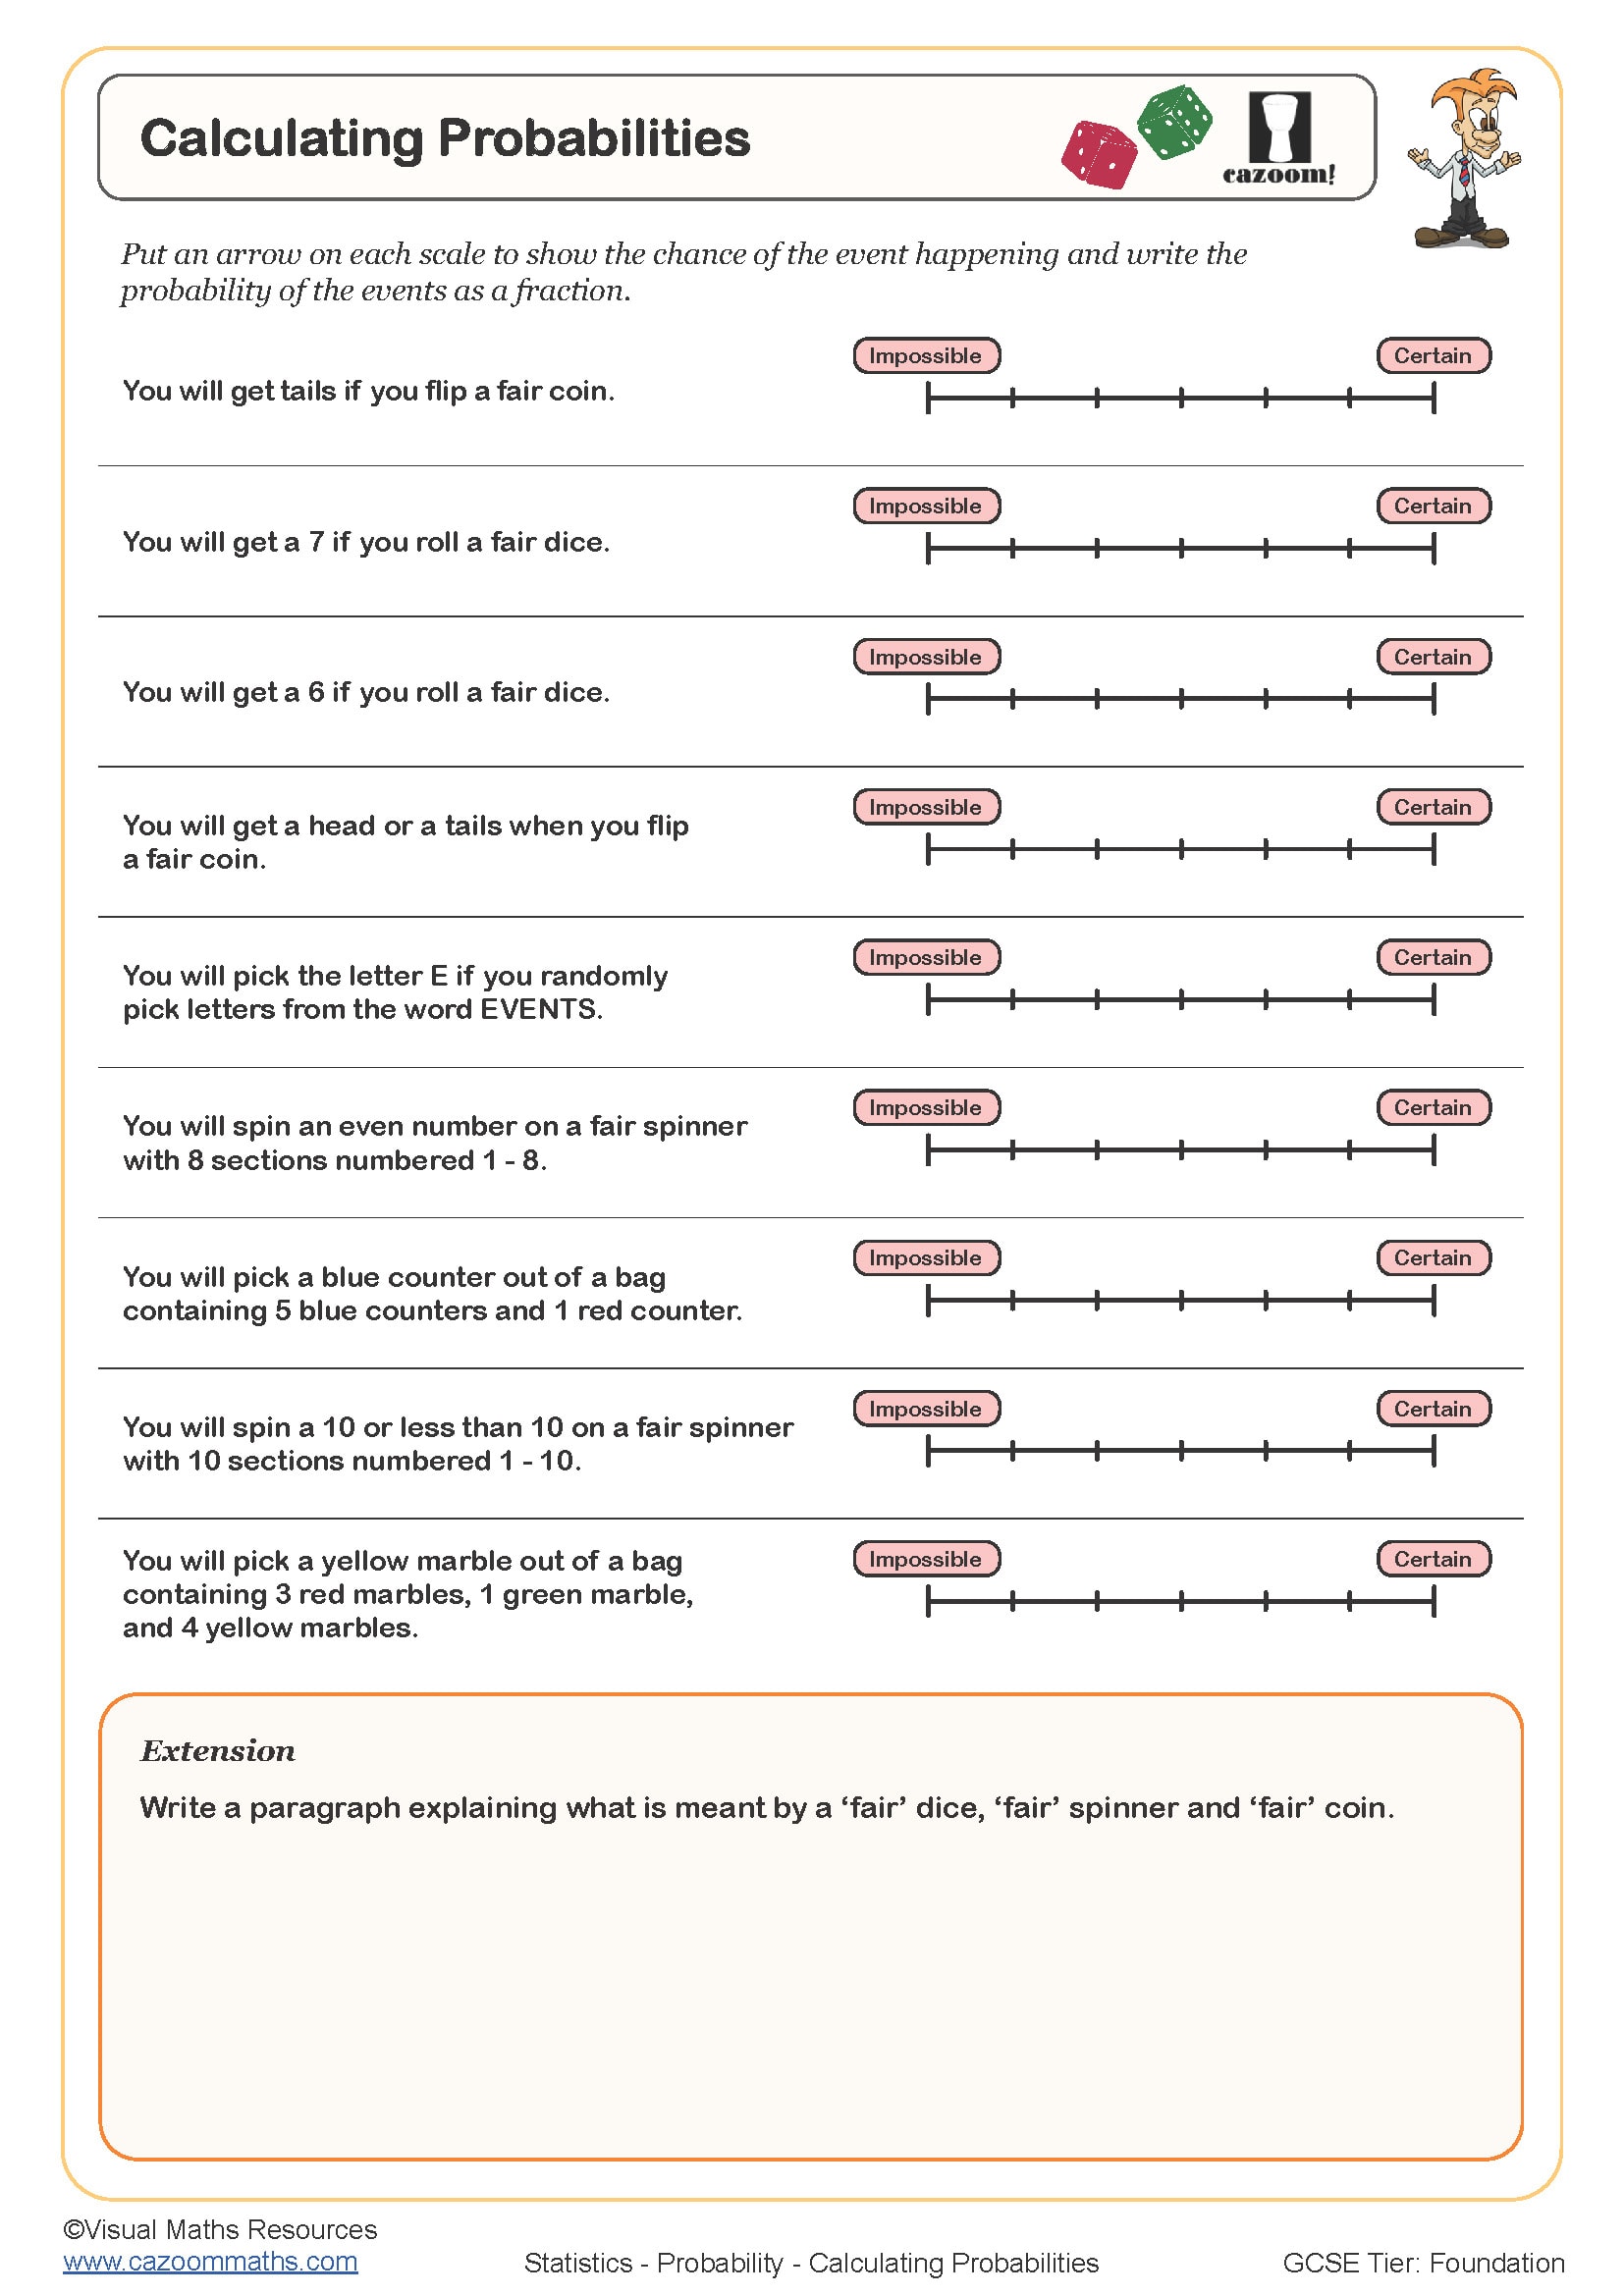
Calculating Probabilities
Year groups: 7
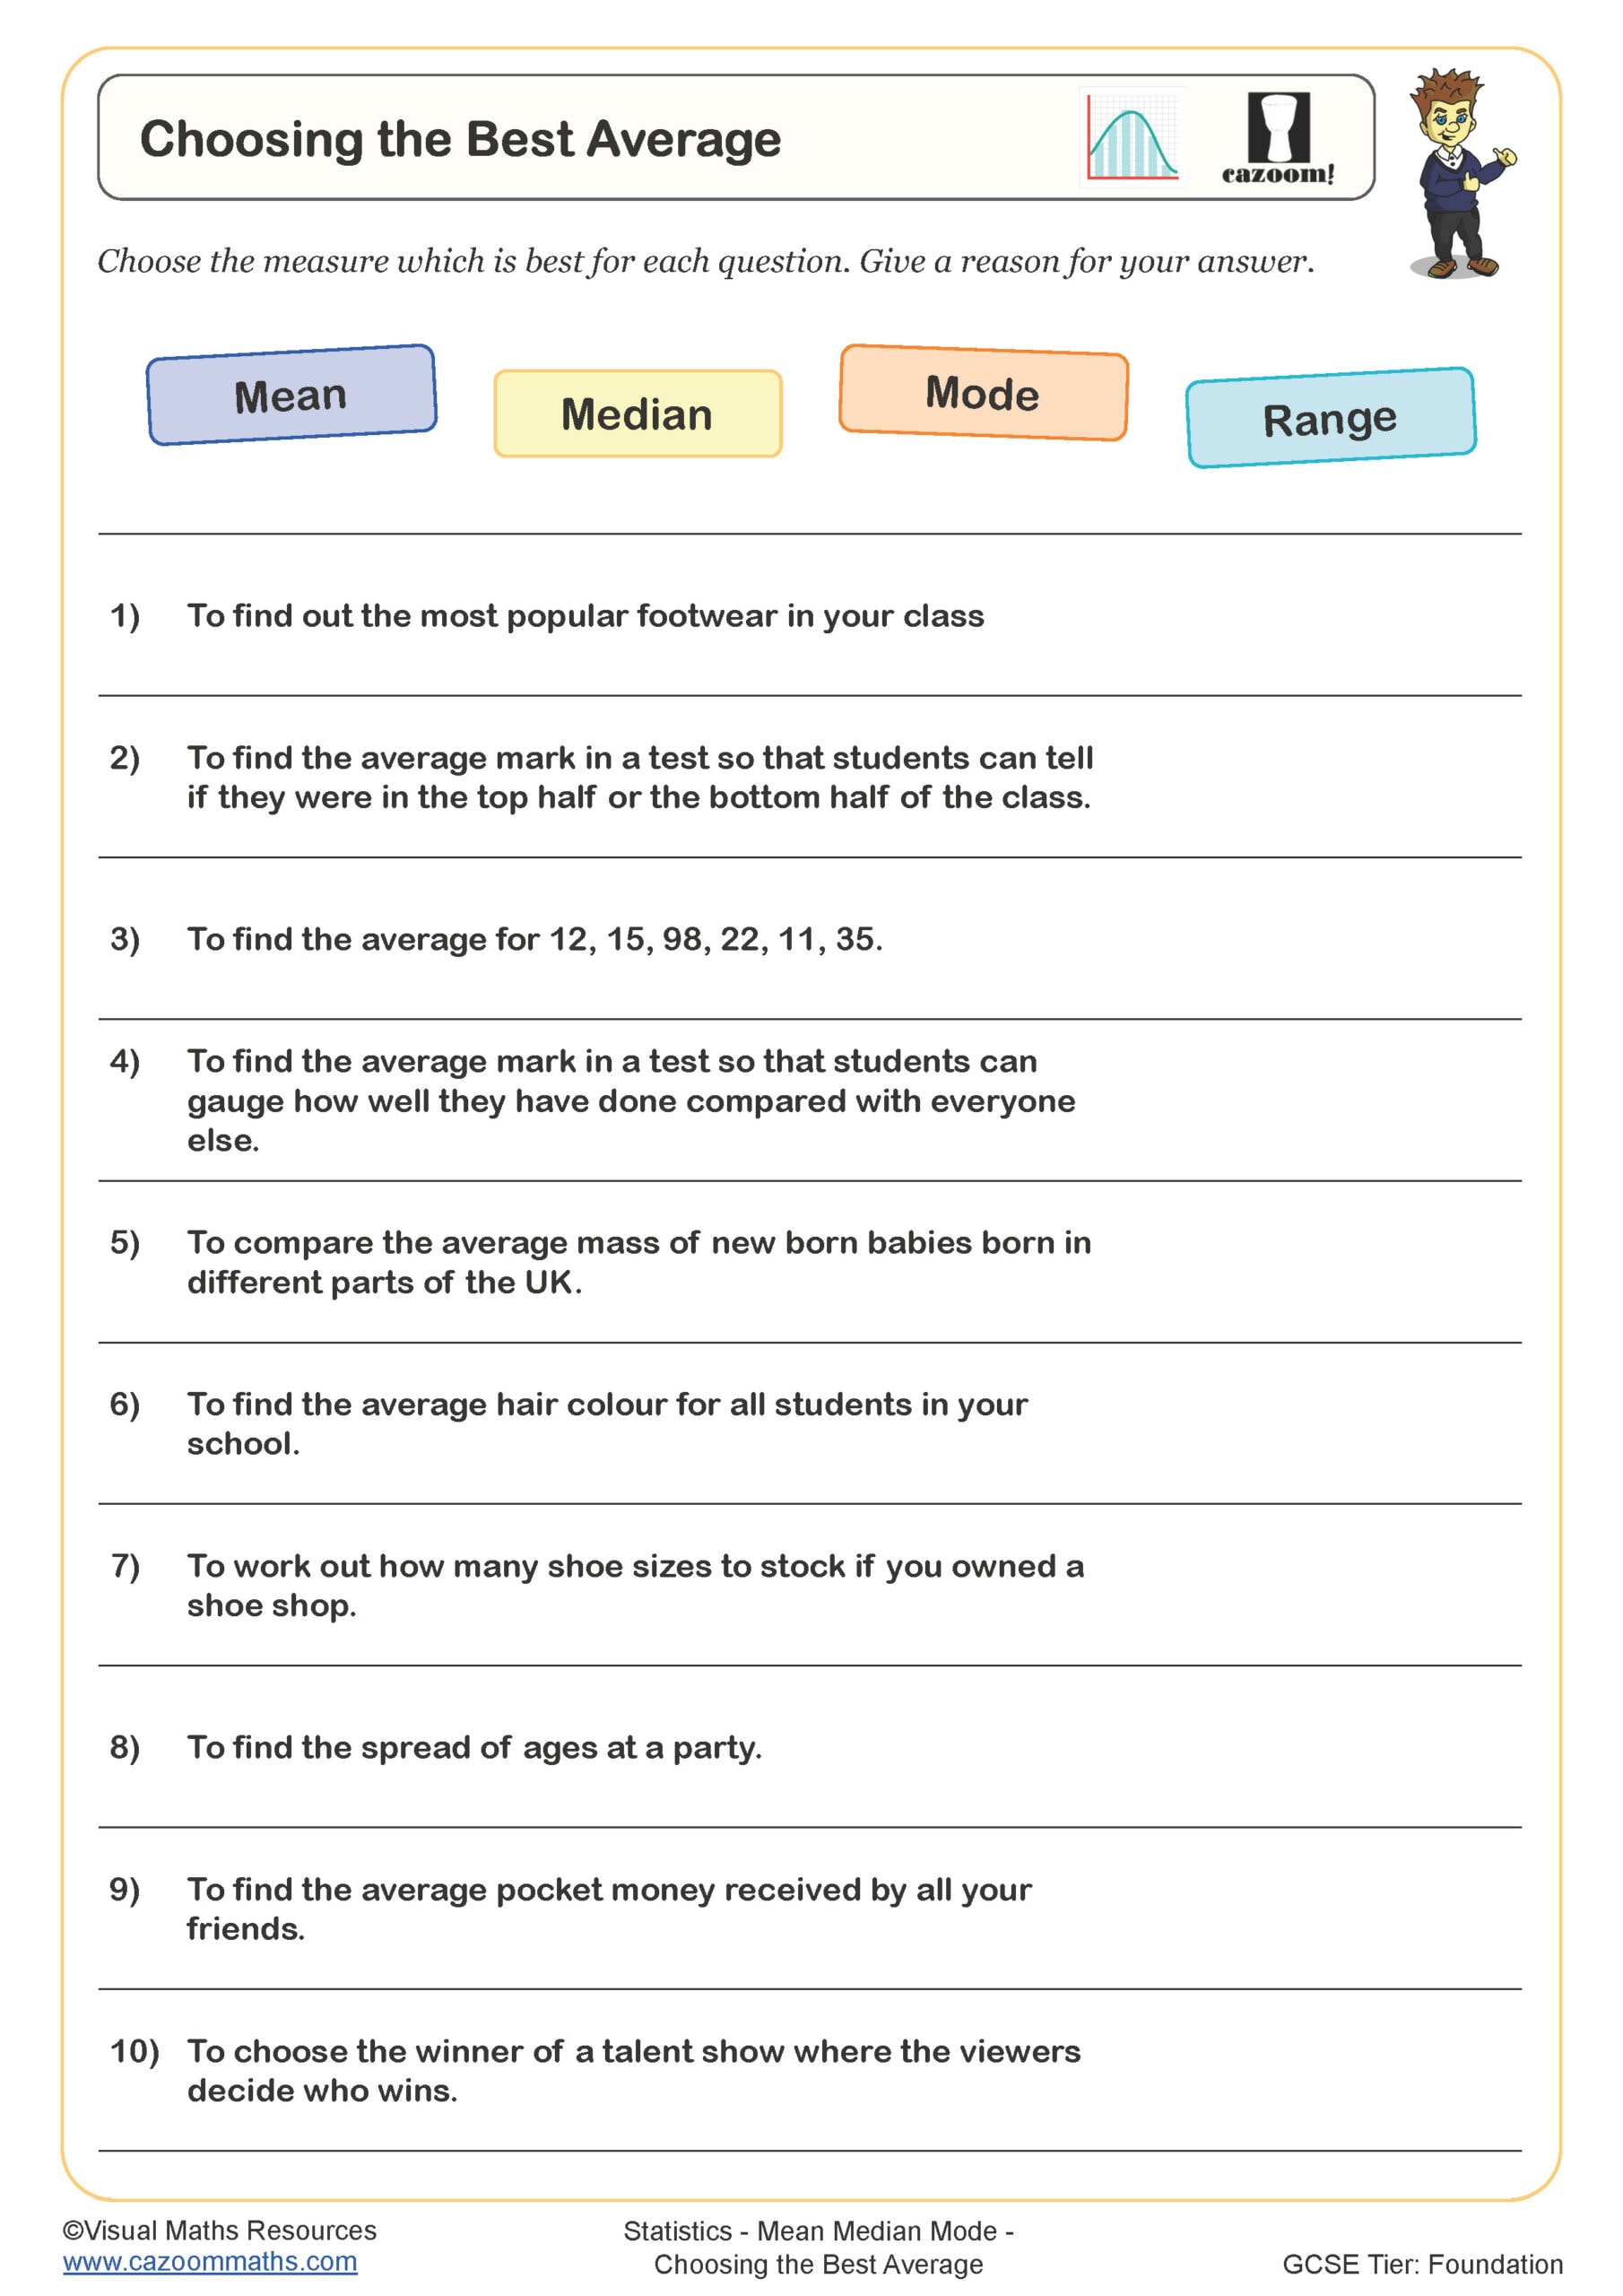
Choosing the Best Average
Year groups: 7, 8
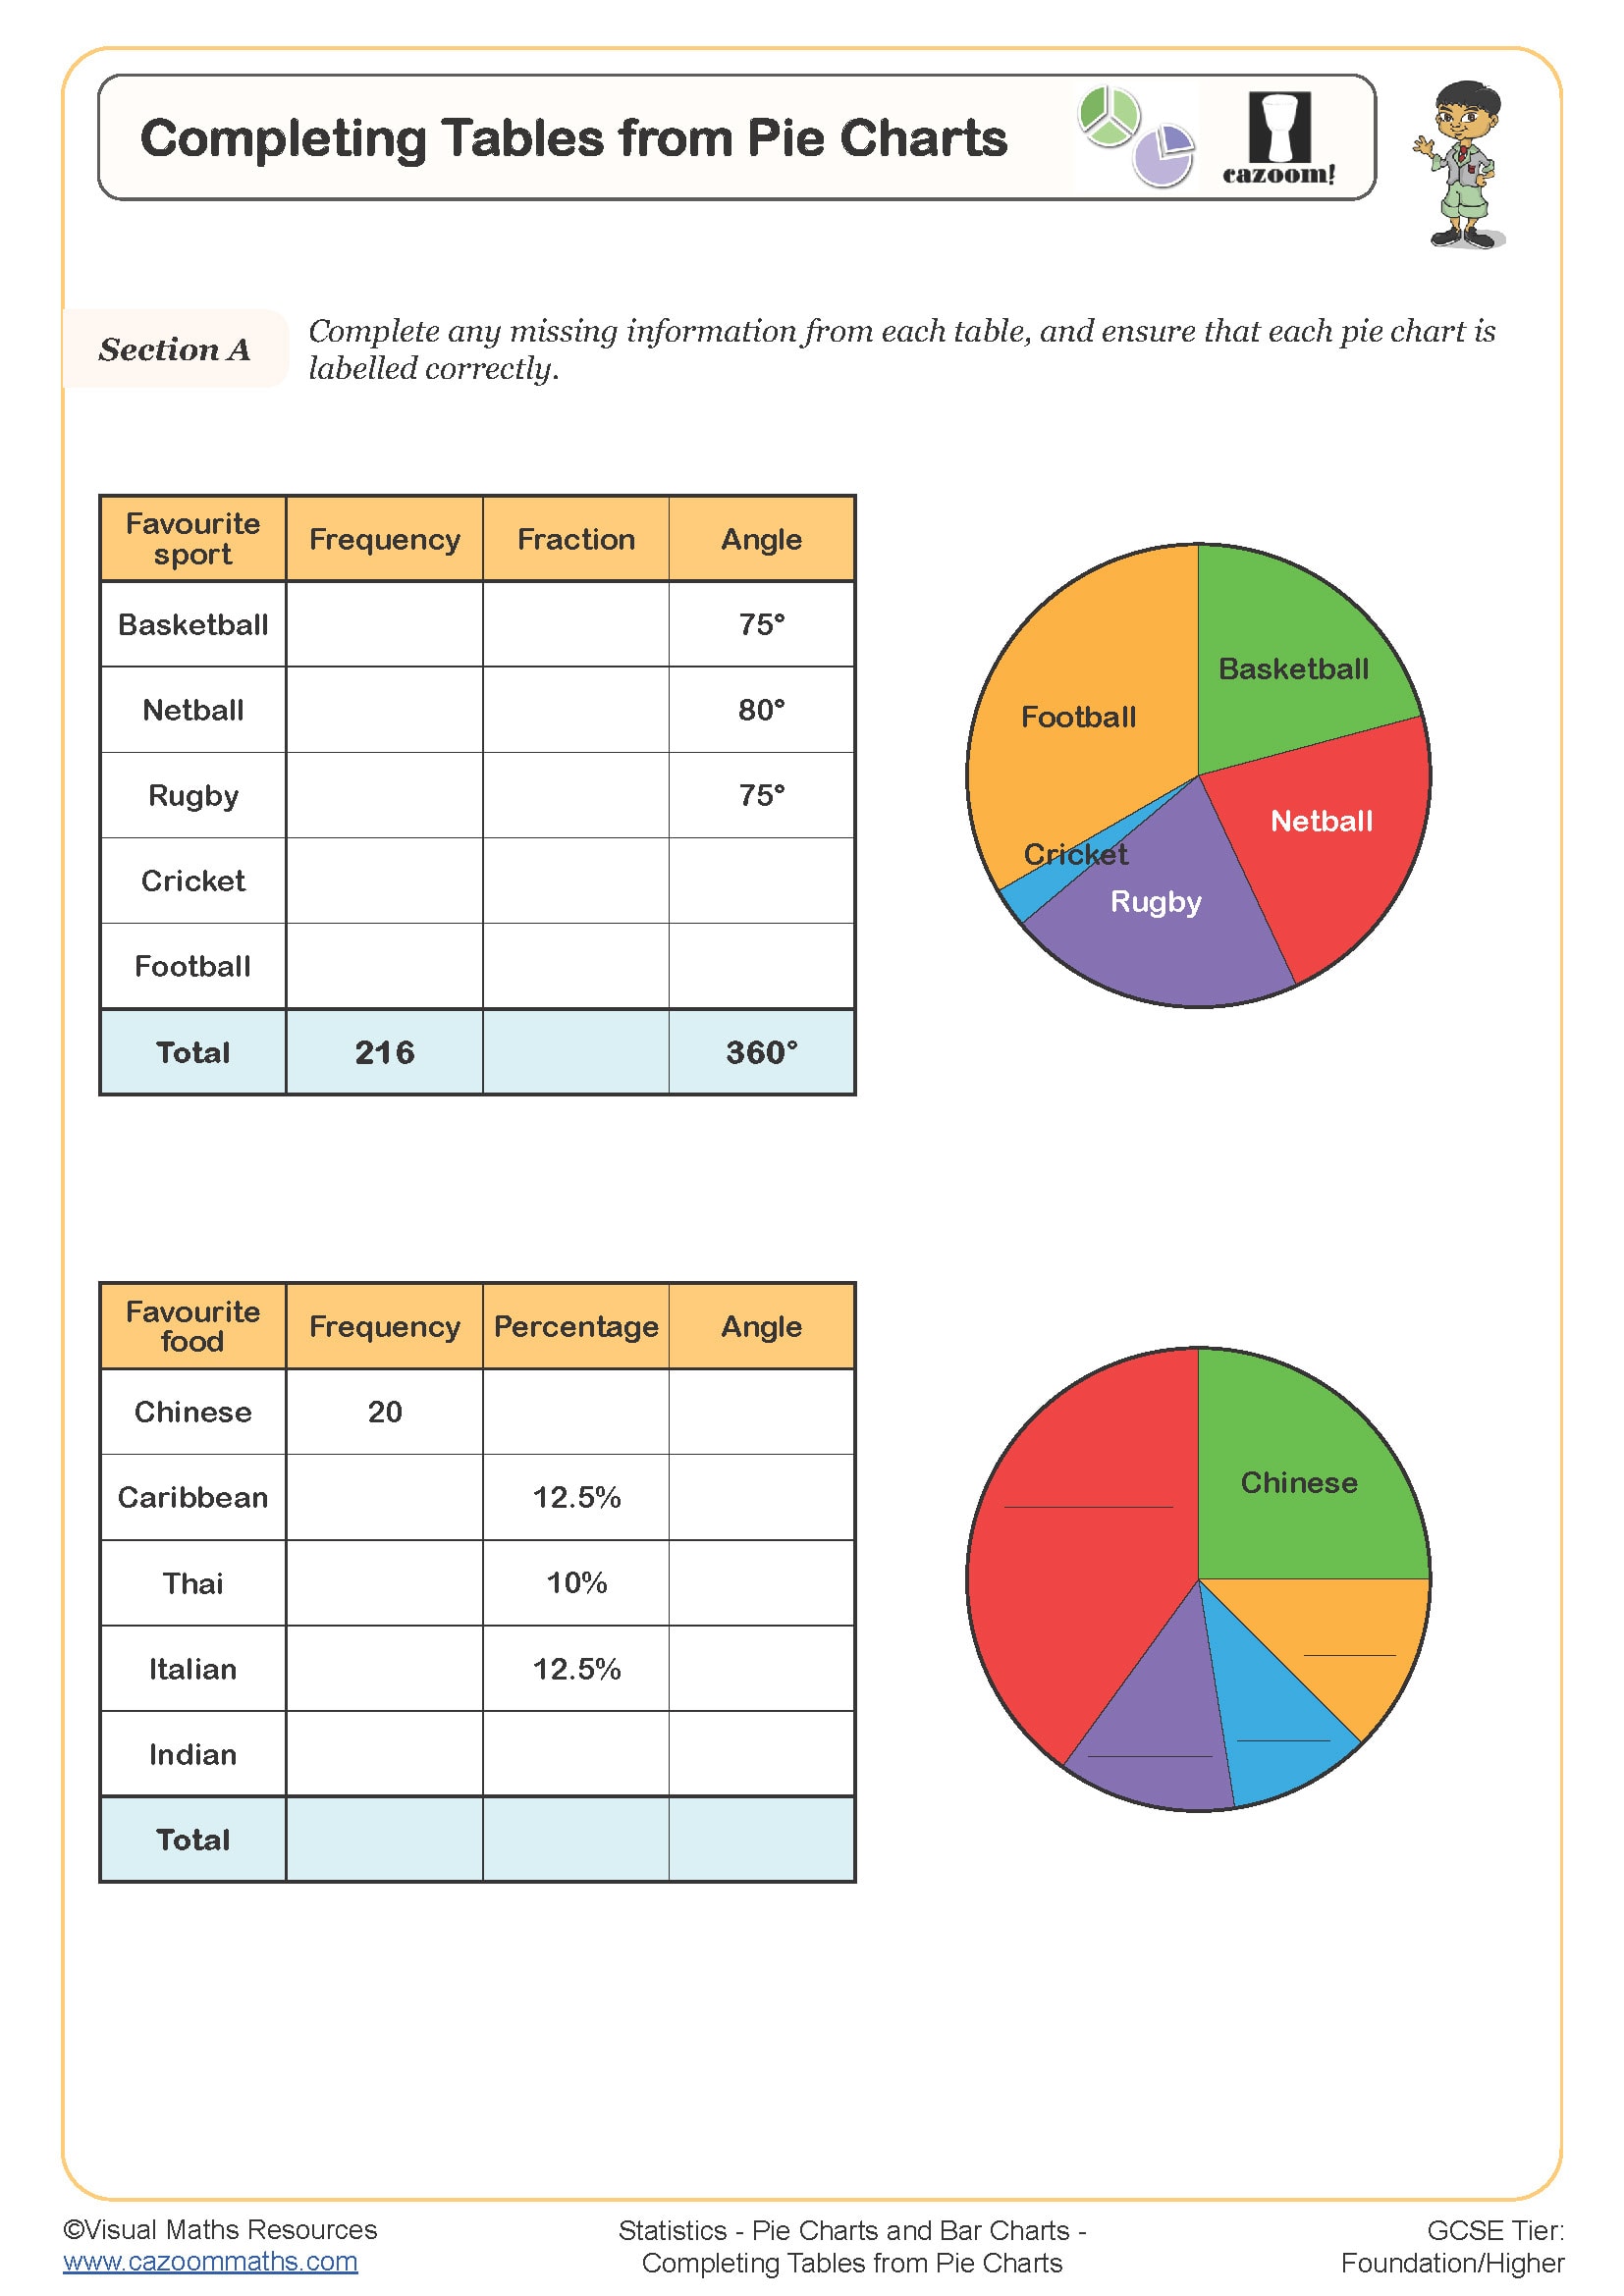
Completing Tables from Pie Charts
Year groups: 7, 8
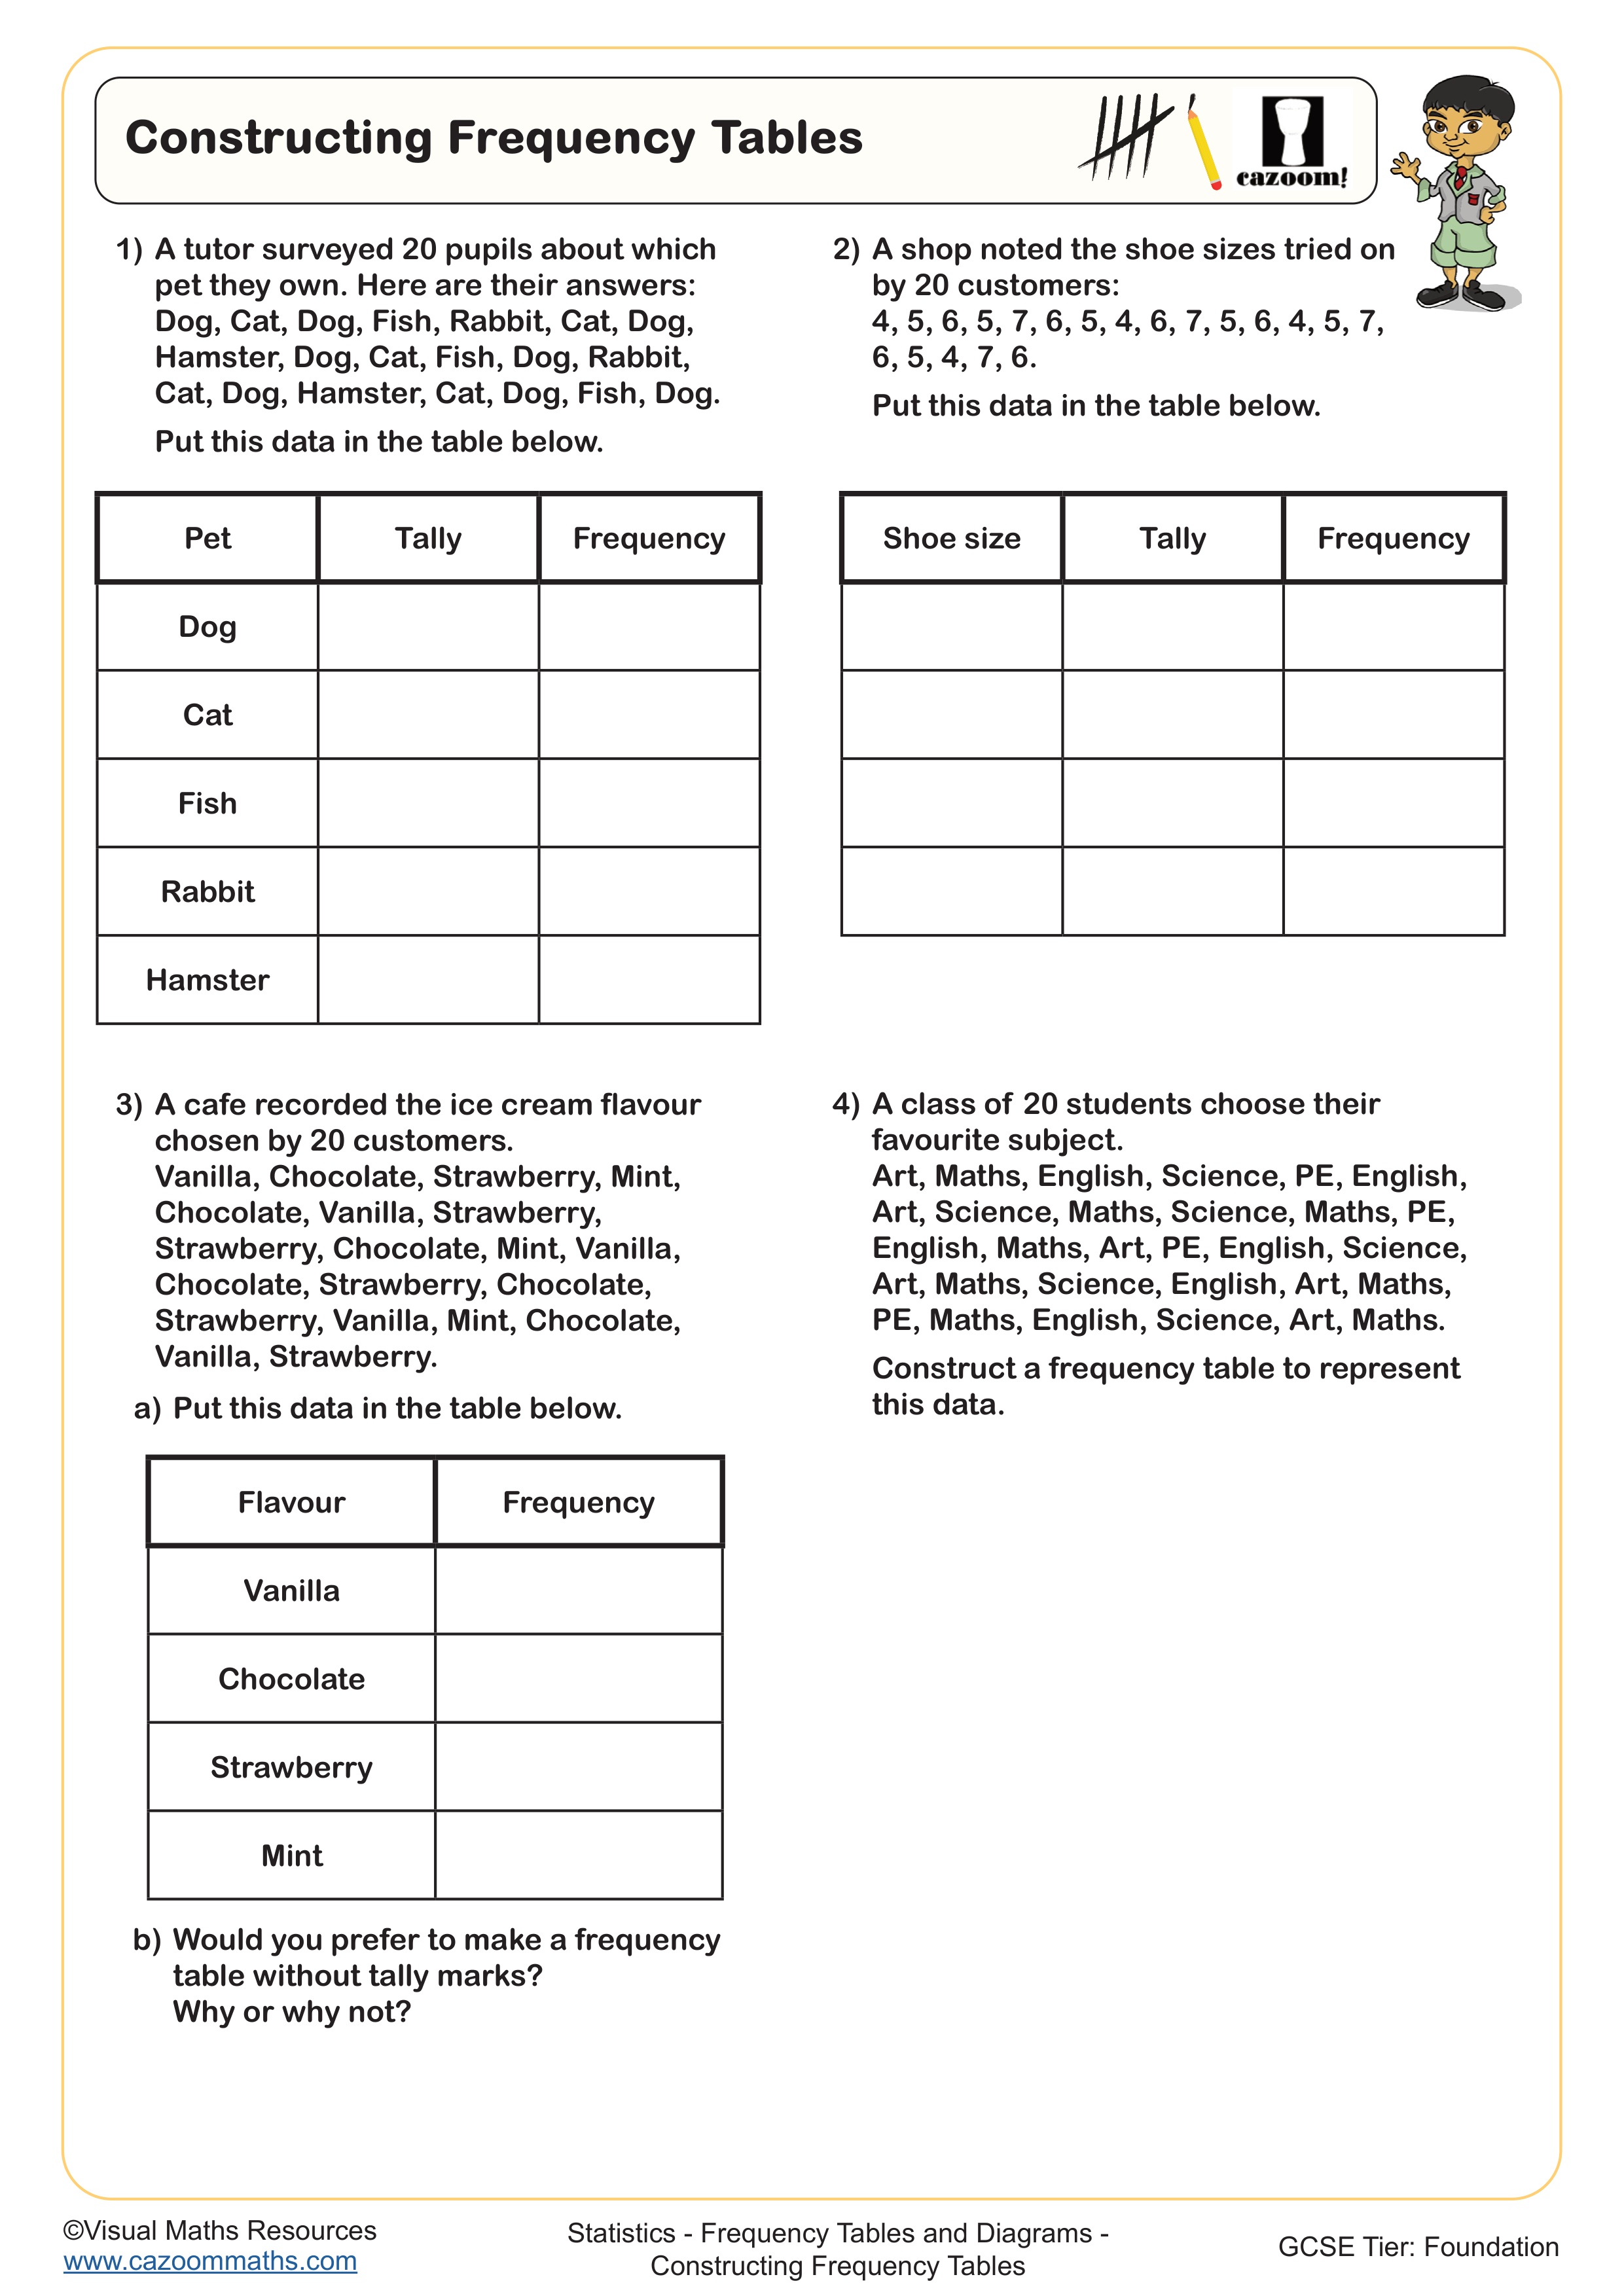
Constructing Frequency Tables
Year groups: 7, 8
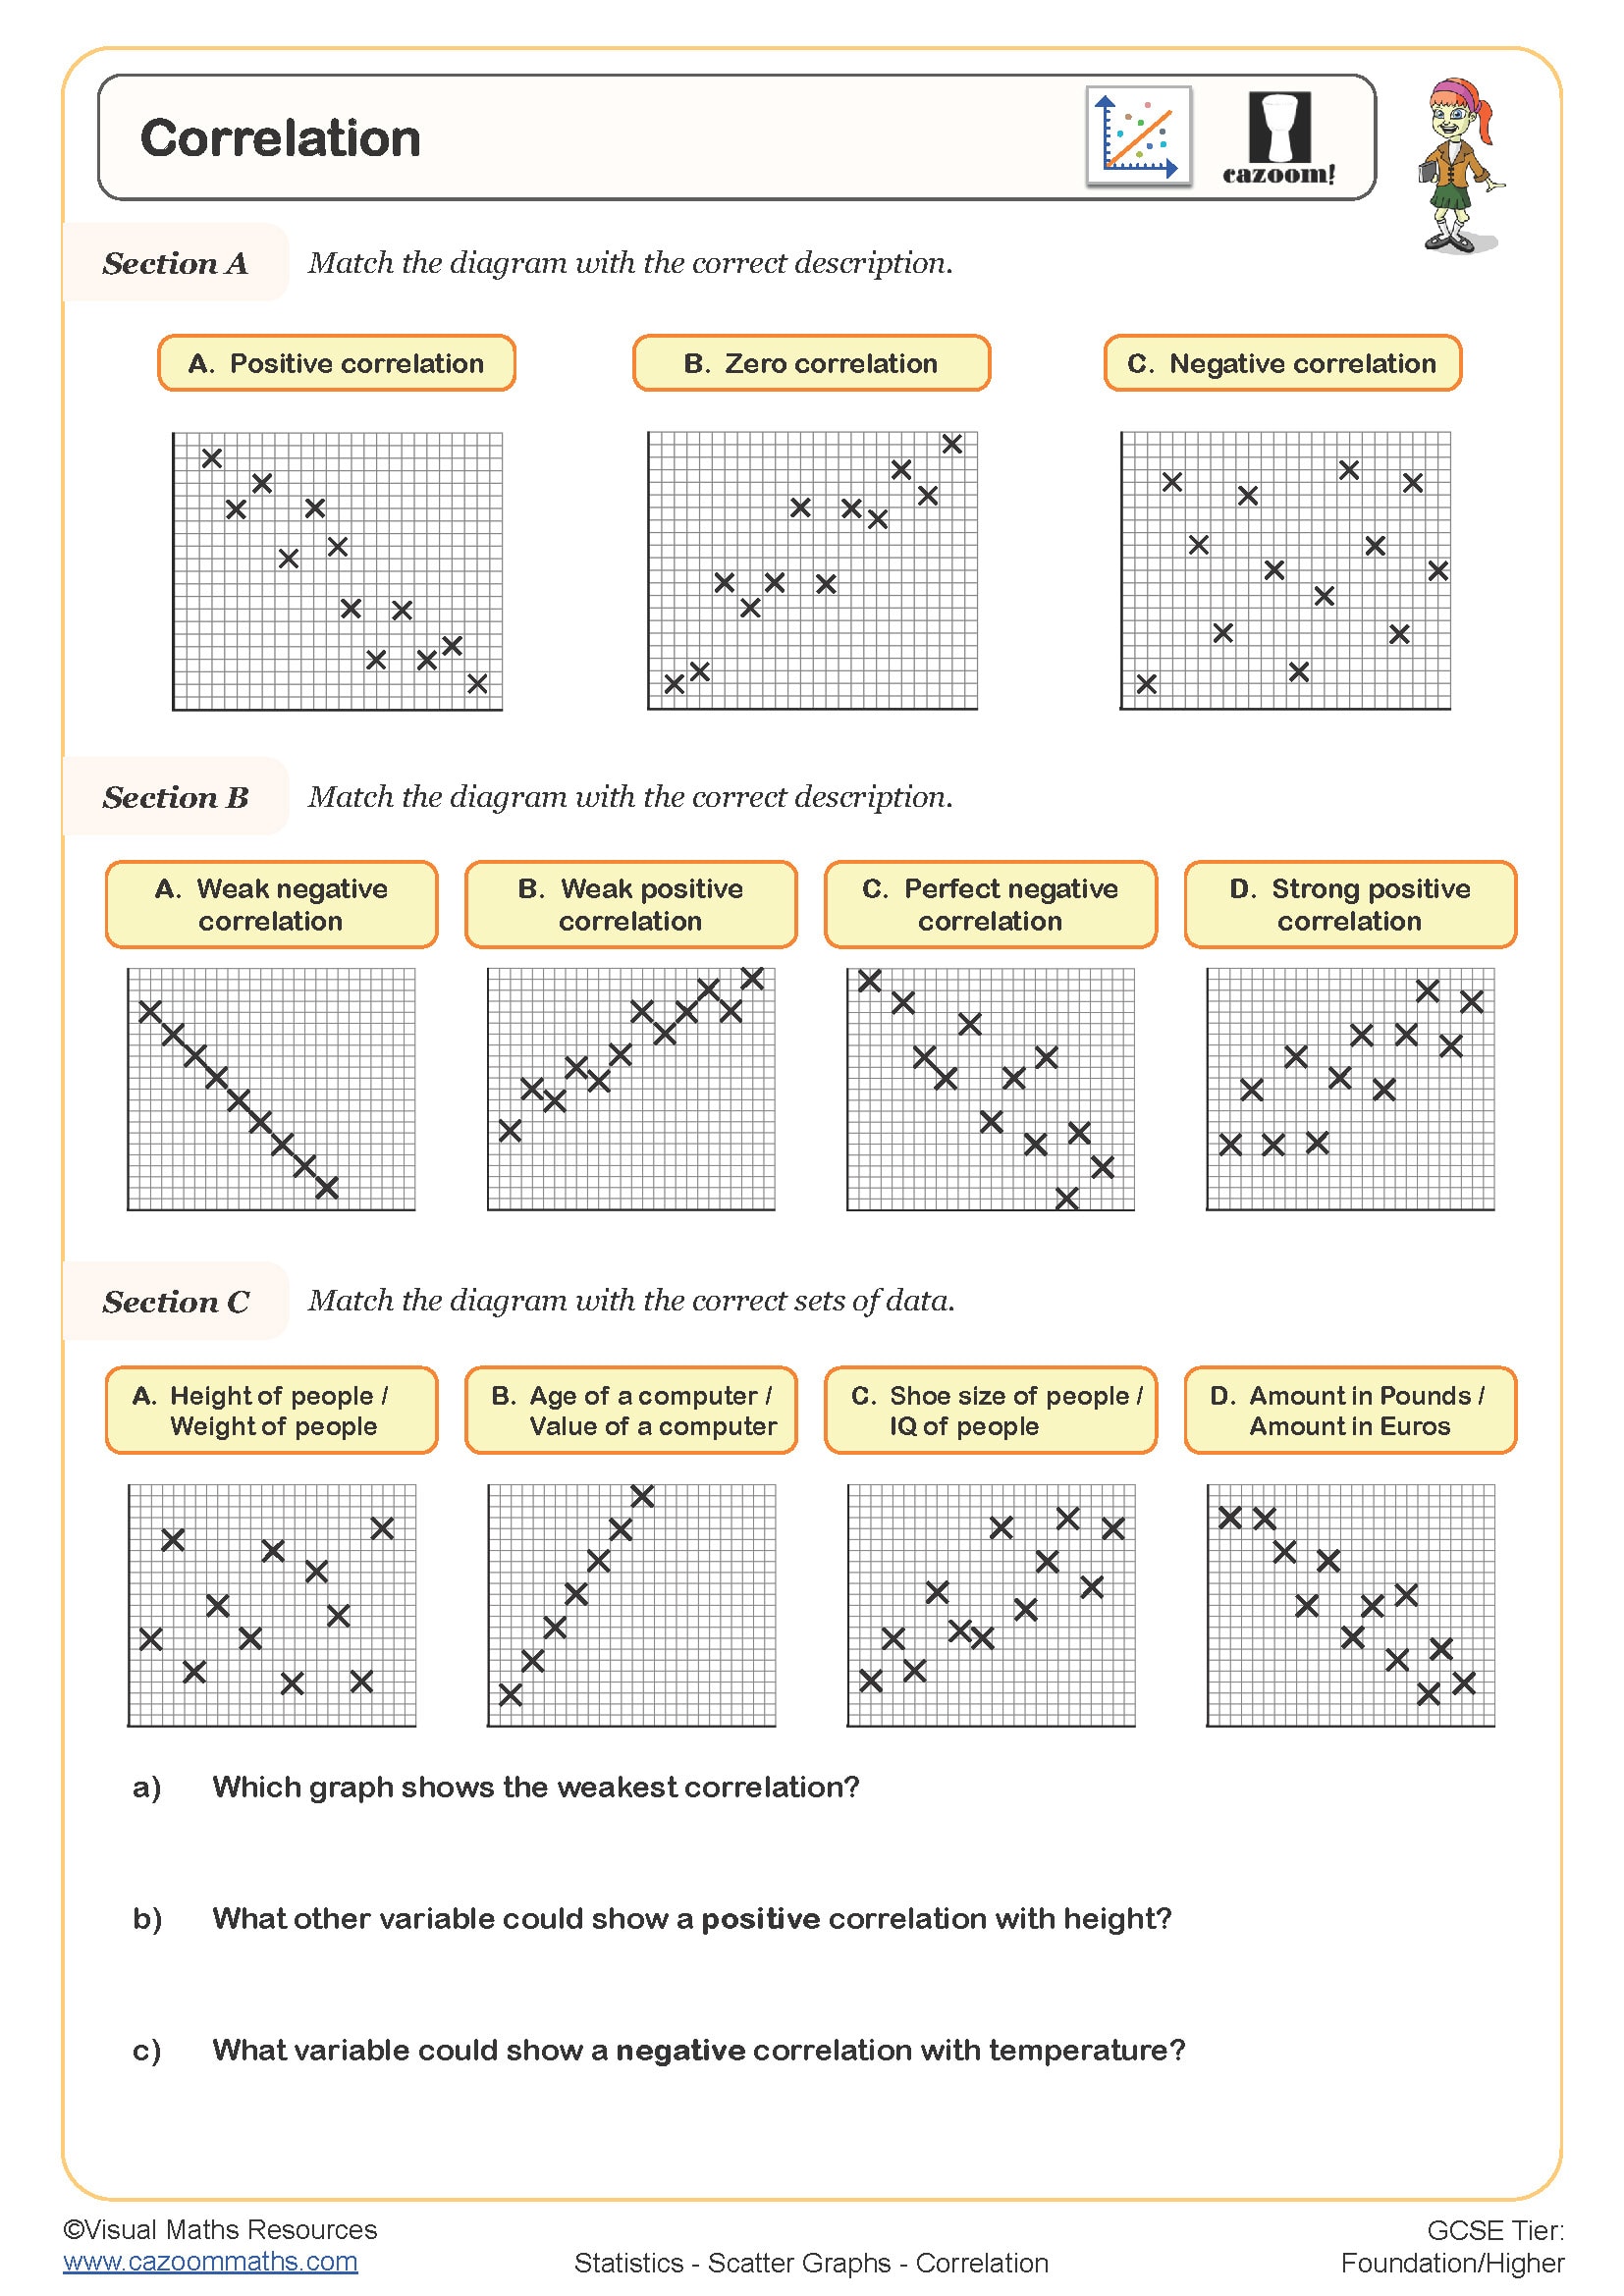
Correlation
Year groups: 7, 8
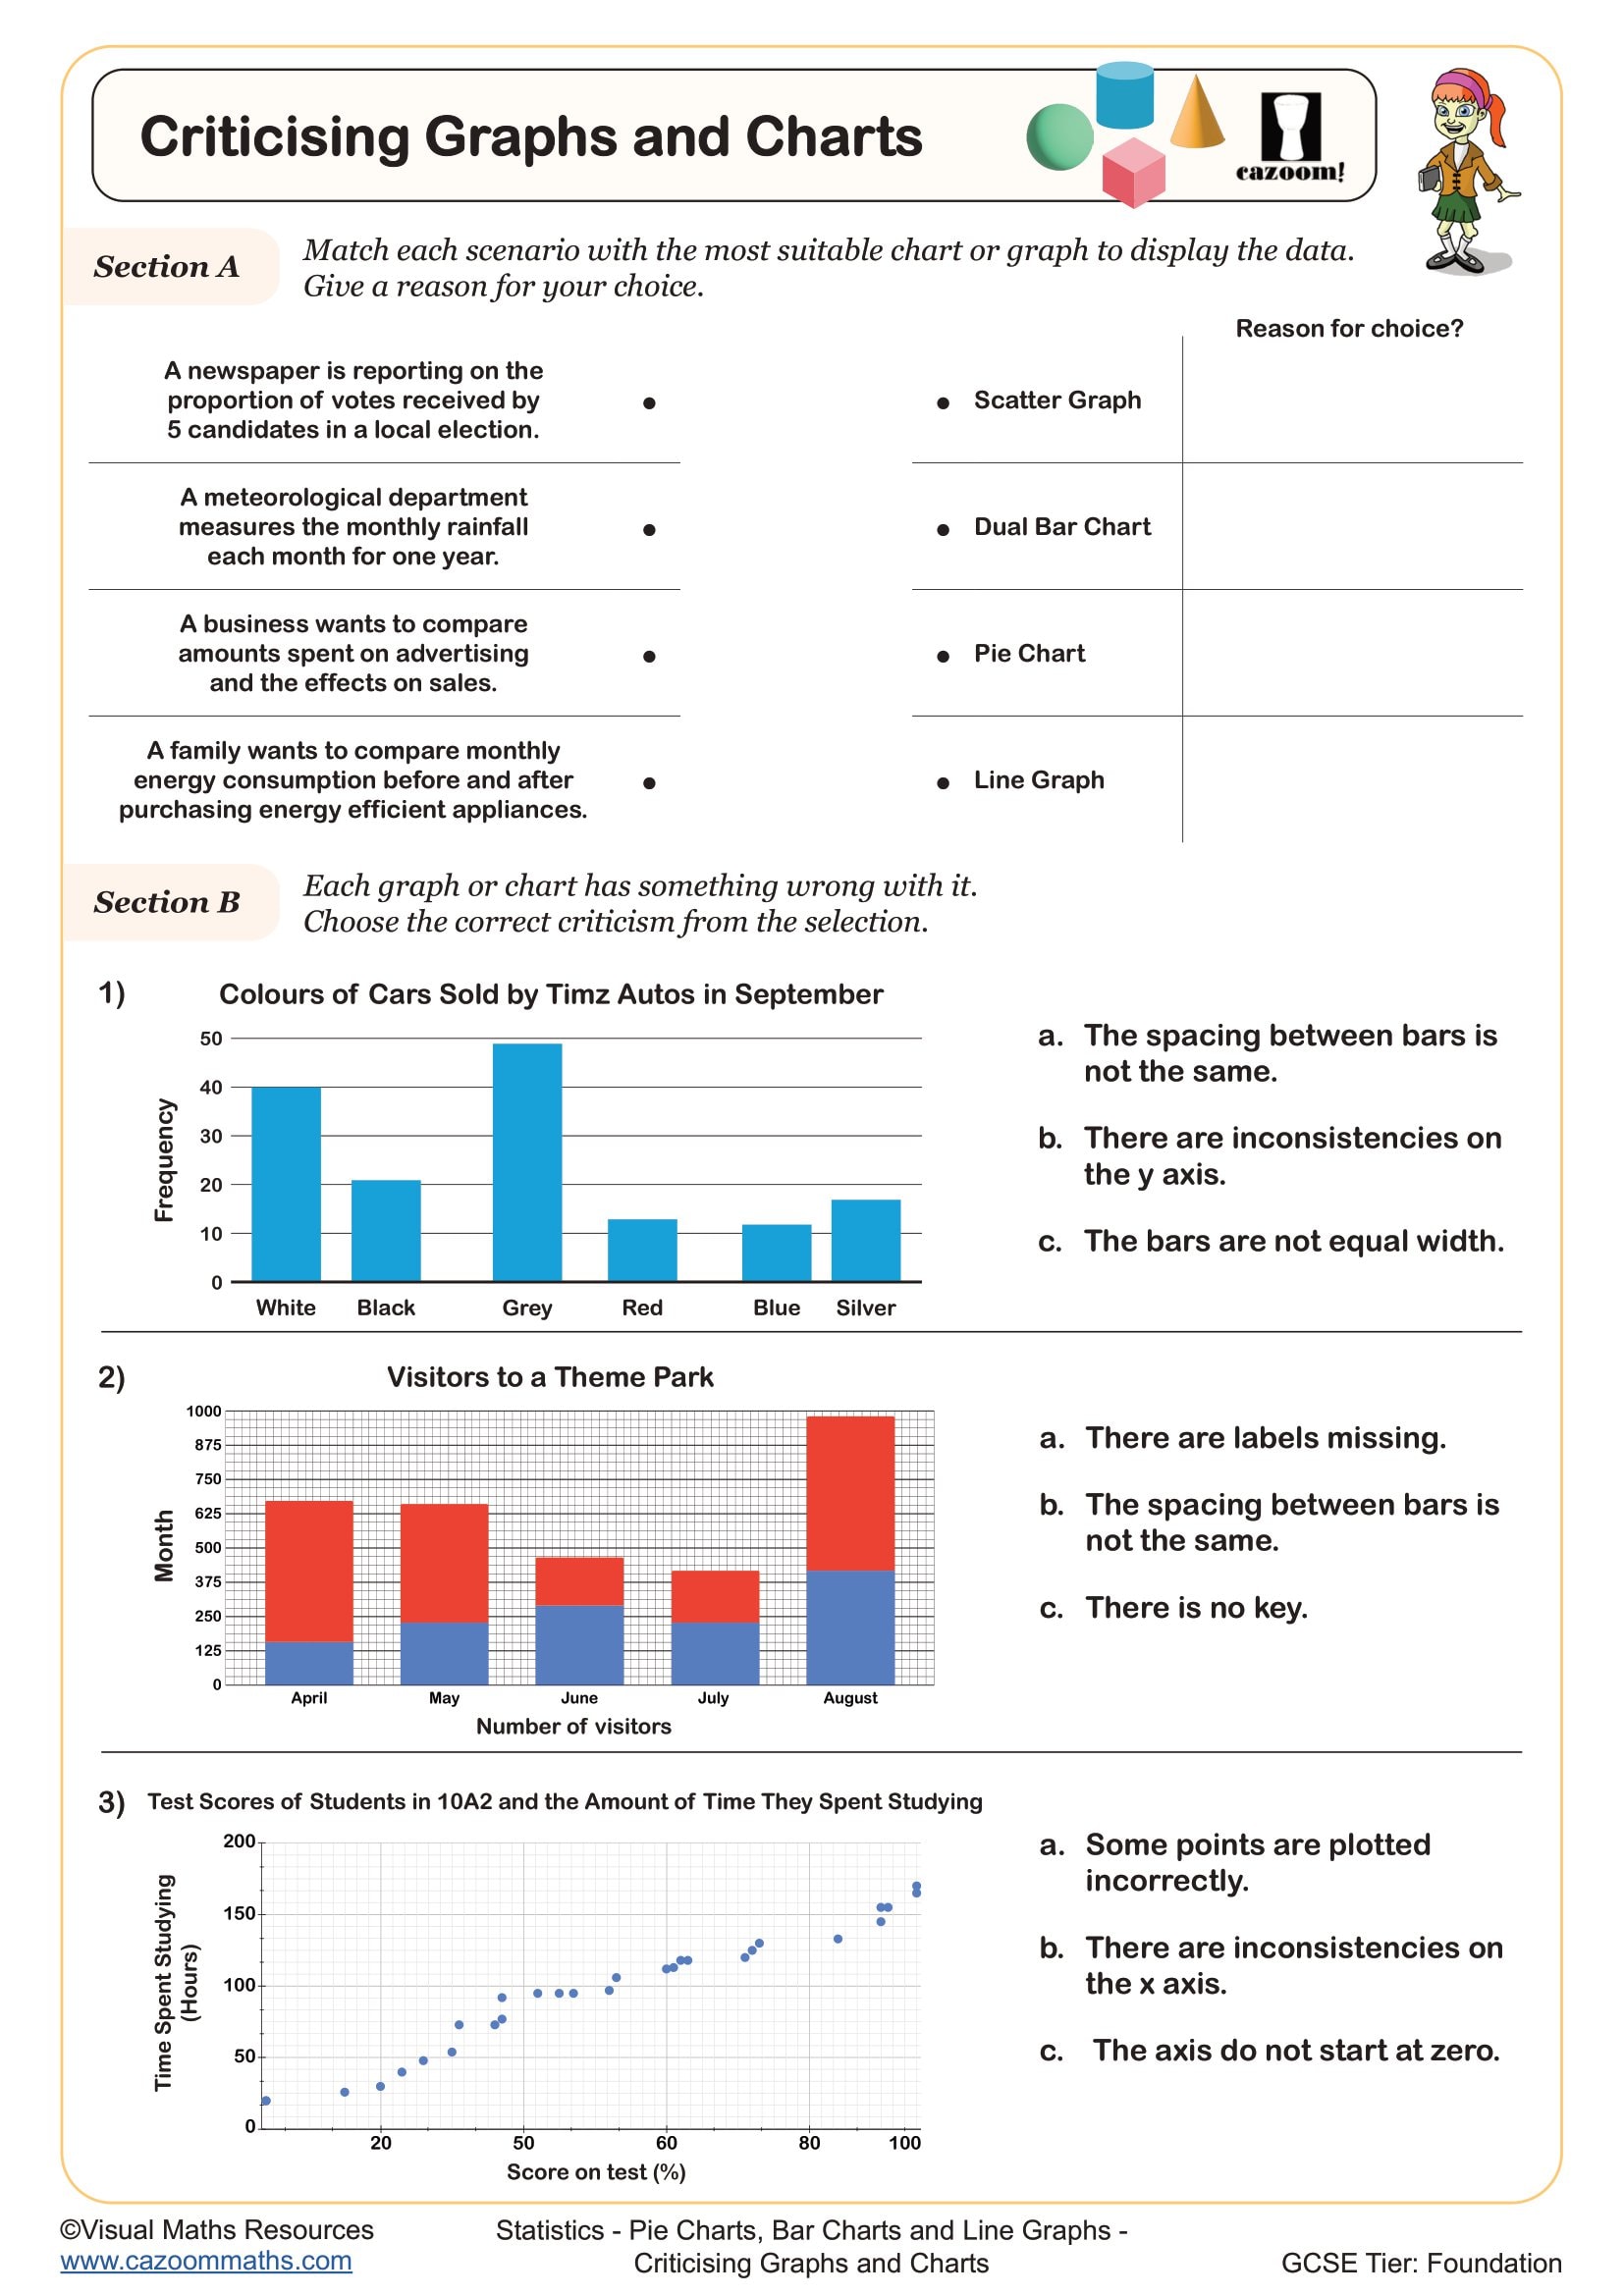
Criticising Graphs and Charts
Year groups: 7, 8
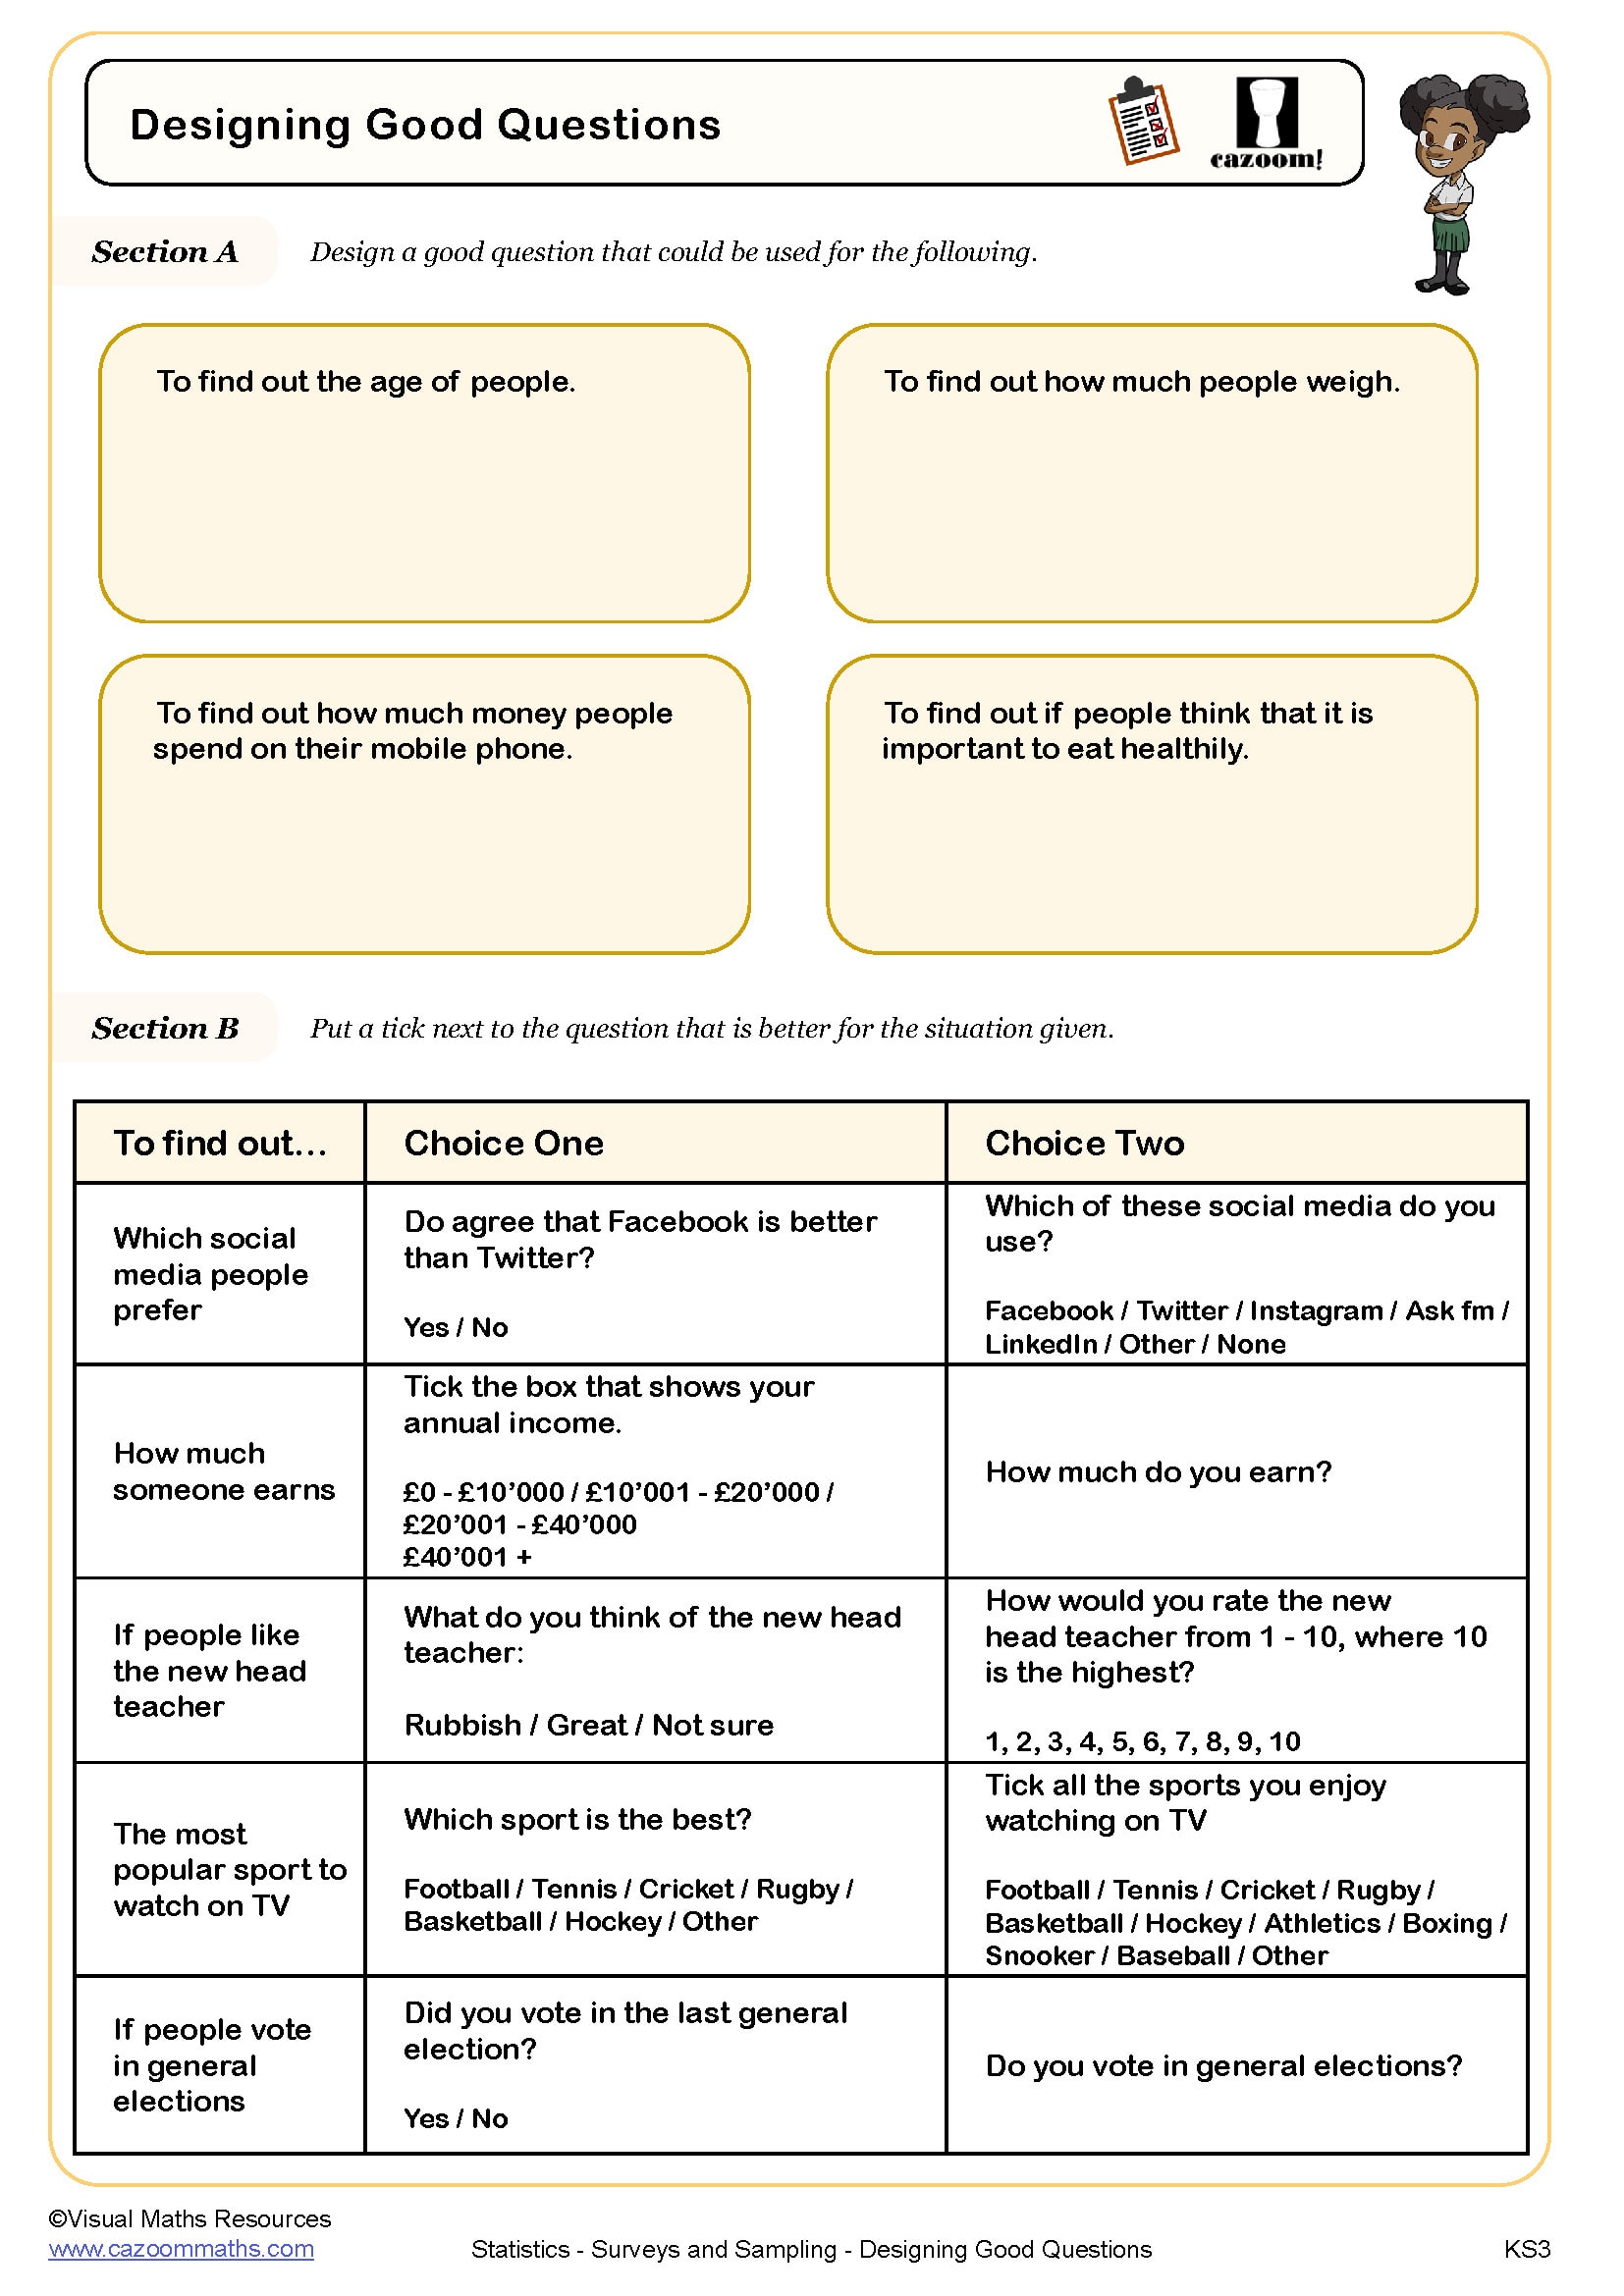
Designing Good Questions
Year groups: 7, 8
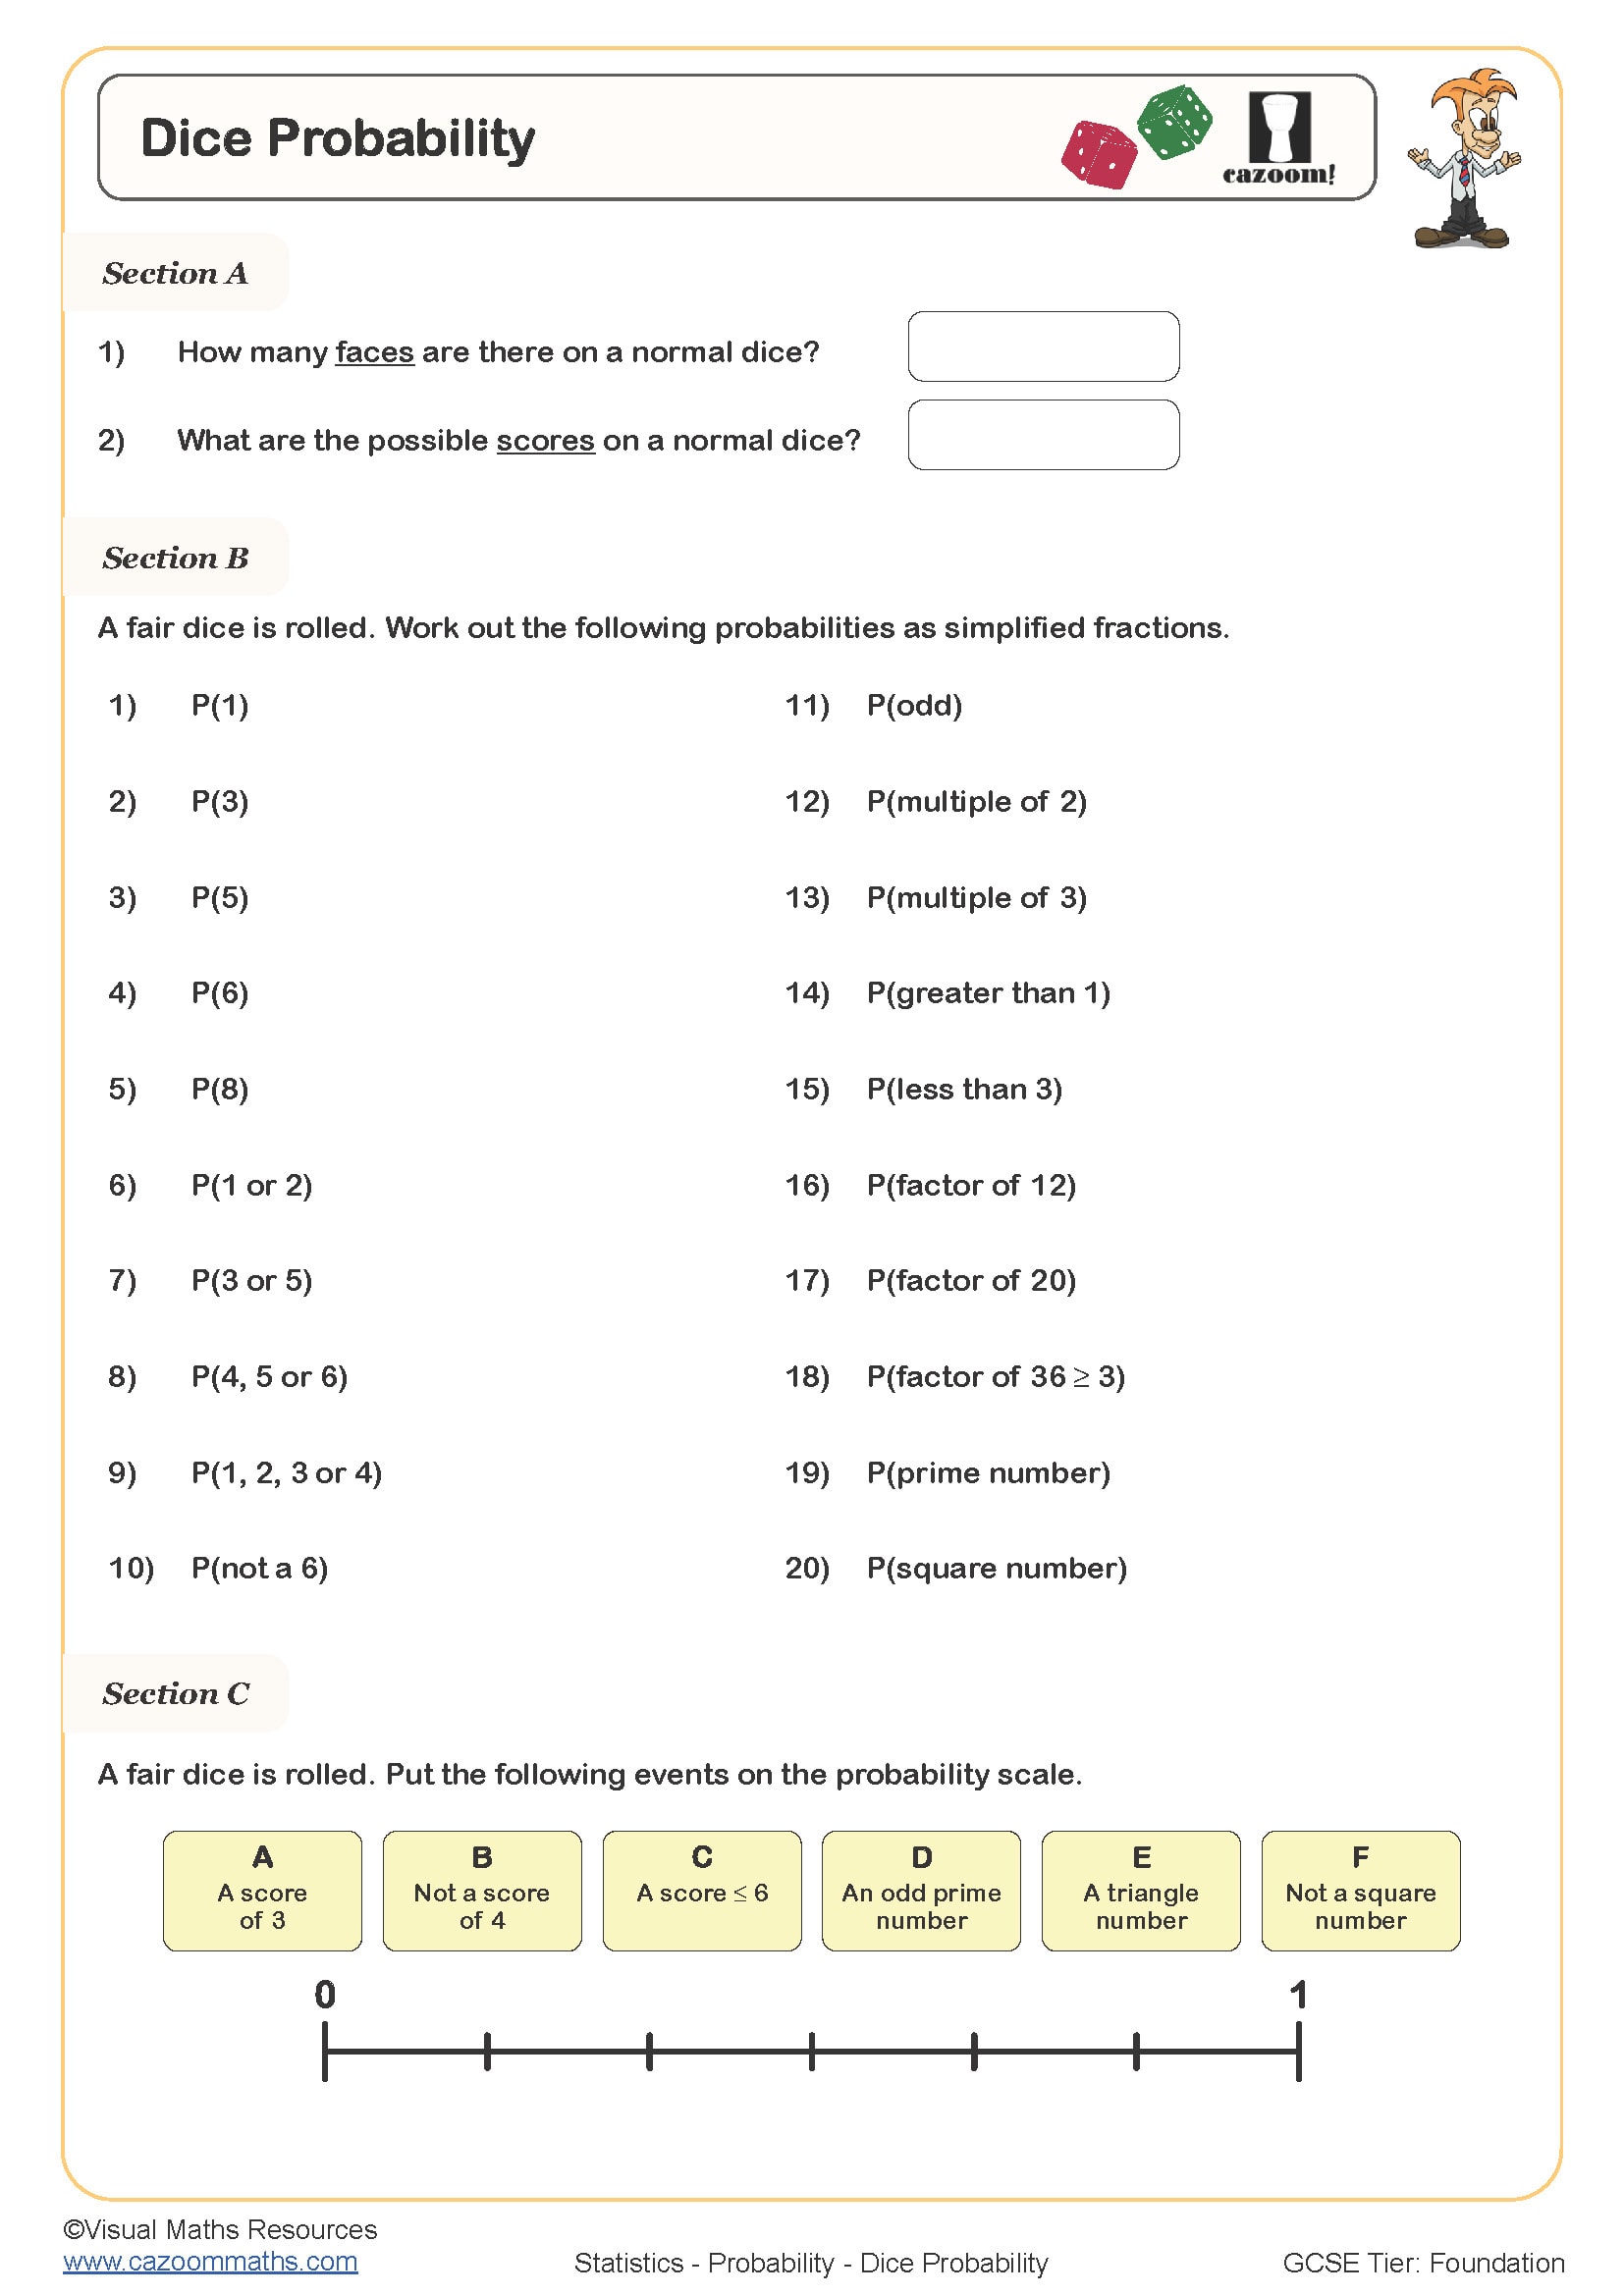
Dice Probability
Year groups: 7, 8
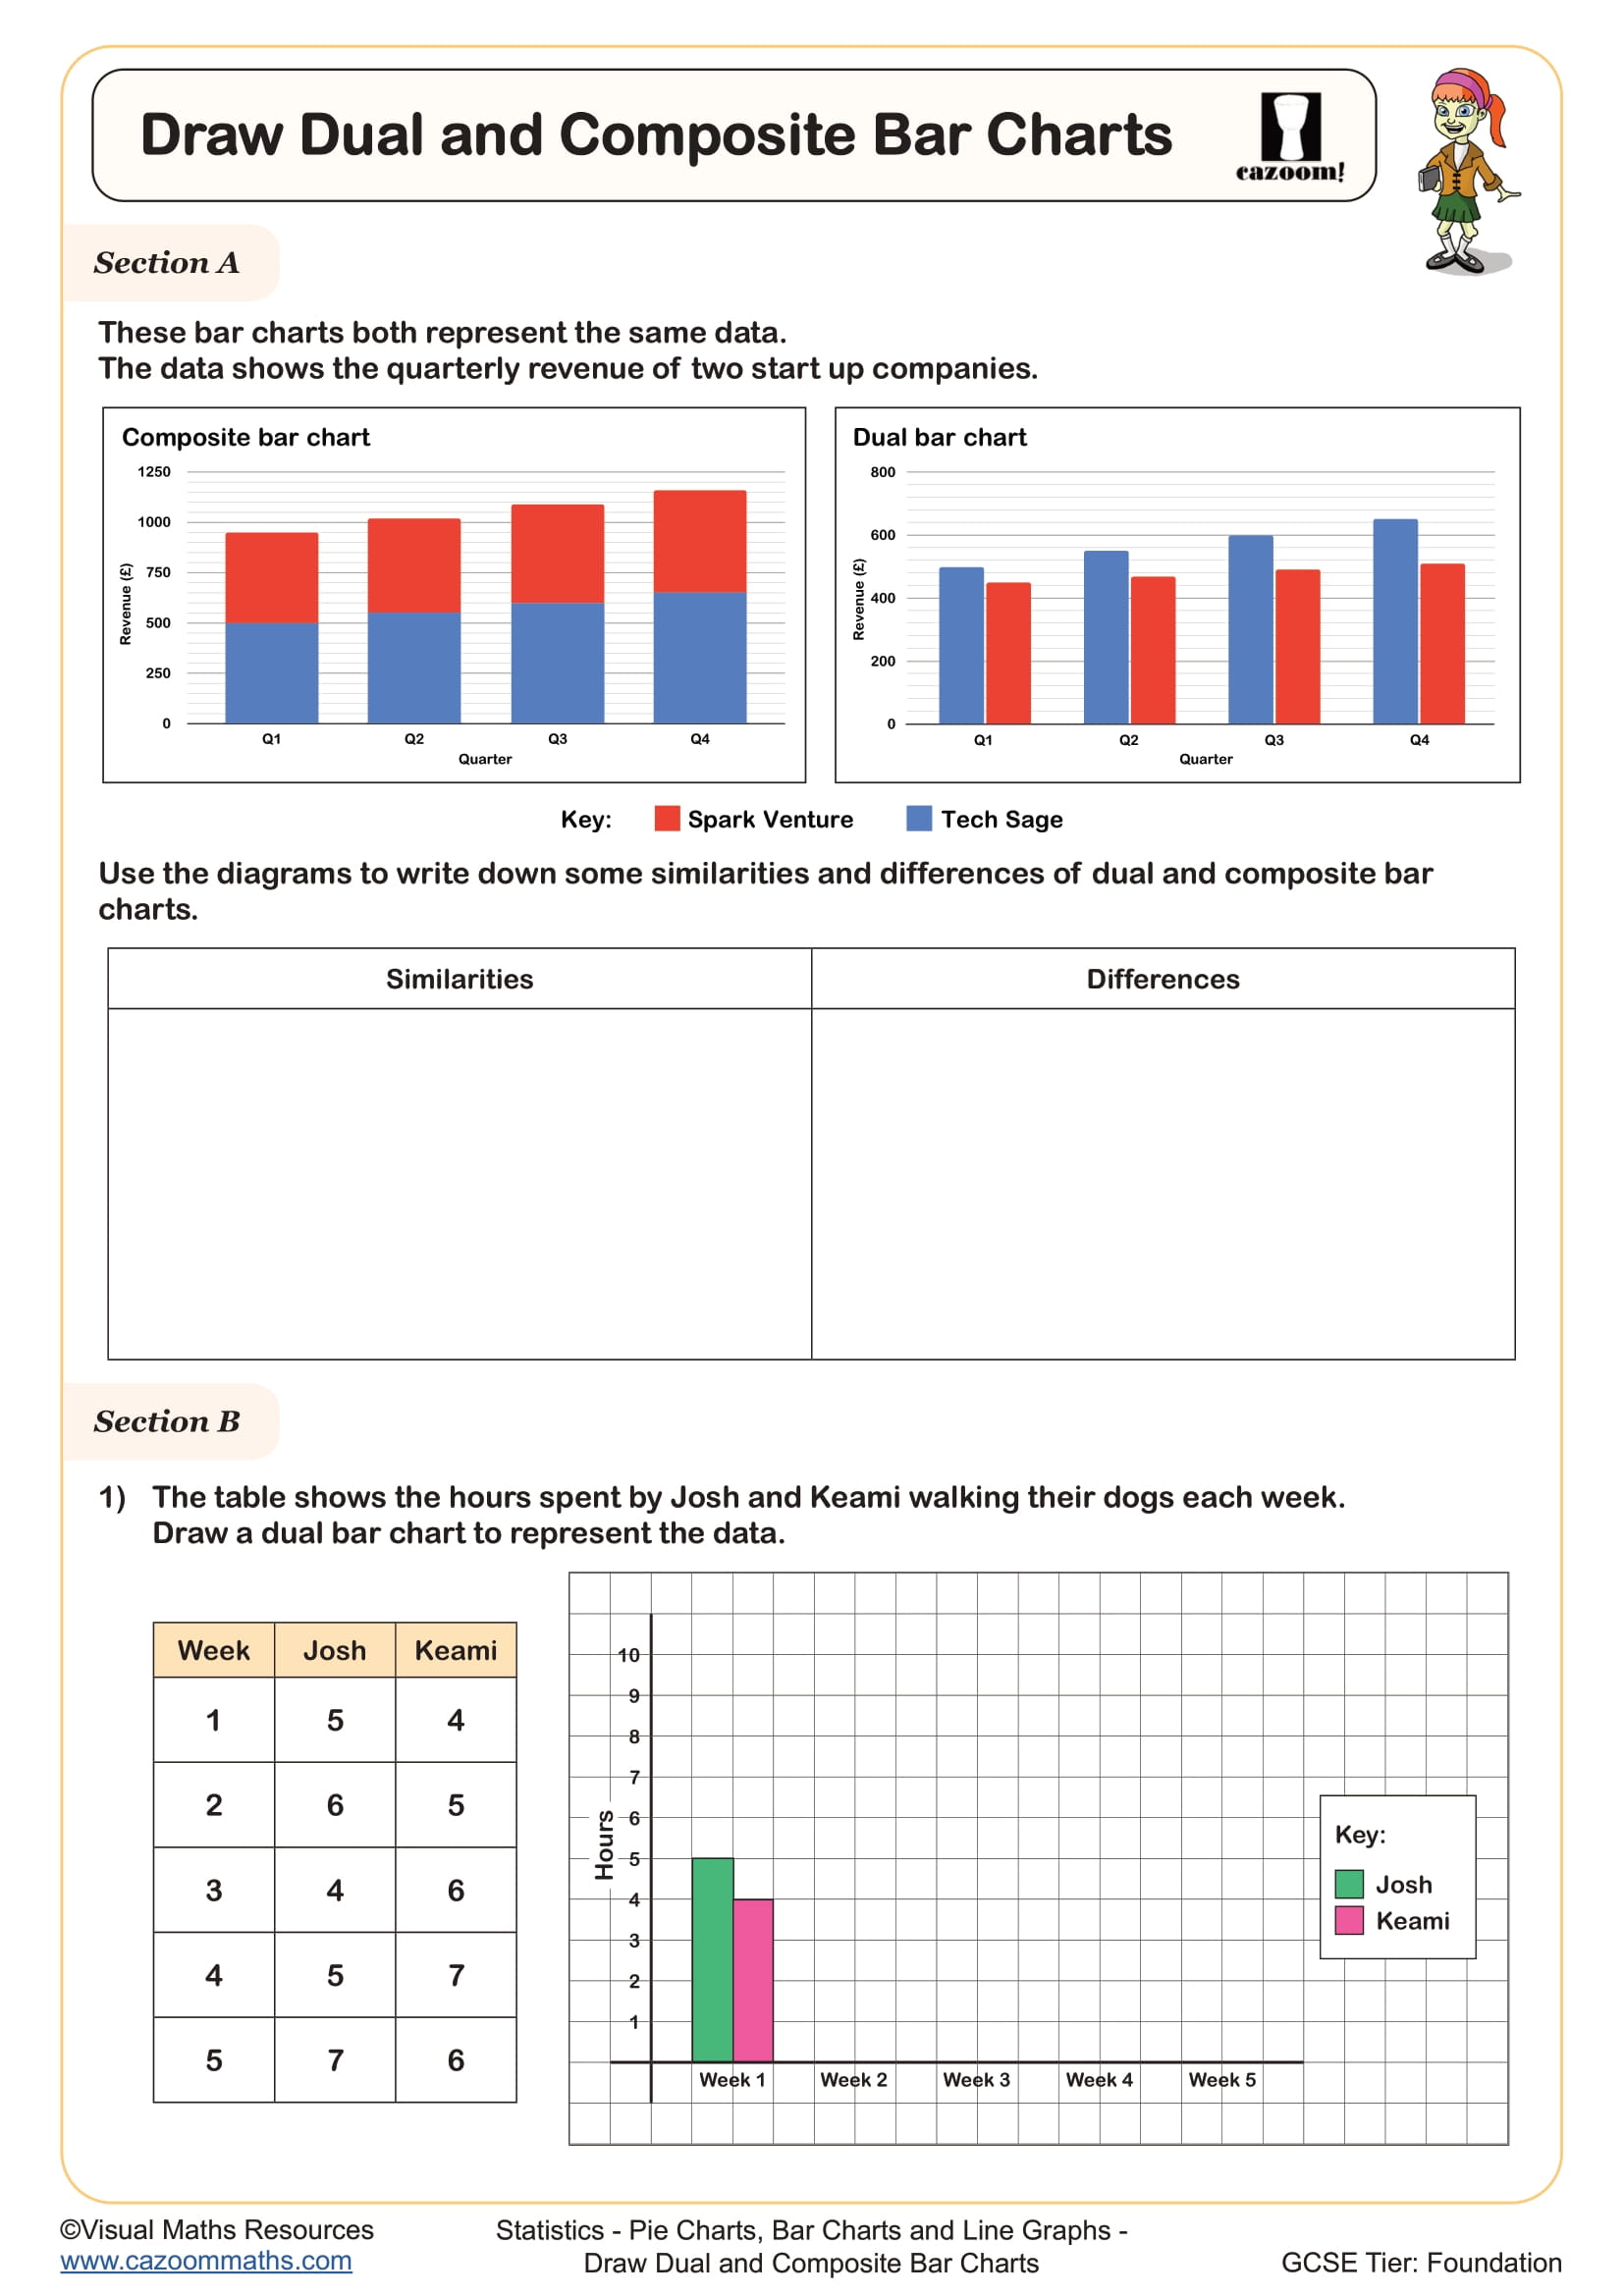
Draw Composite and Dual Bar Charts
Year groups: 7, 8
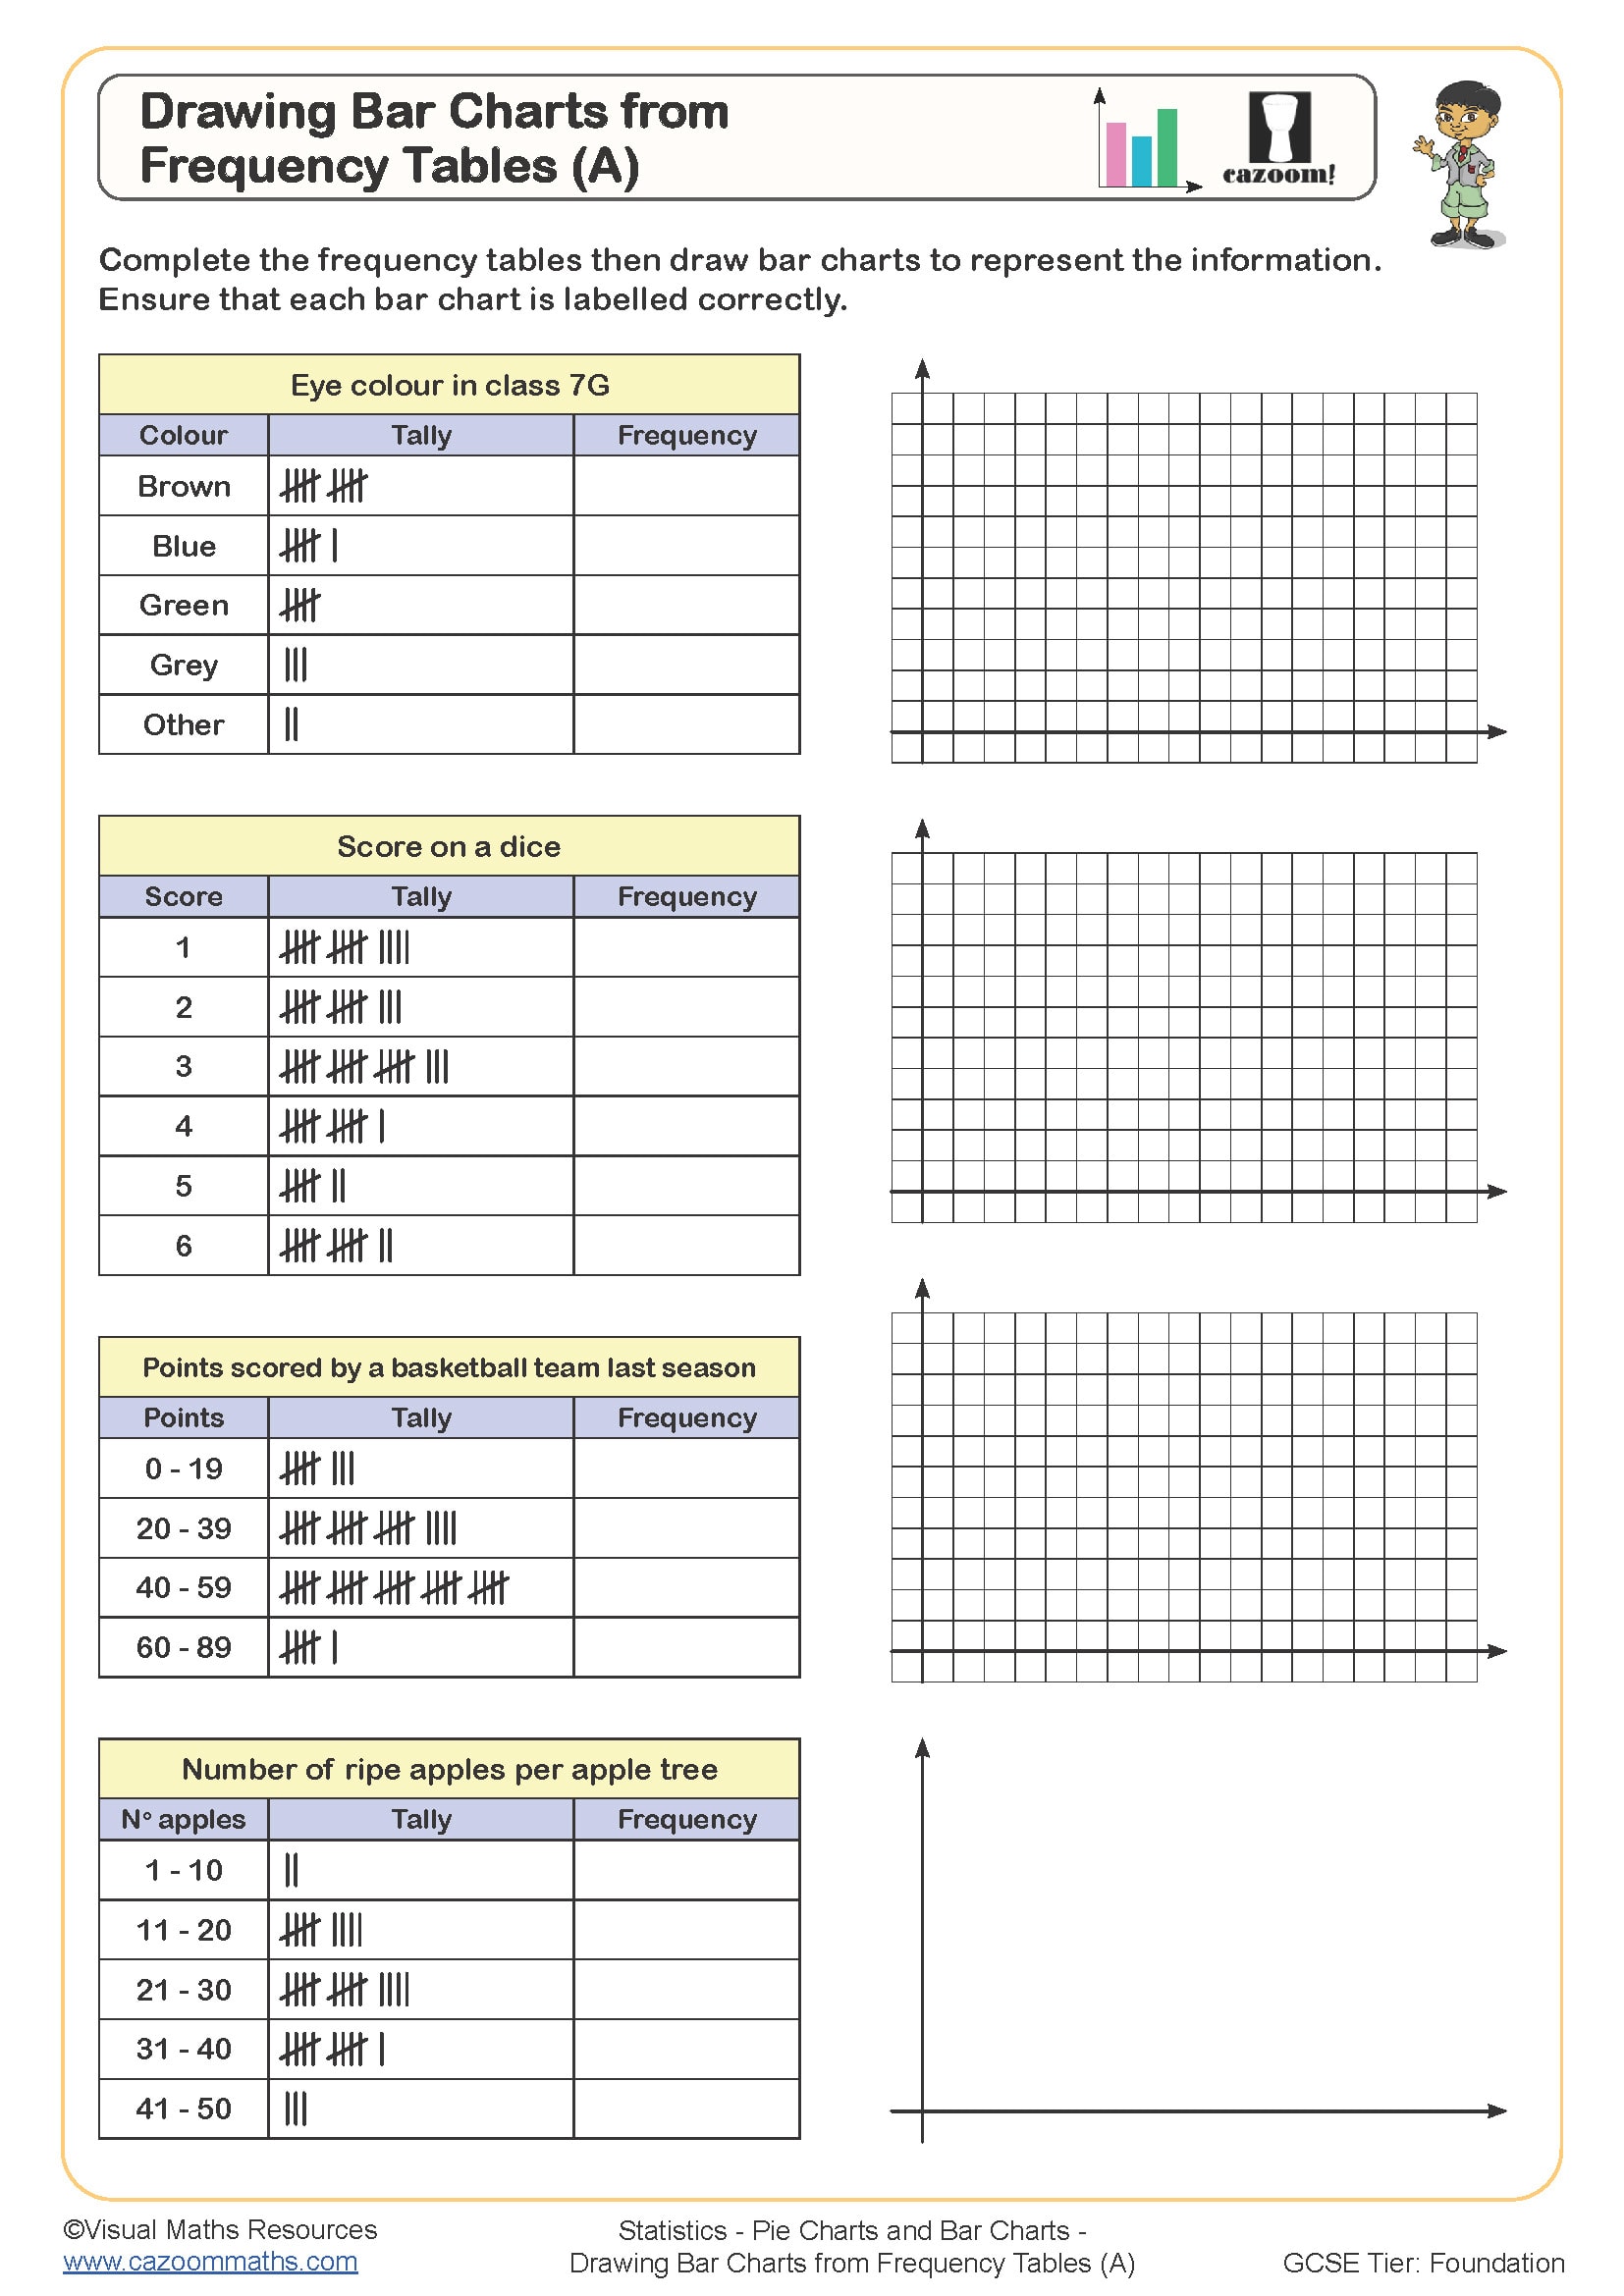
Drawing Bar Charts from Frequency Tables (A)
Year groups: 7, 8
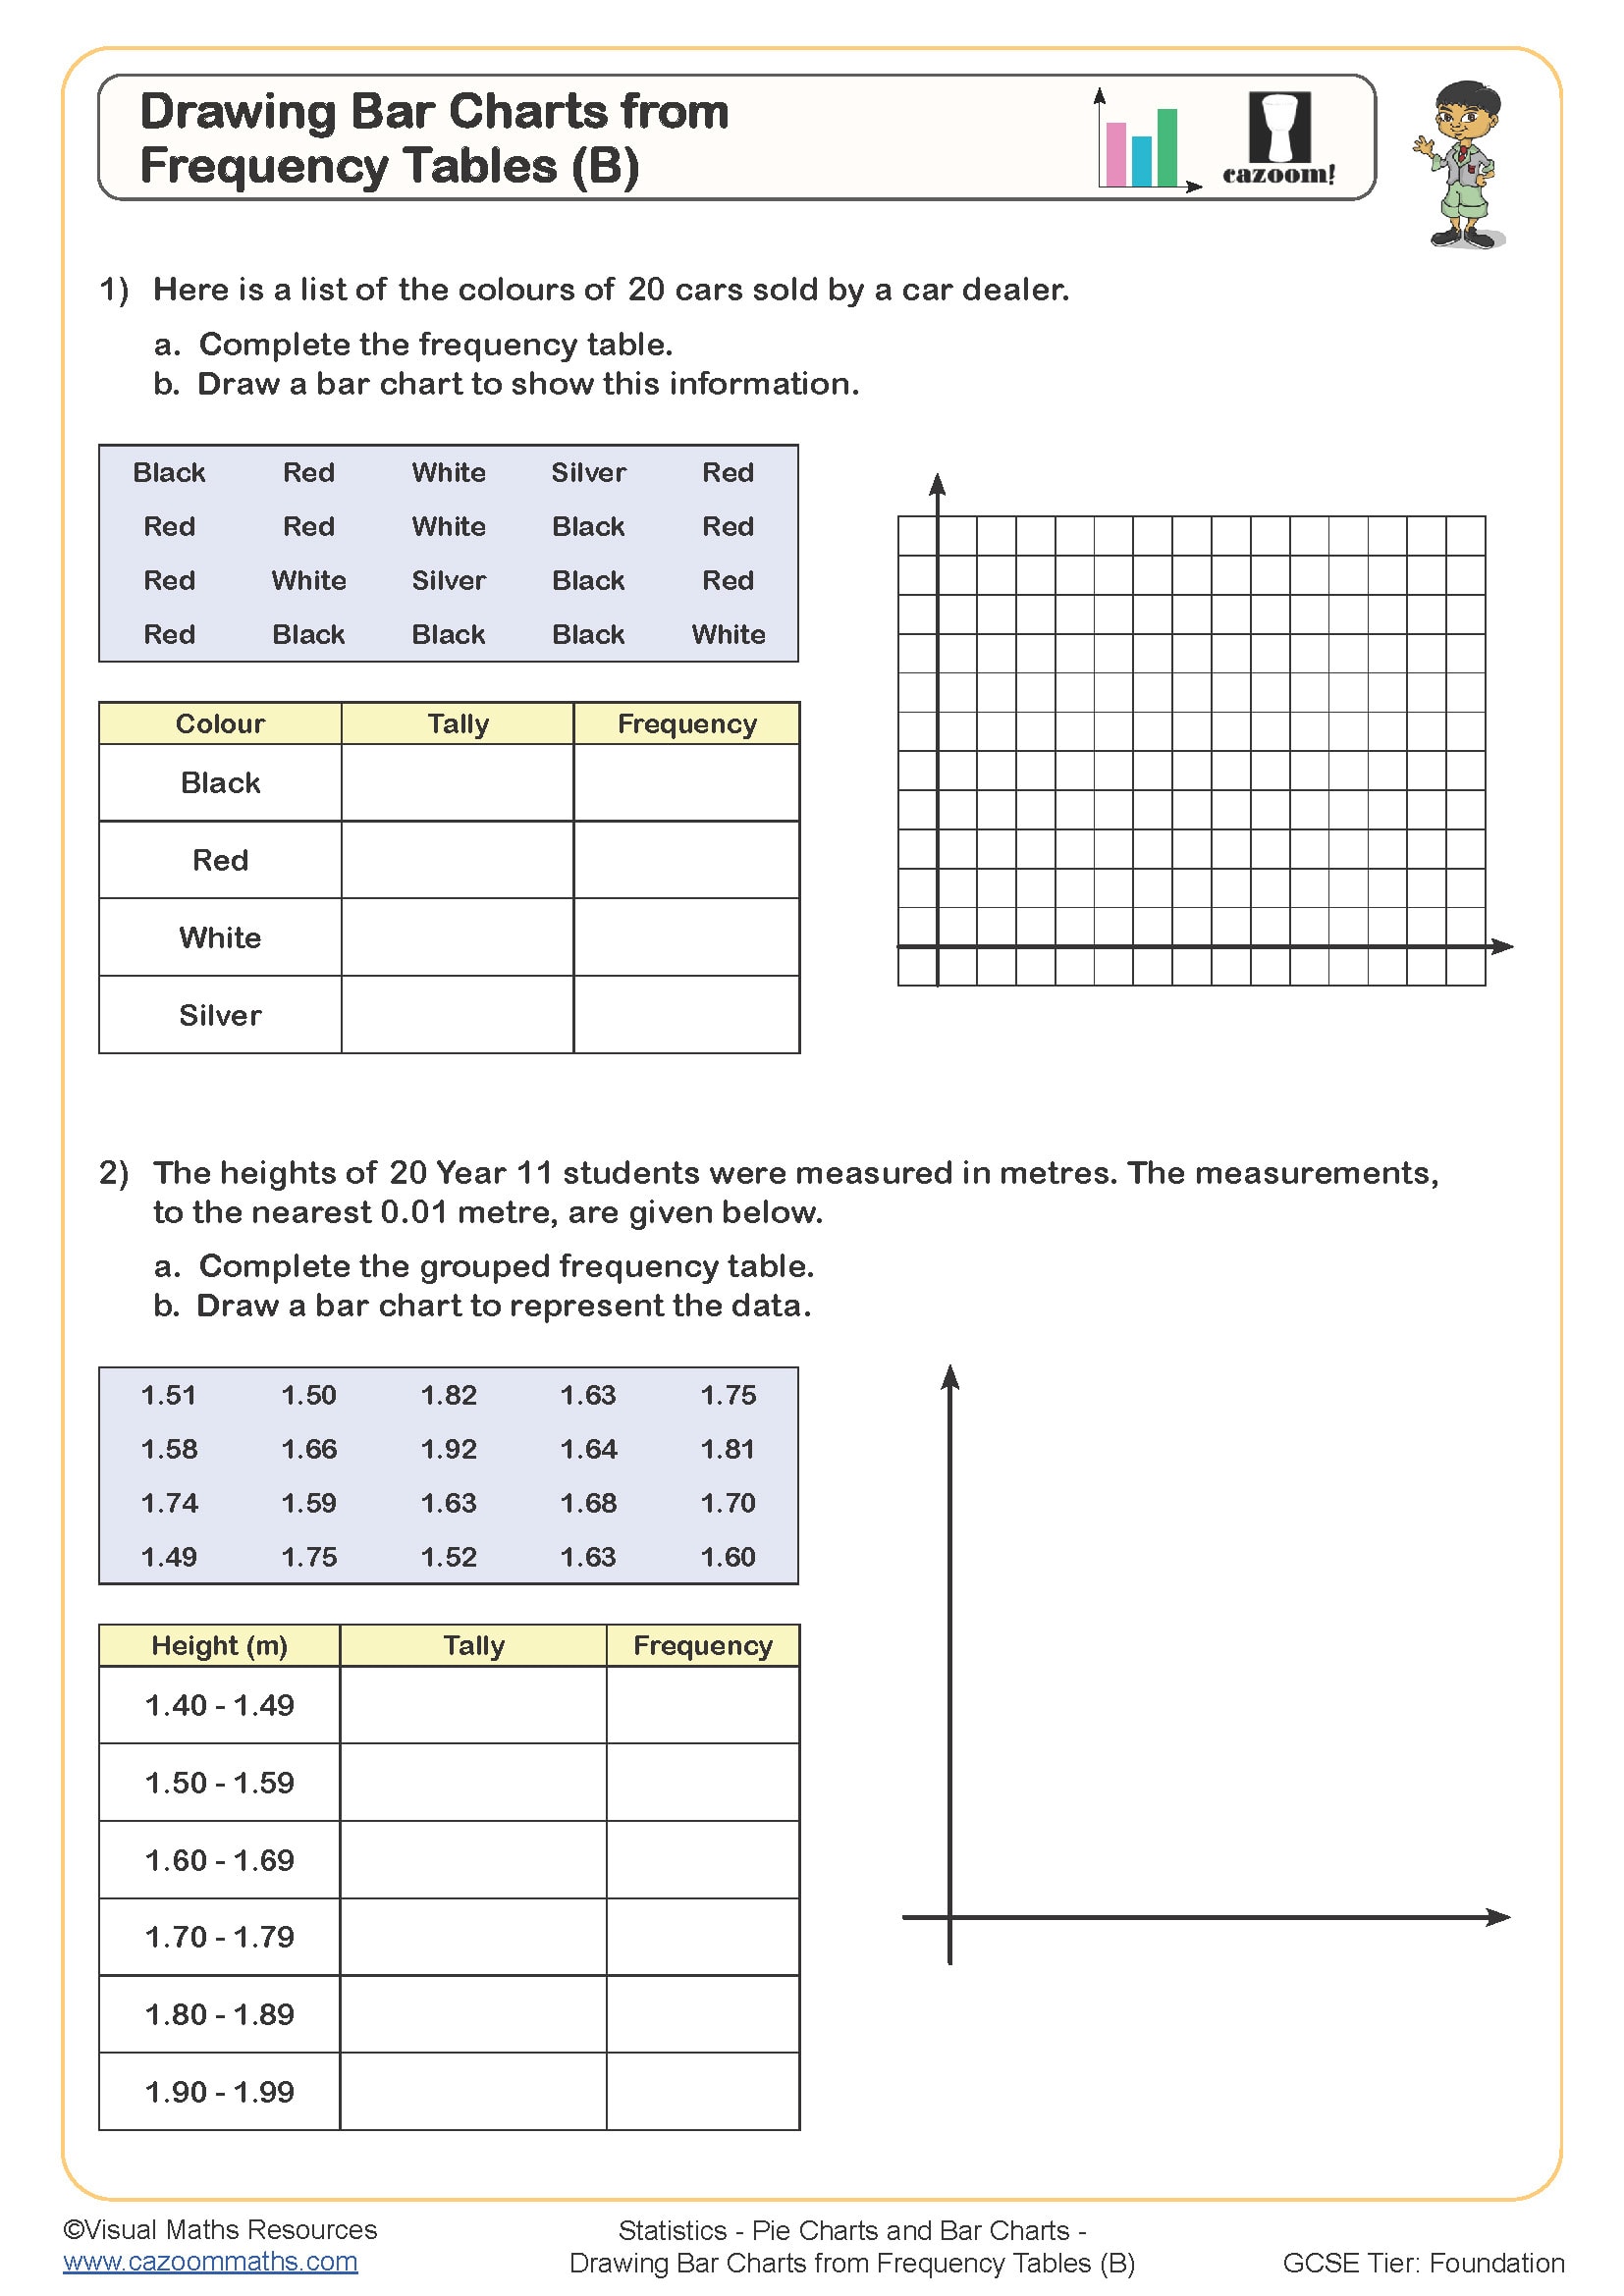
Drawing Bar Charts from Frequency Tables (B)
Year groups: 7, 8
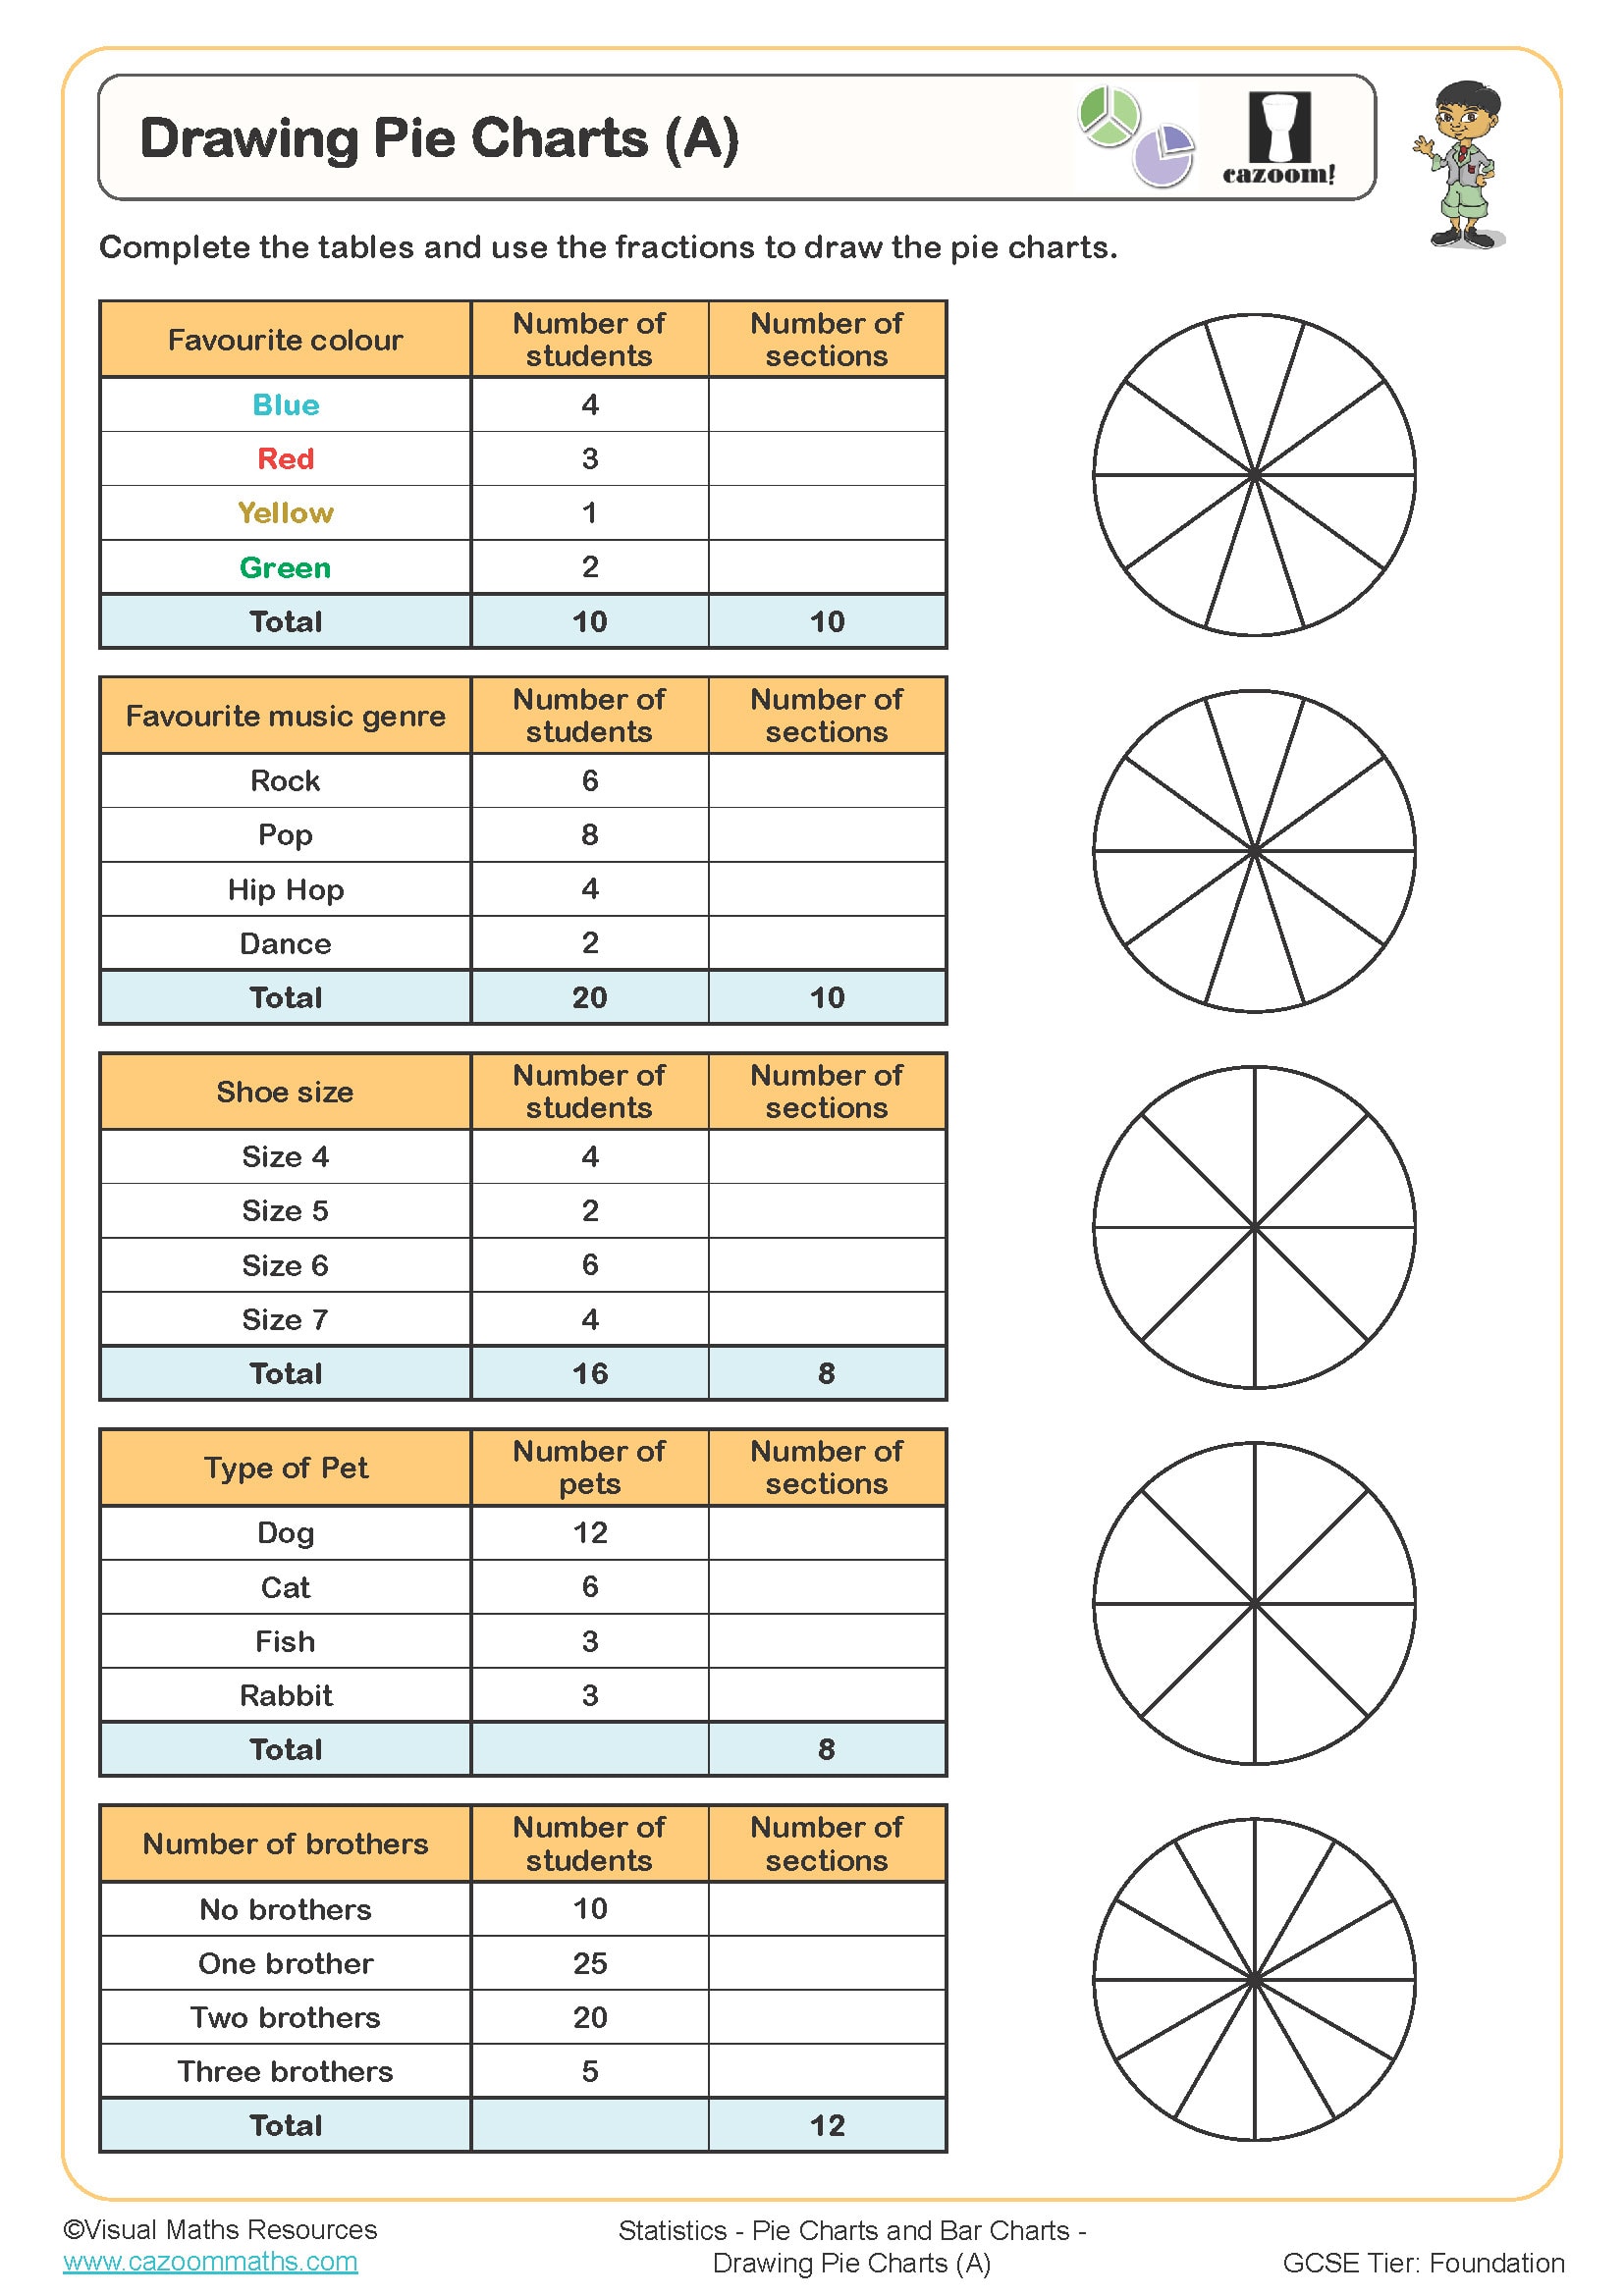
Drawing Pie Charts (A)
Year groups: 7, 8
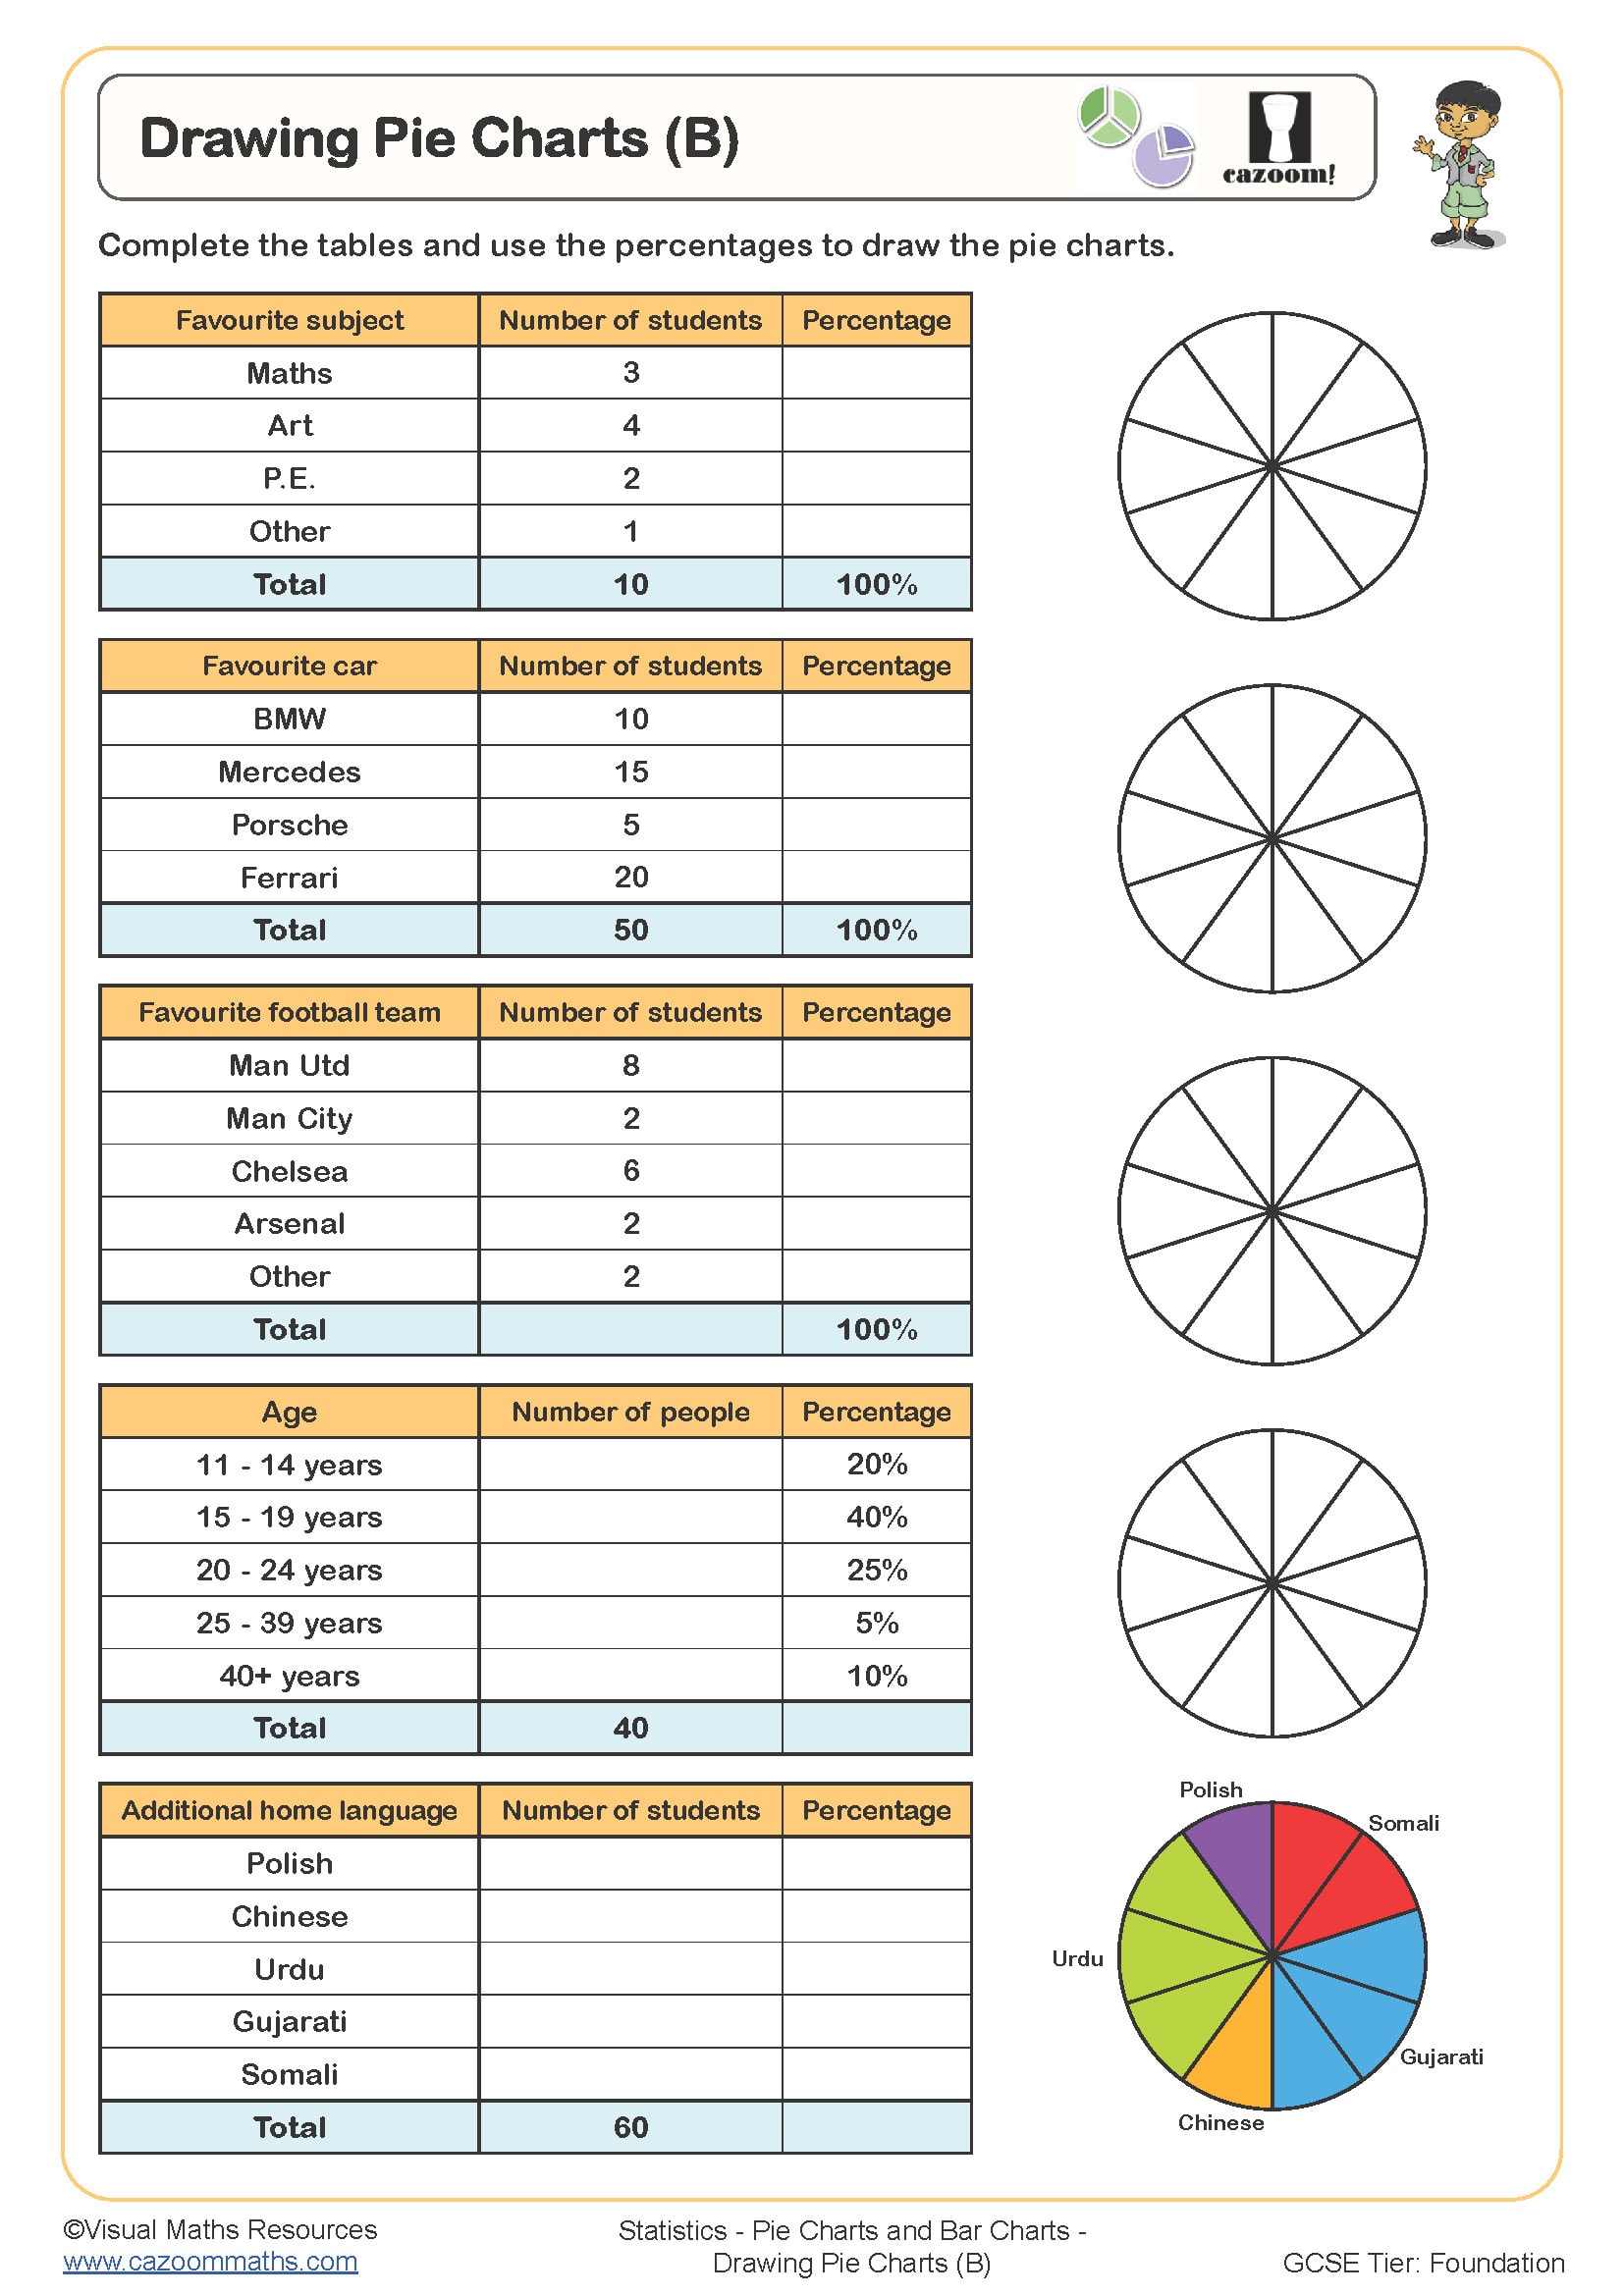
Drawing Pie Charts (B)
Year groups: 7, 8
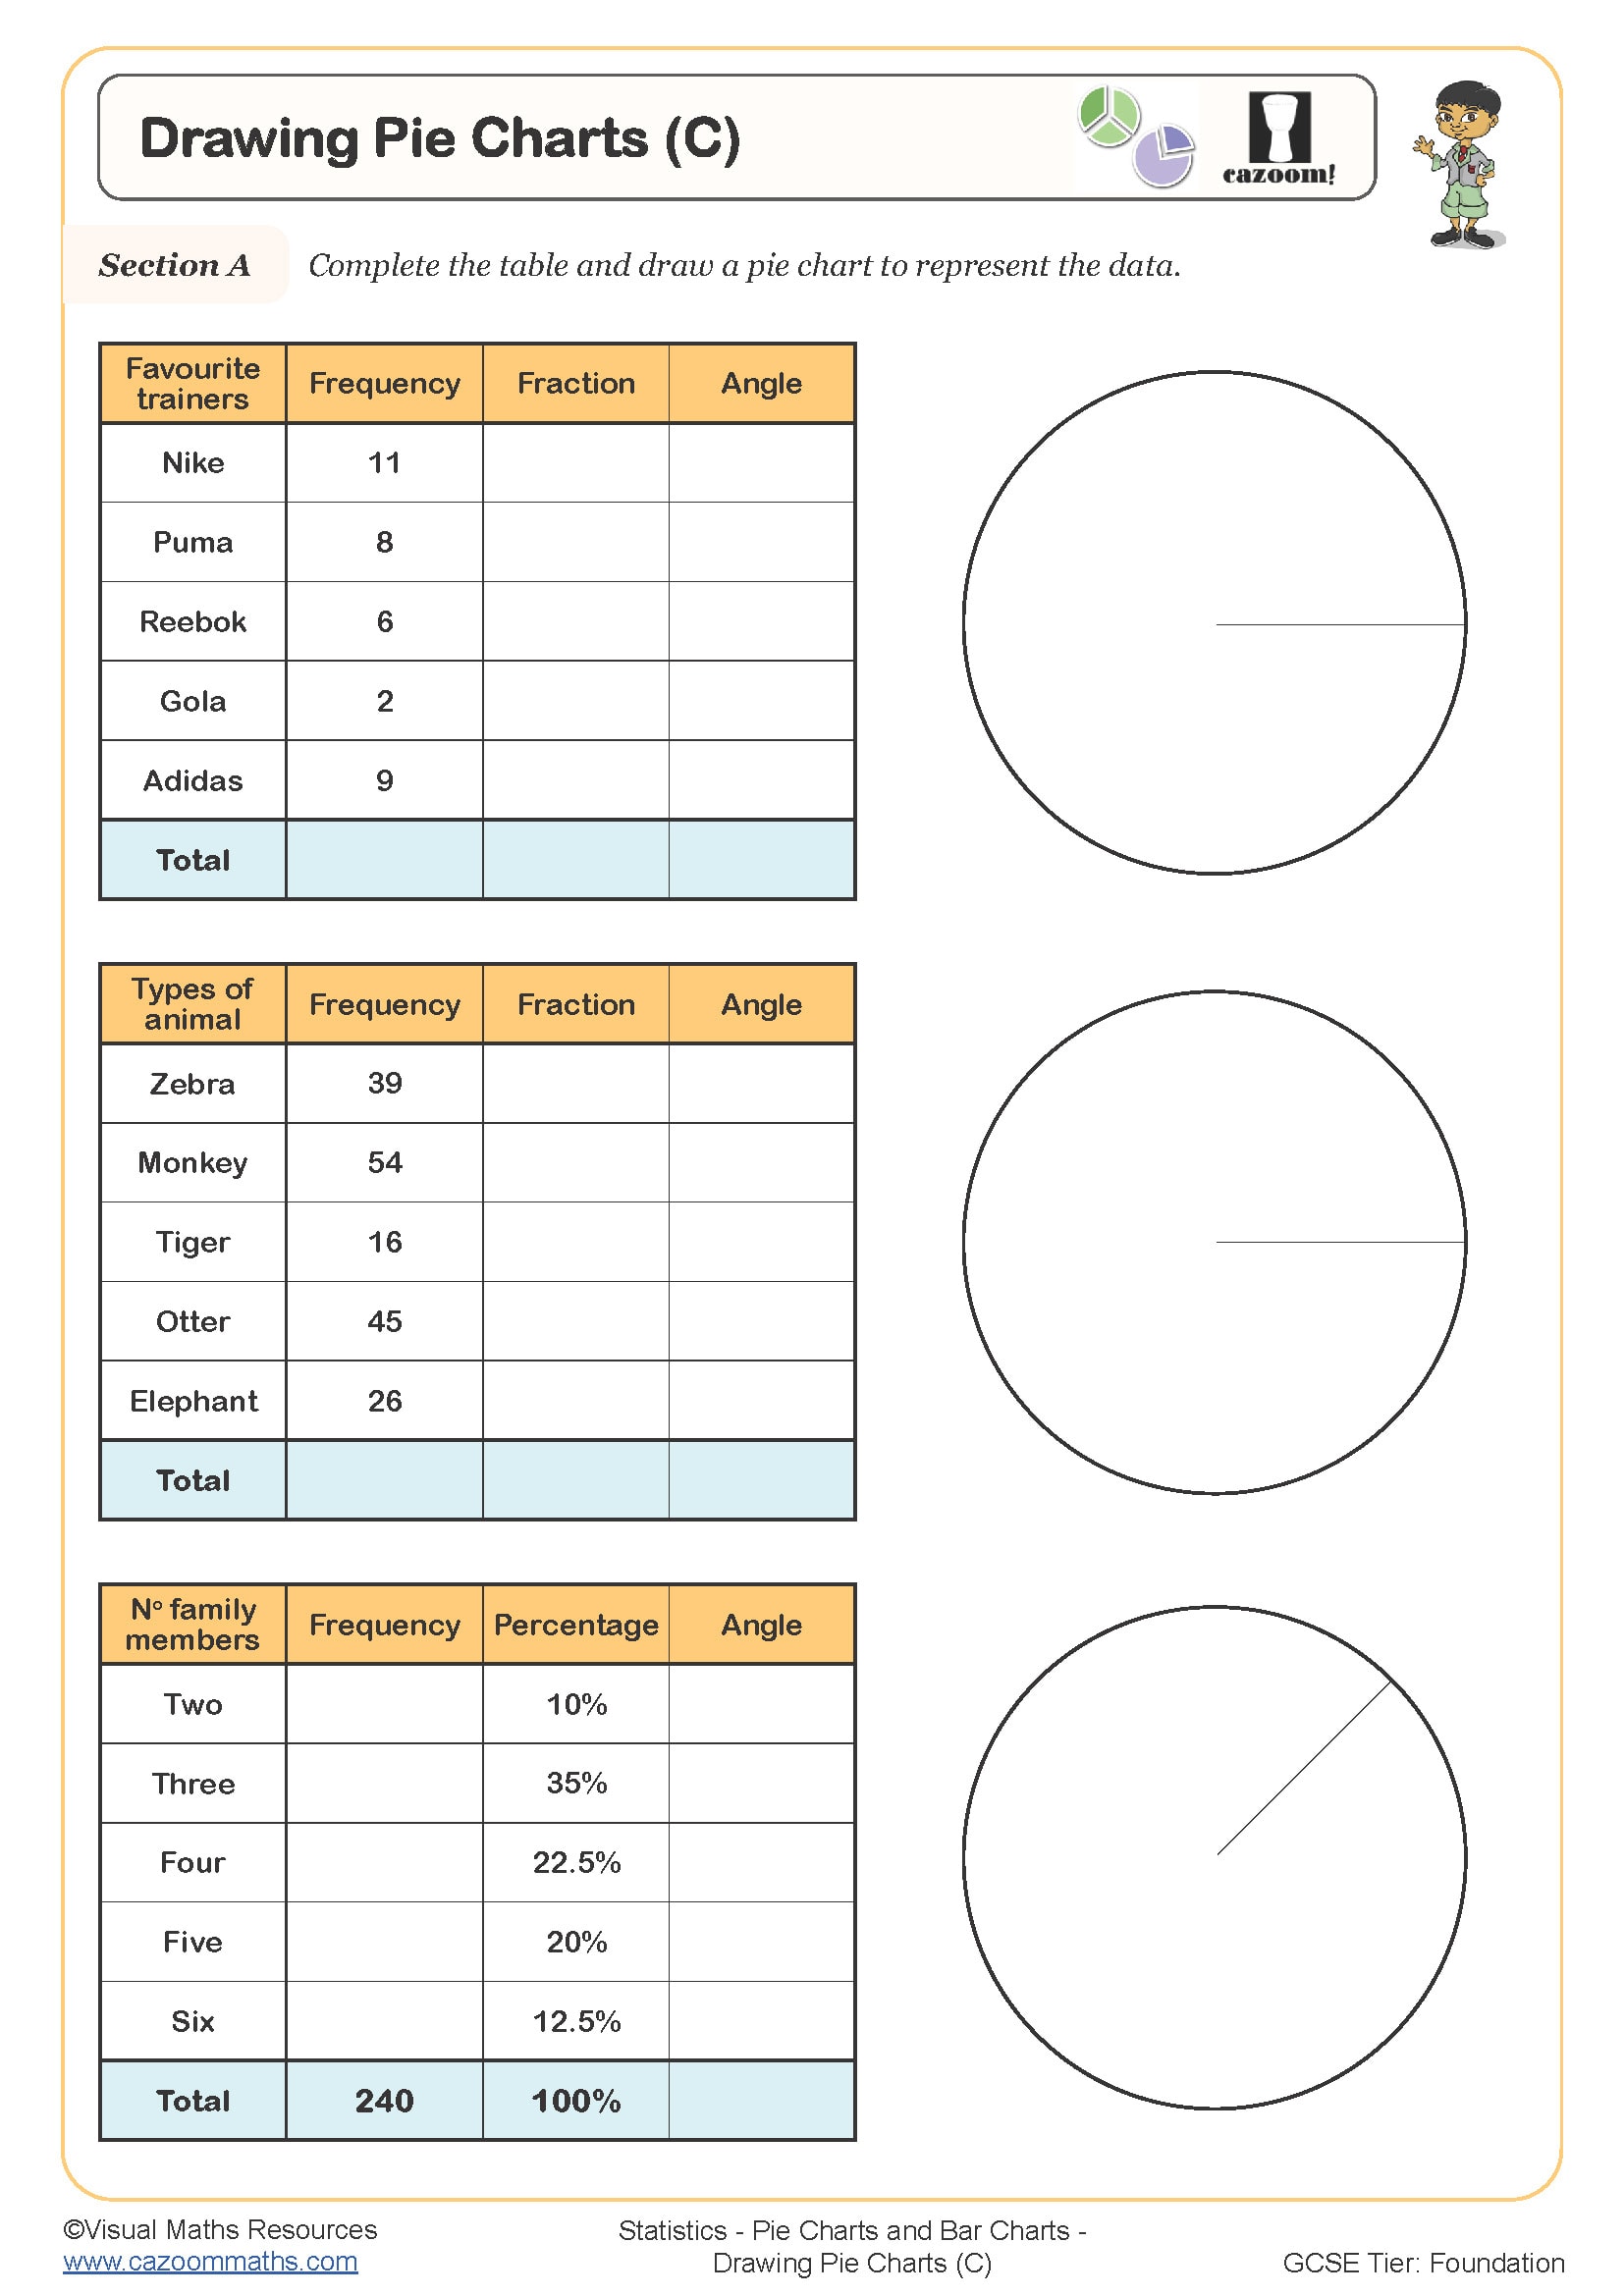
Drawing Pie Charts (C)
Year groups: 7, 8
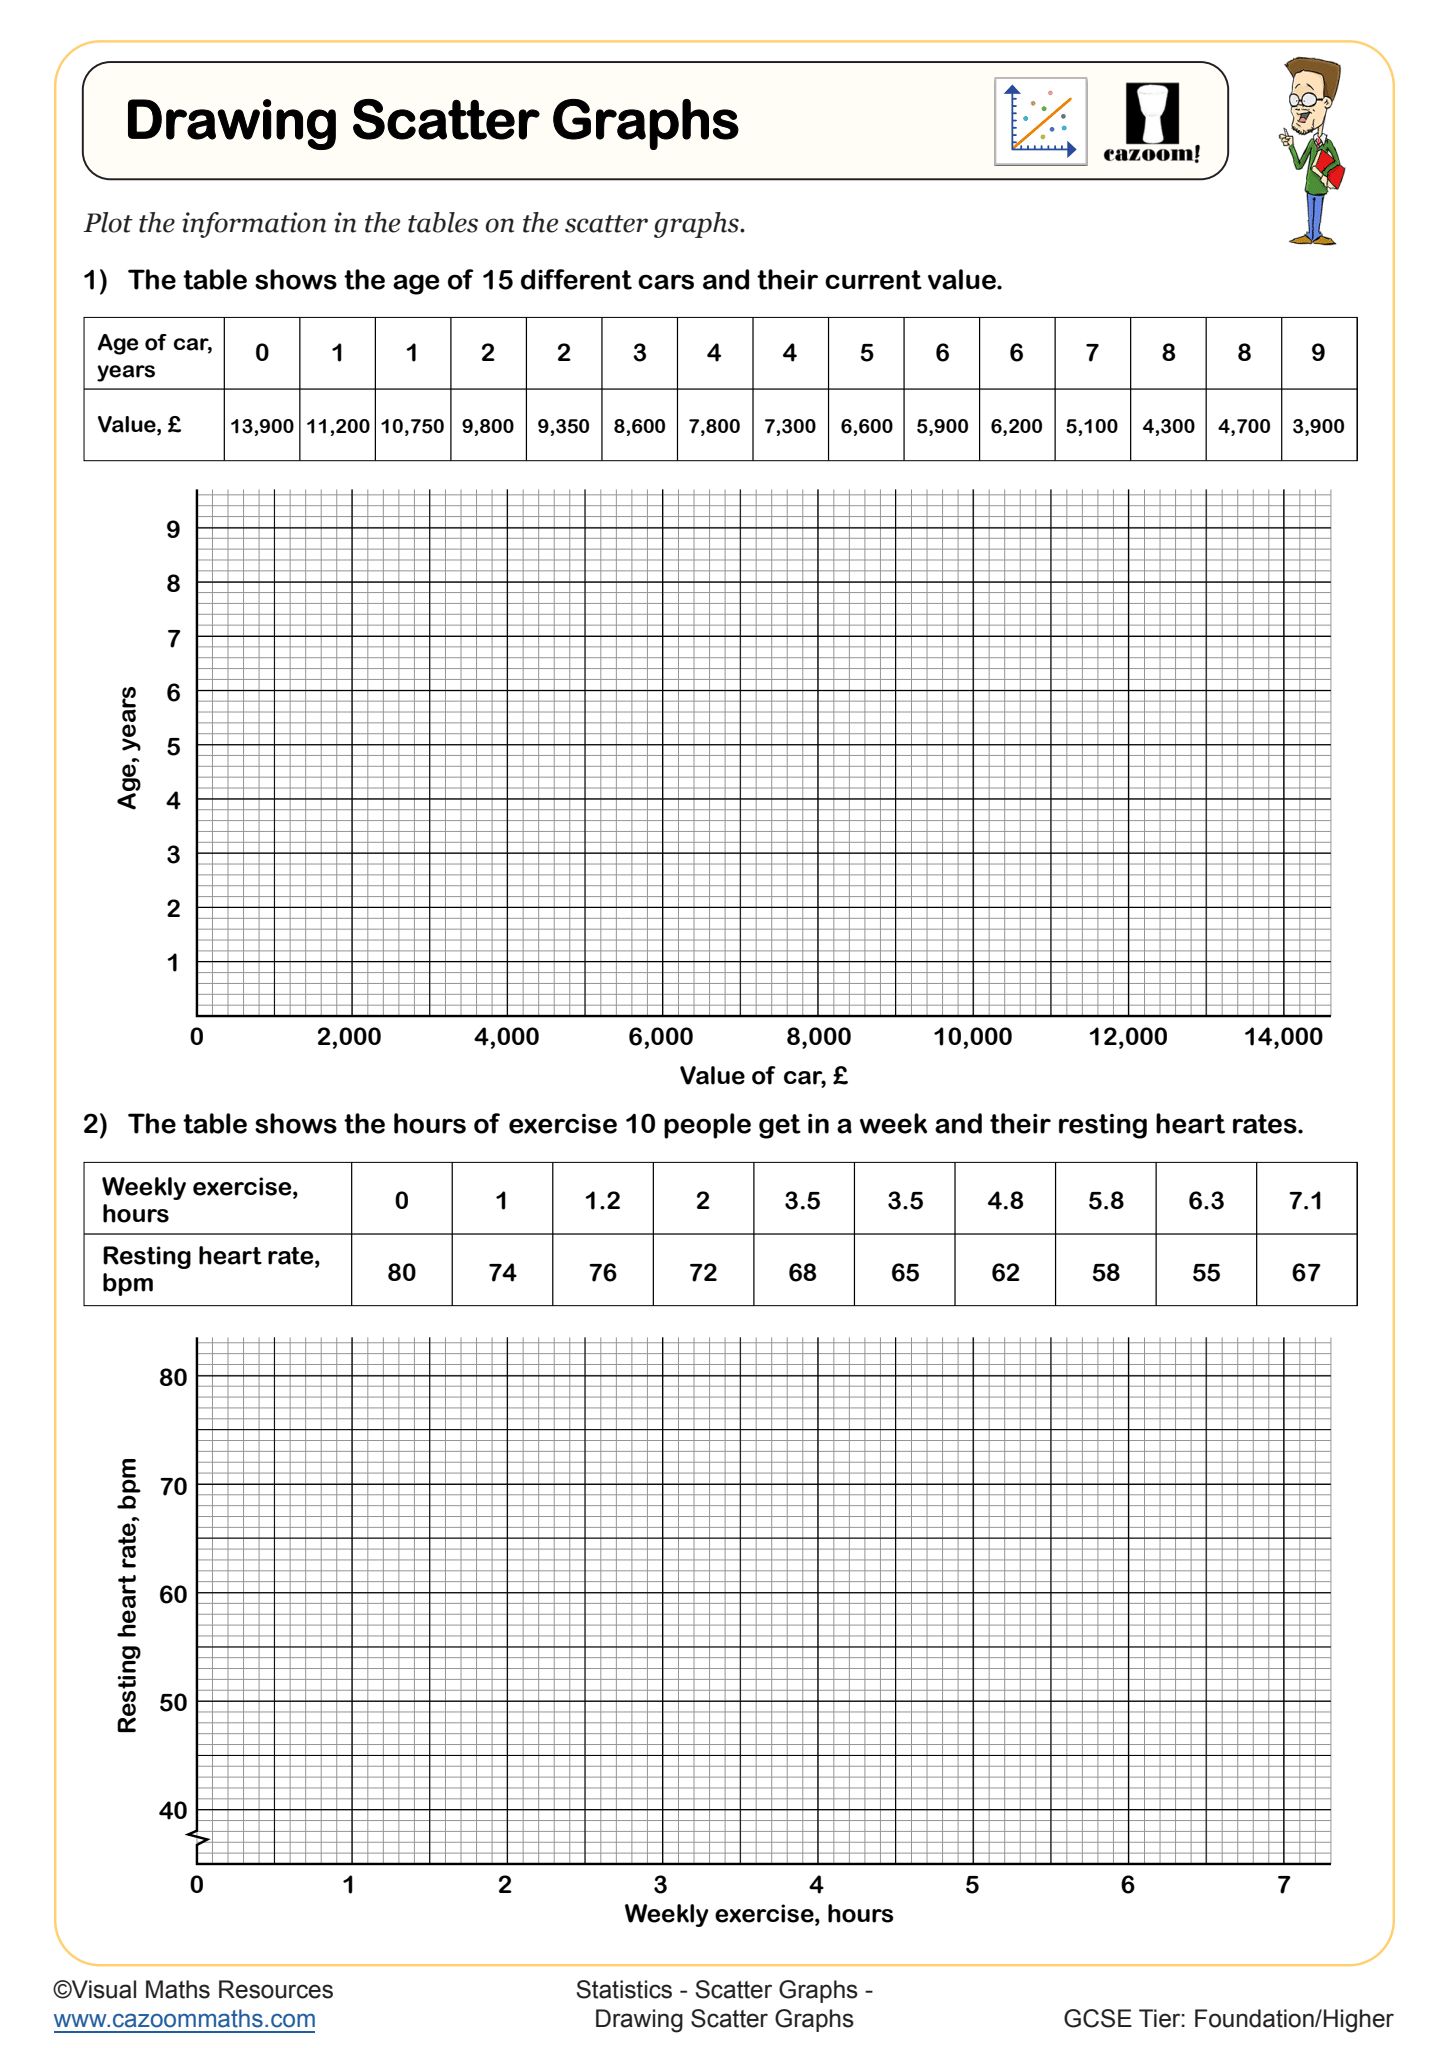
Drawing Scatter Graphs
Year groups: 7, 8
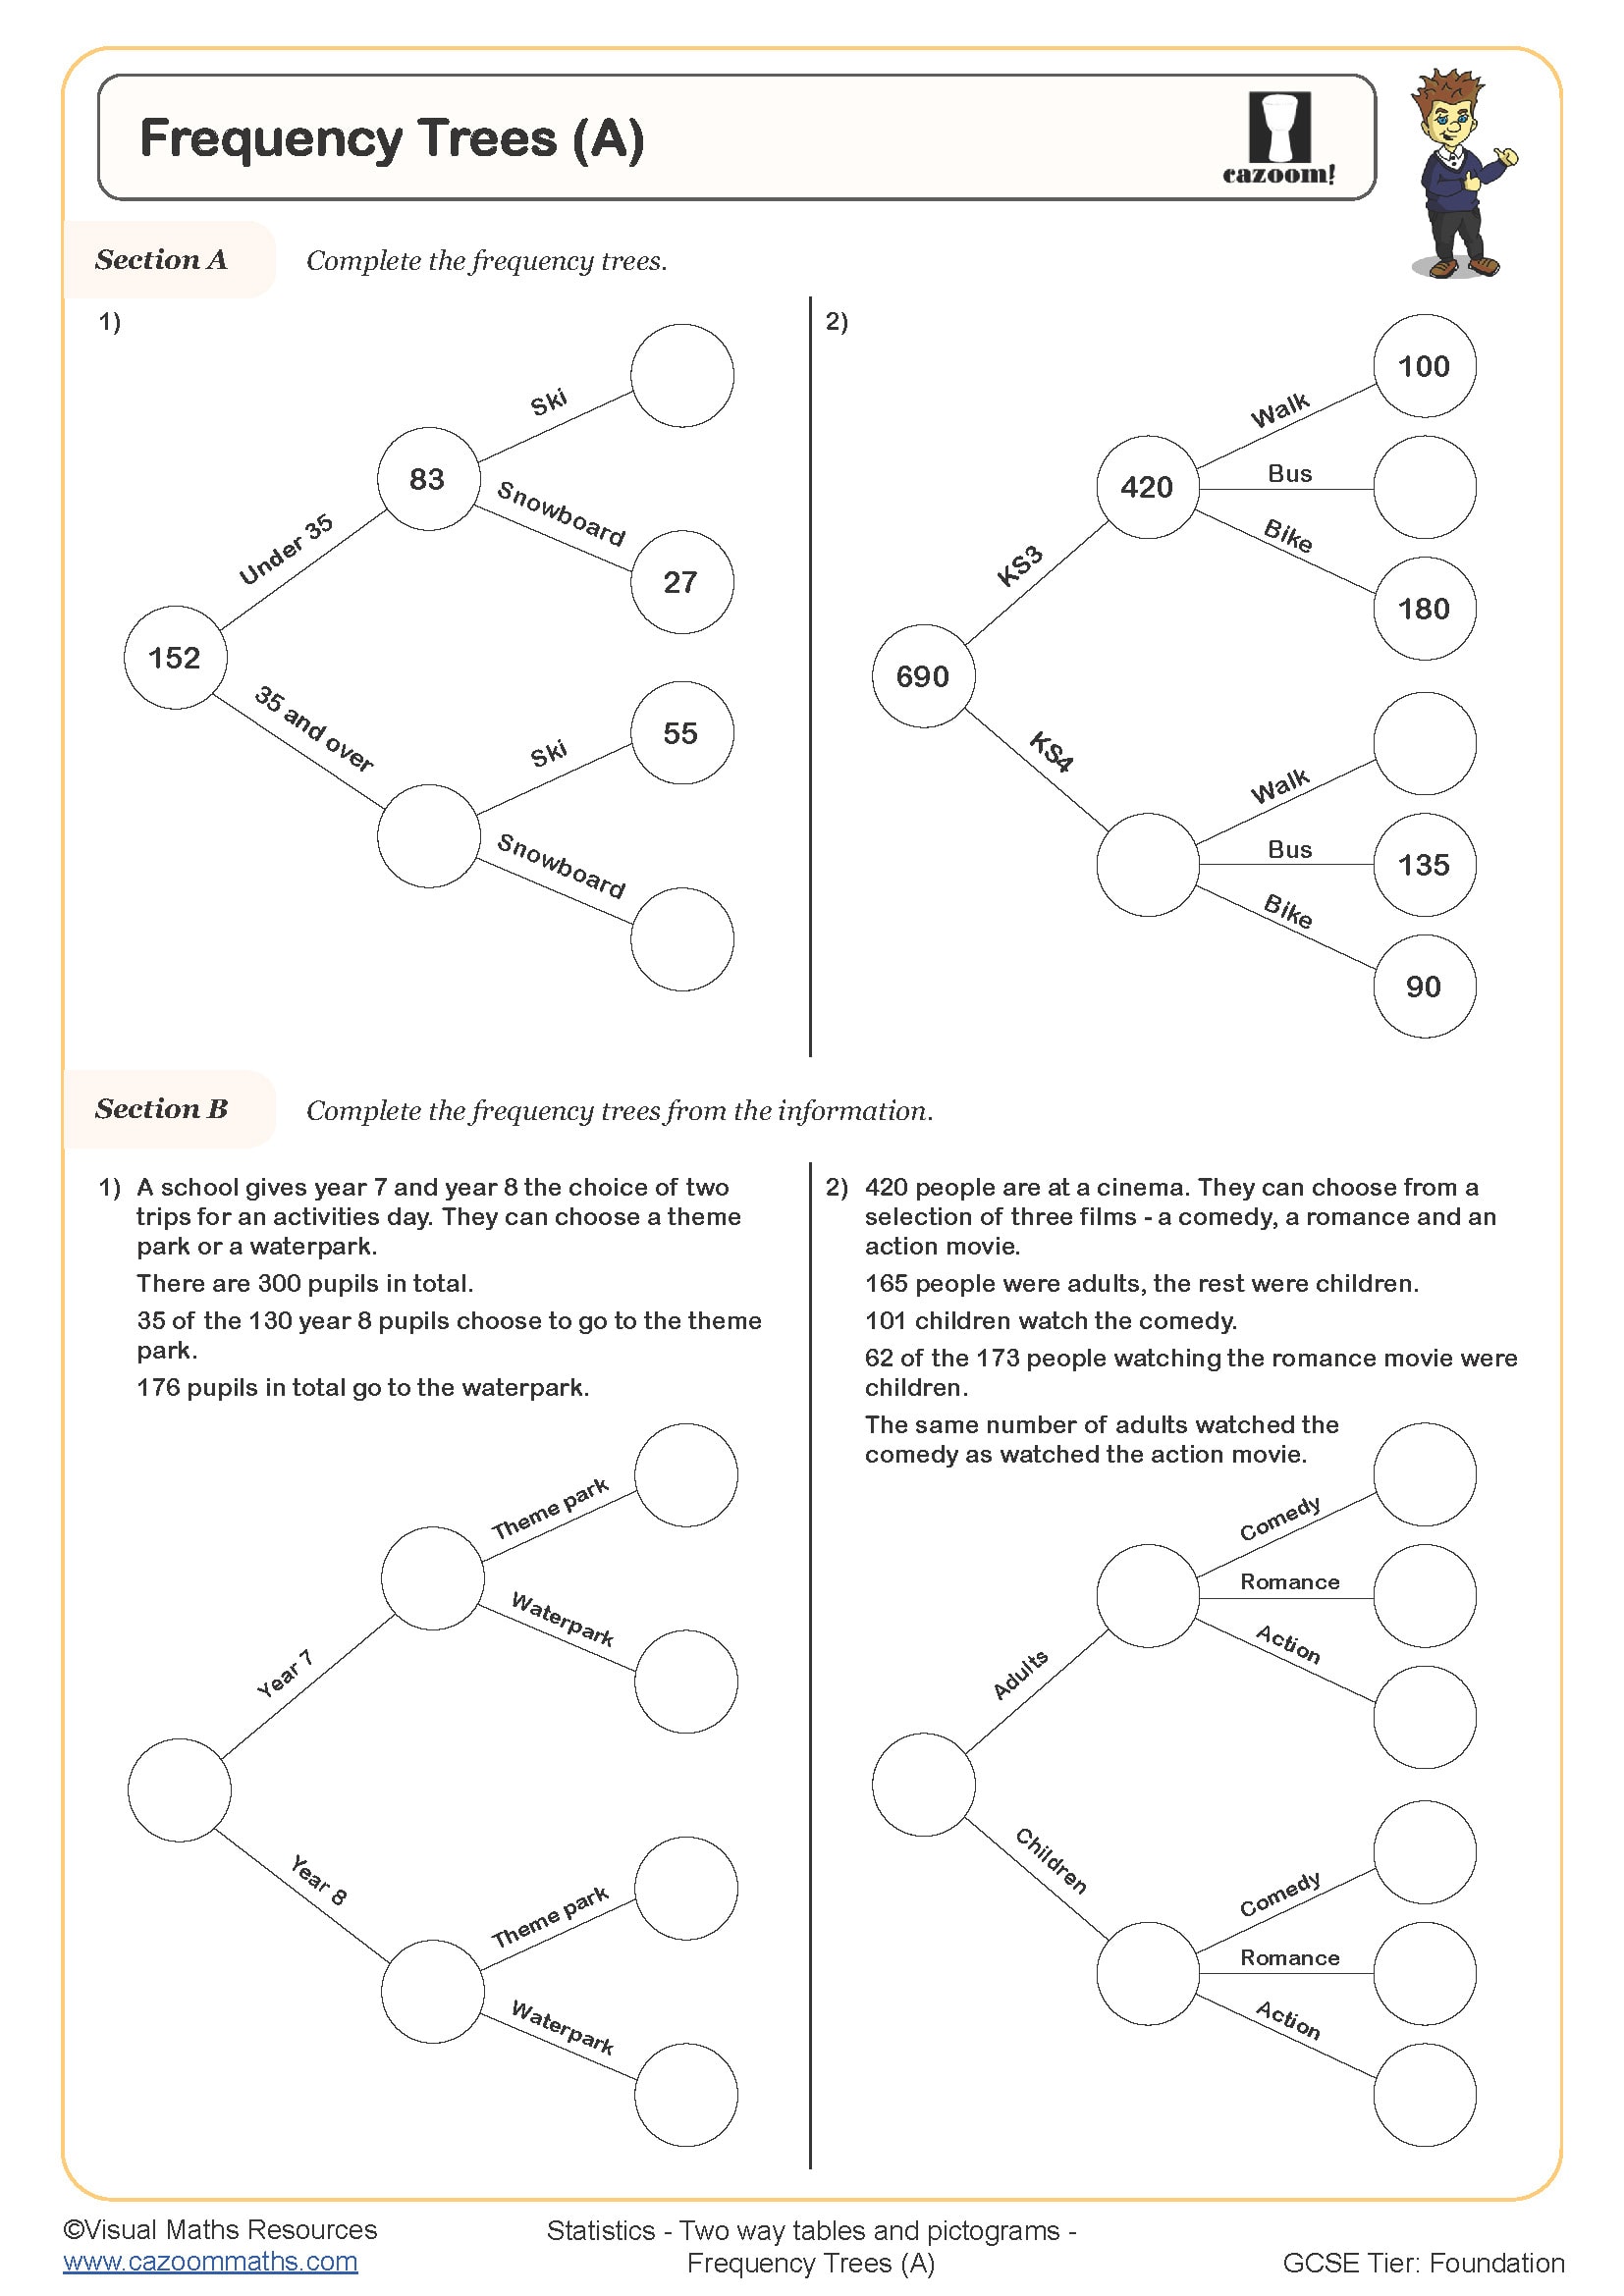
Frequency Trees (A)
Year groups: 7, 8
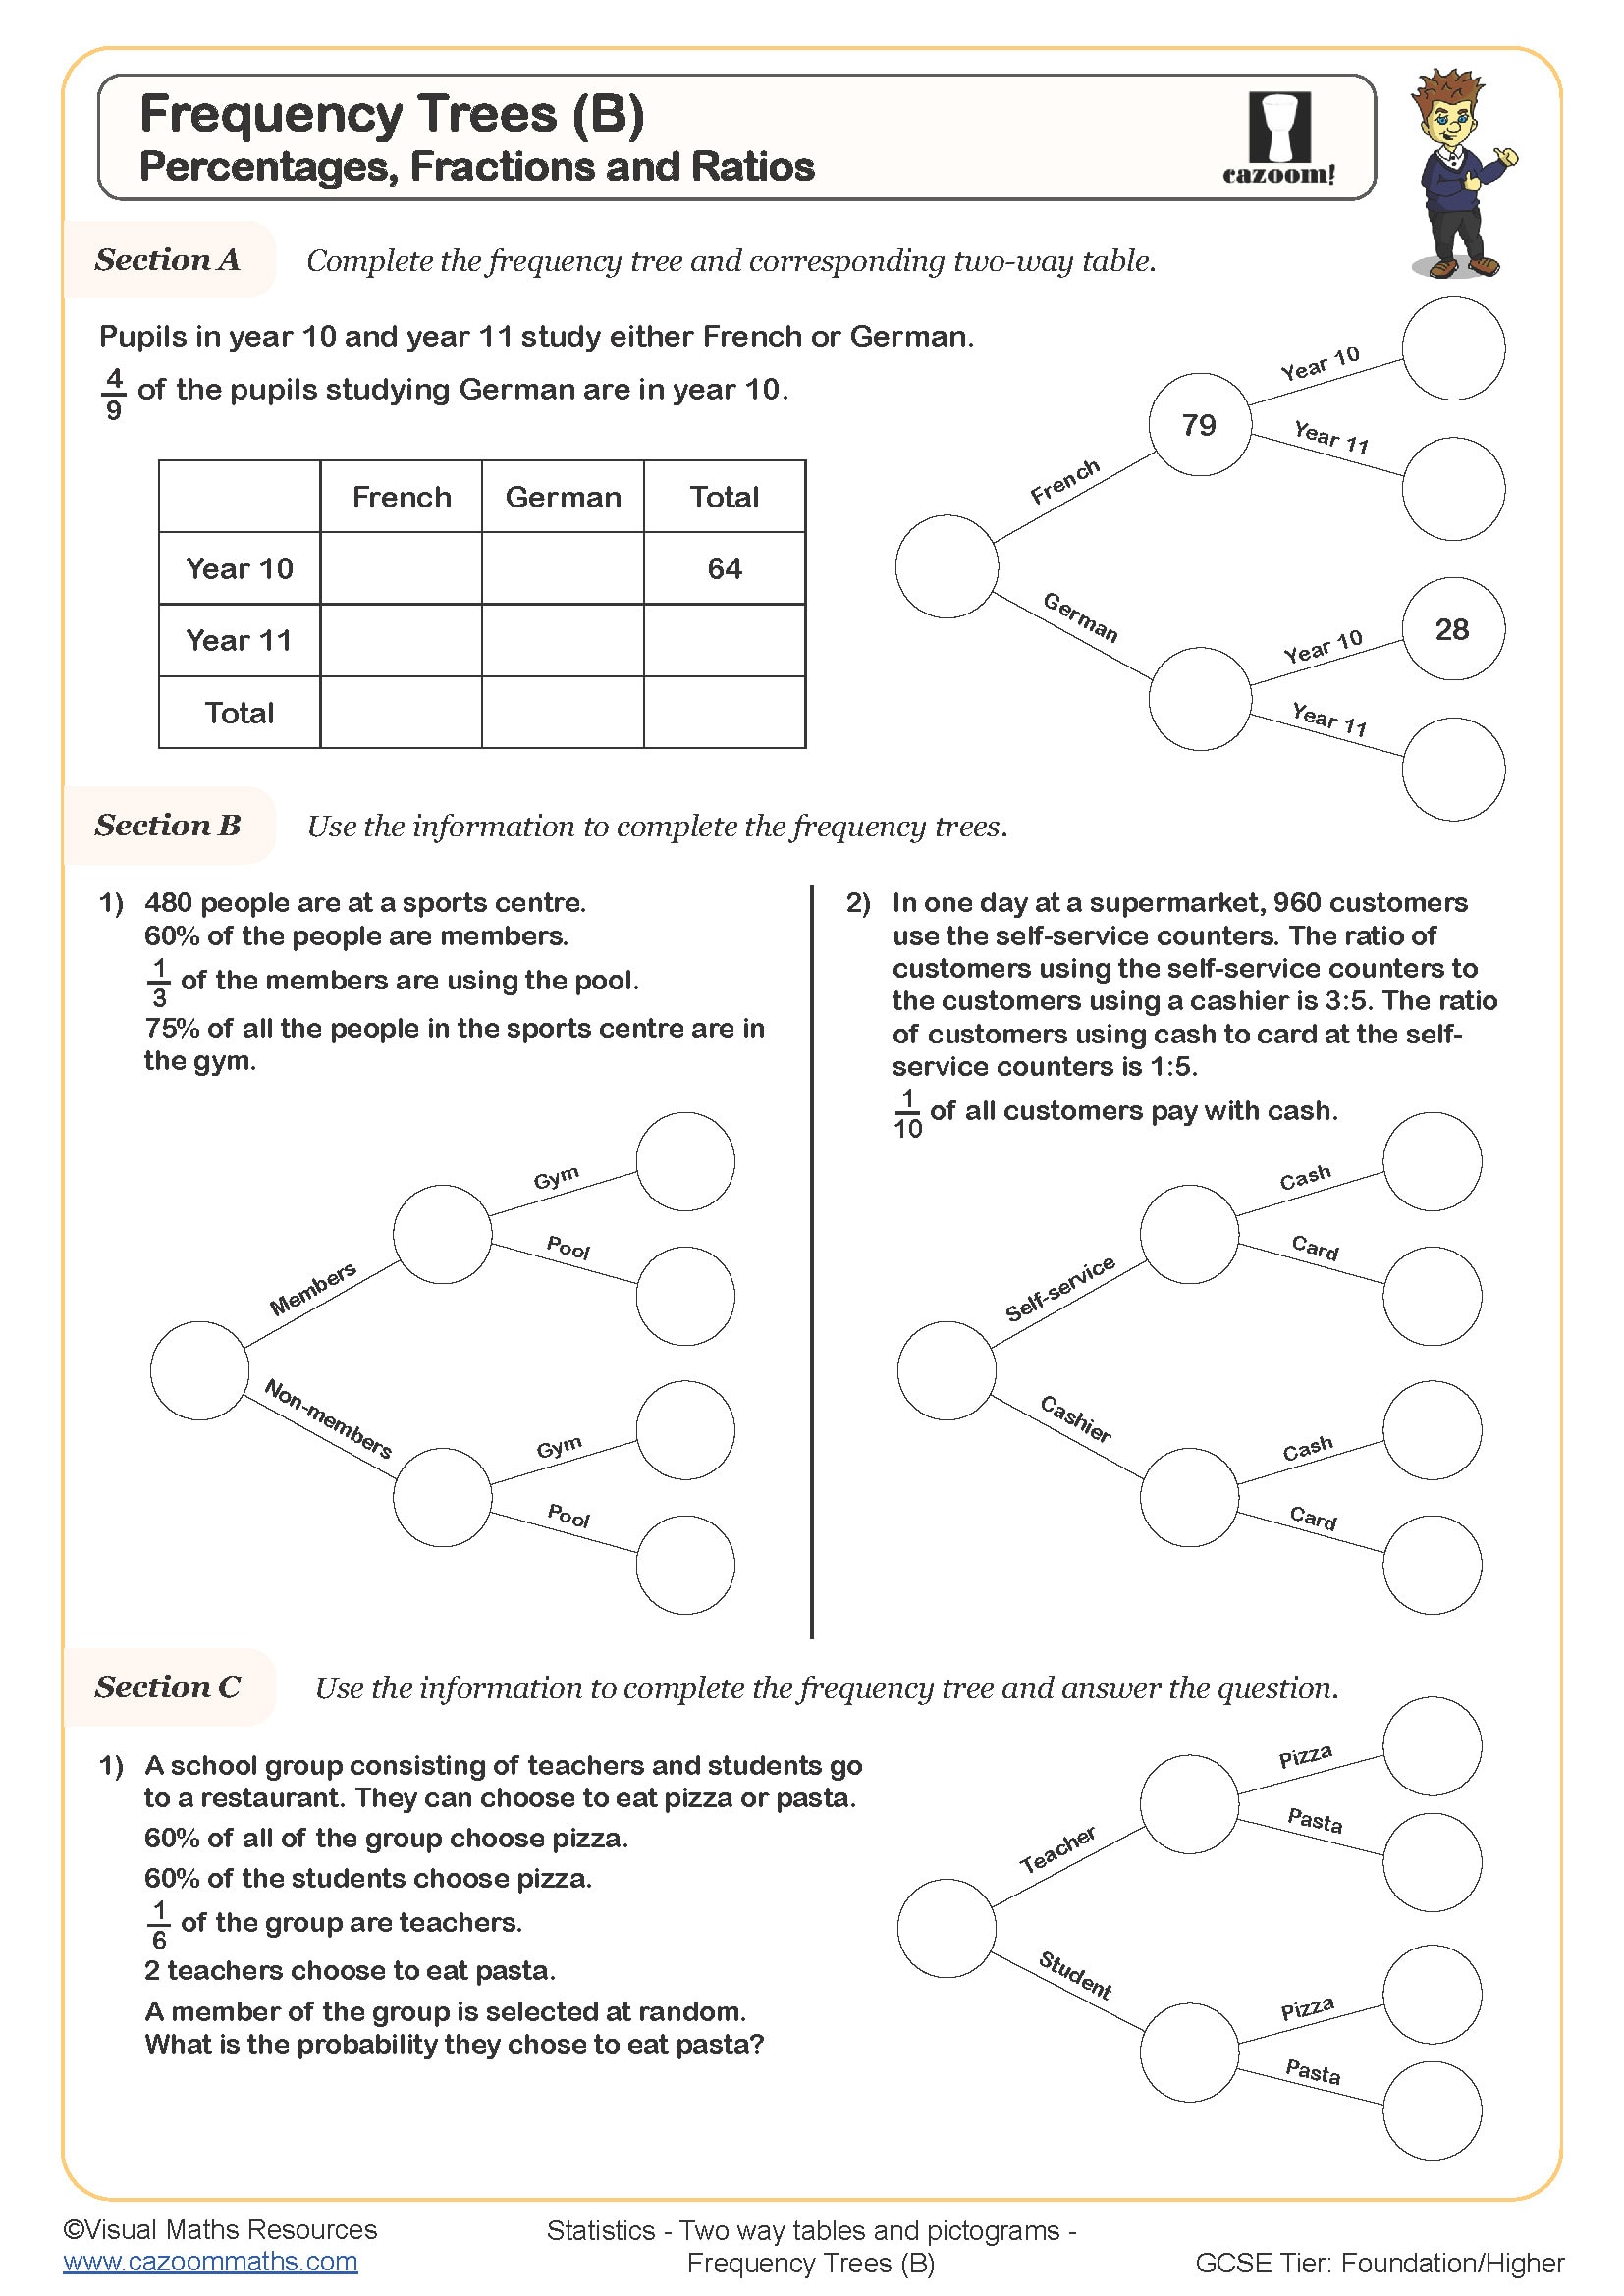
Frequency Trees (B)
Year groups: 7, 8
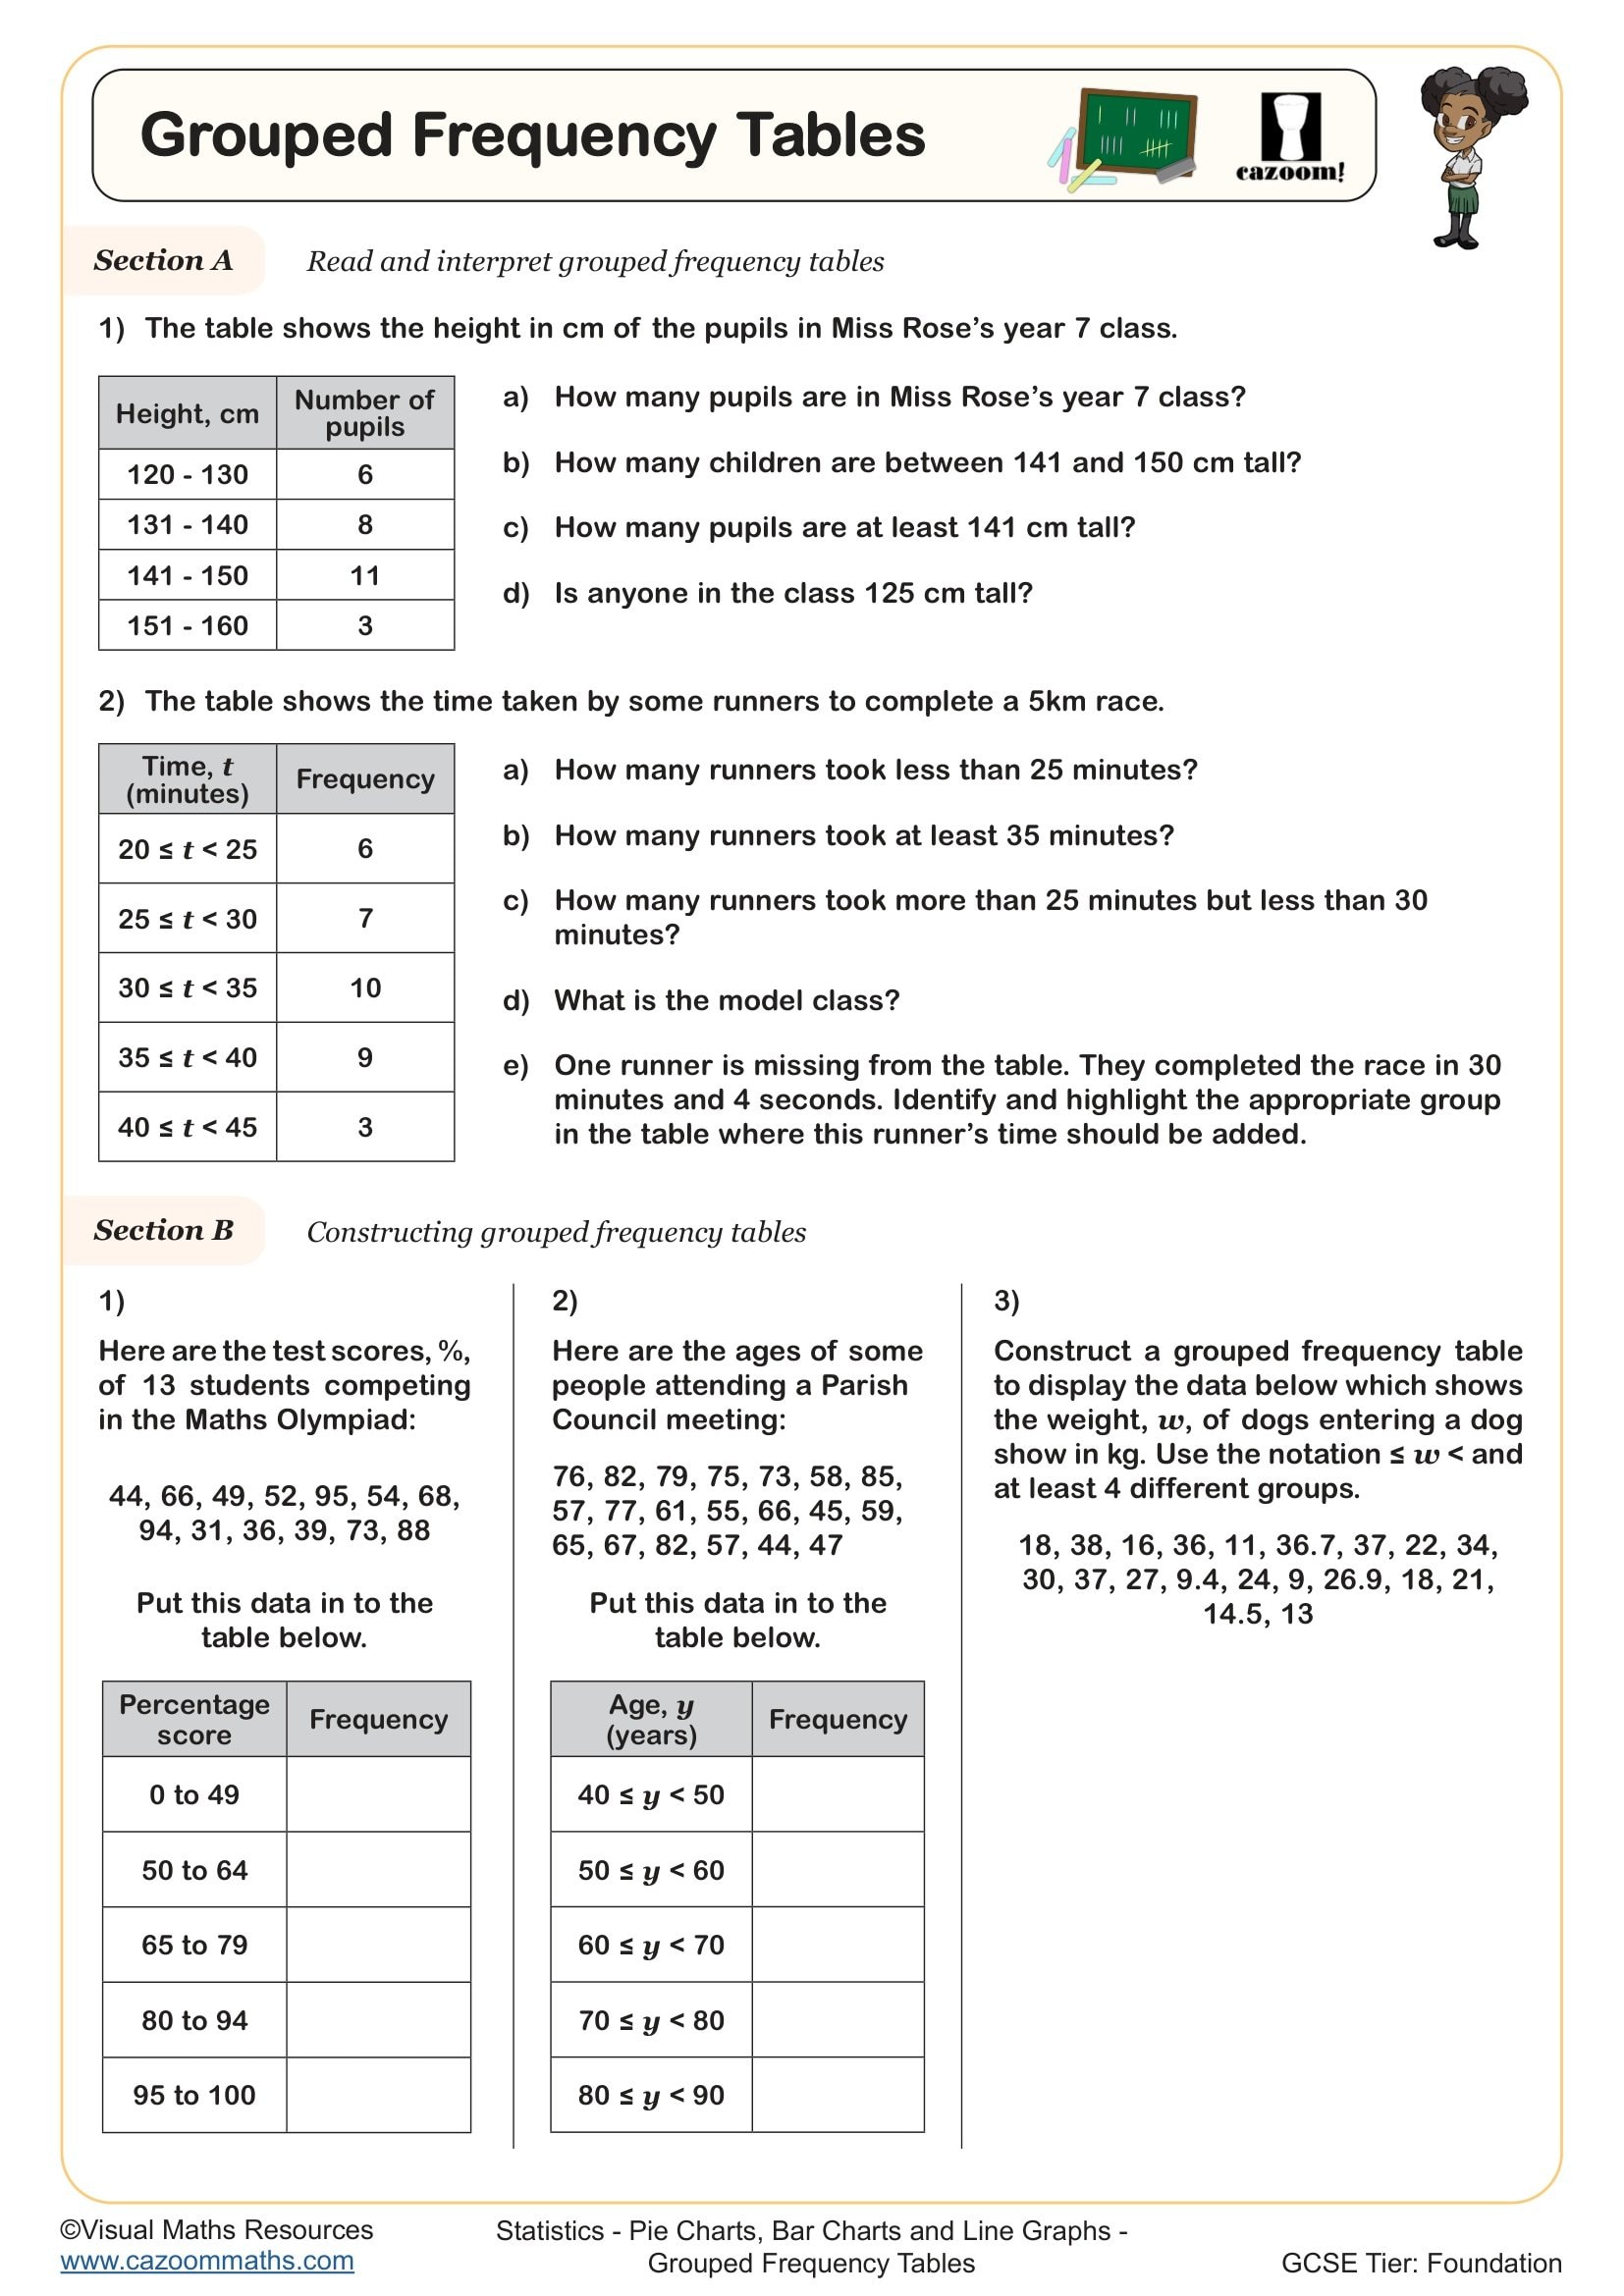
Grouped Frequency Tables
Year groups: 7, 8
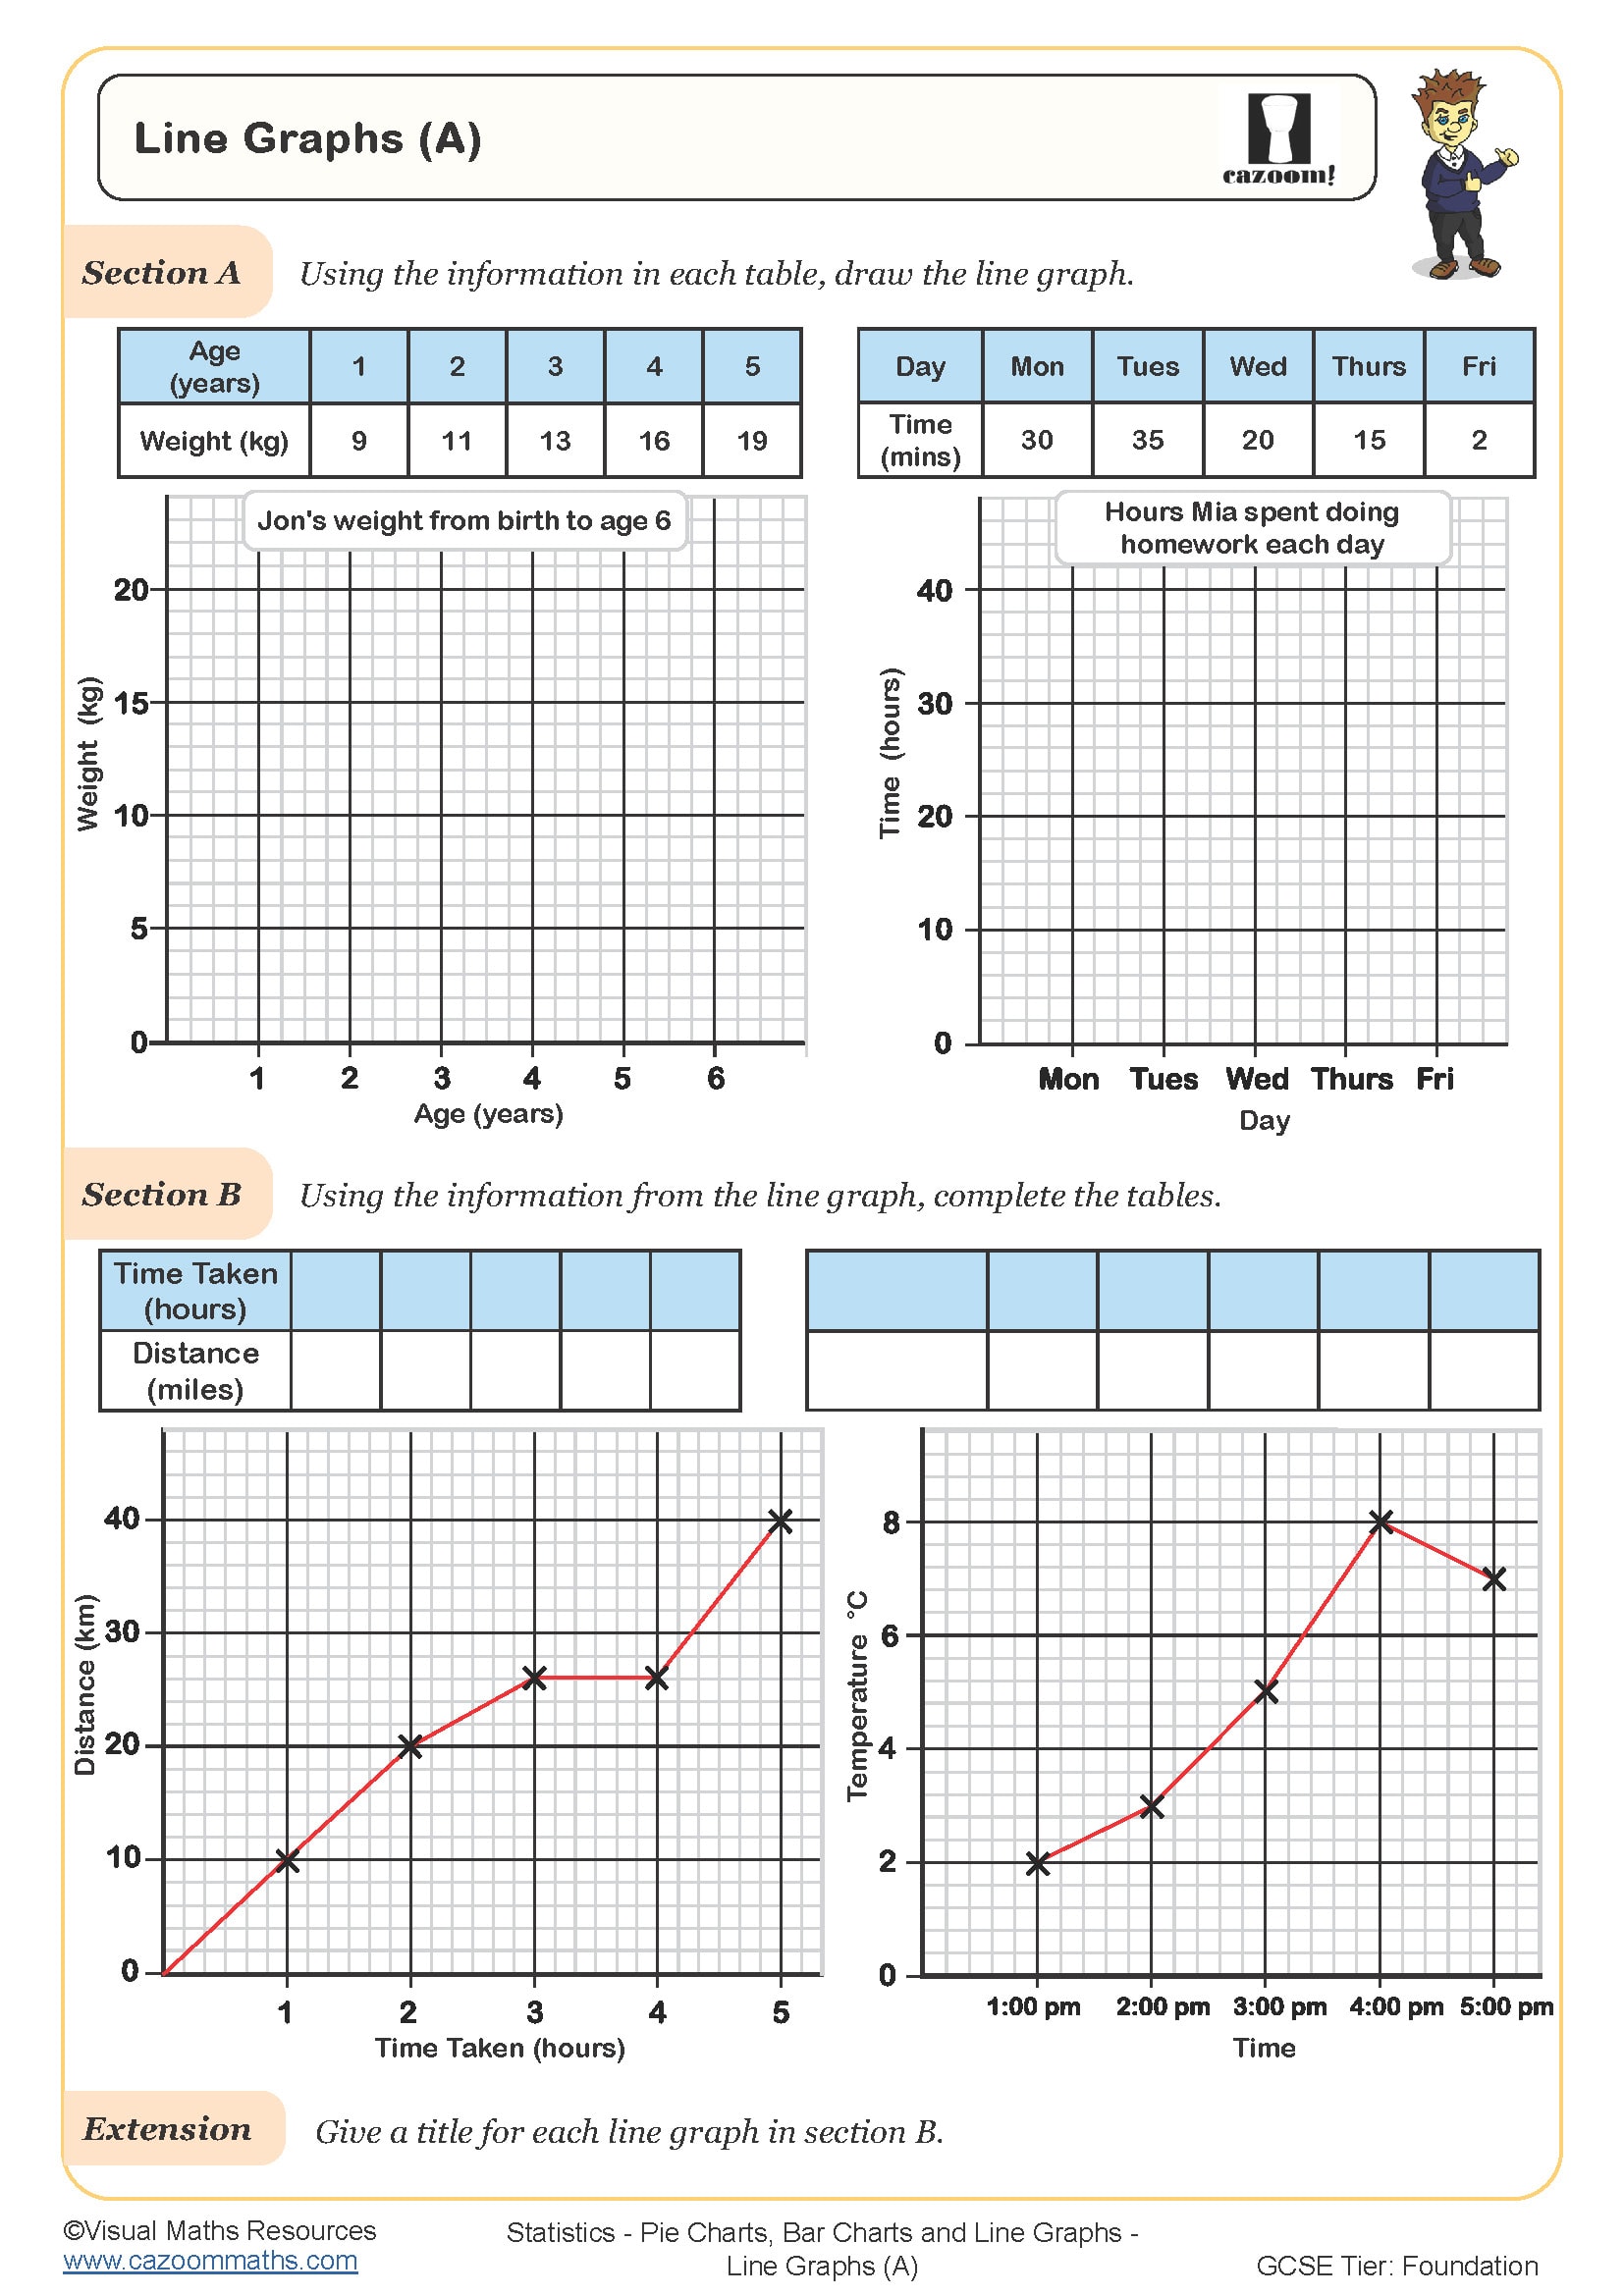
Line Graphs (A)
Year groups: 7, 8
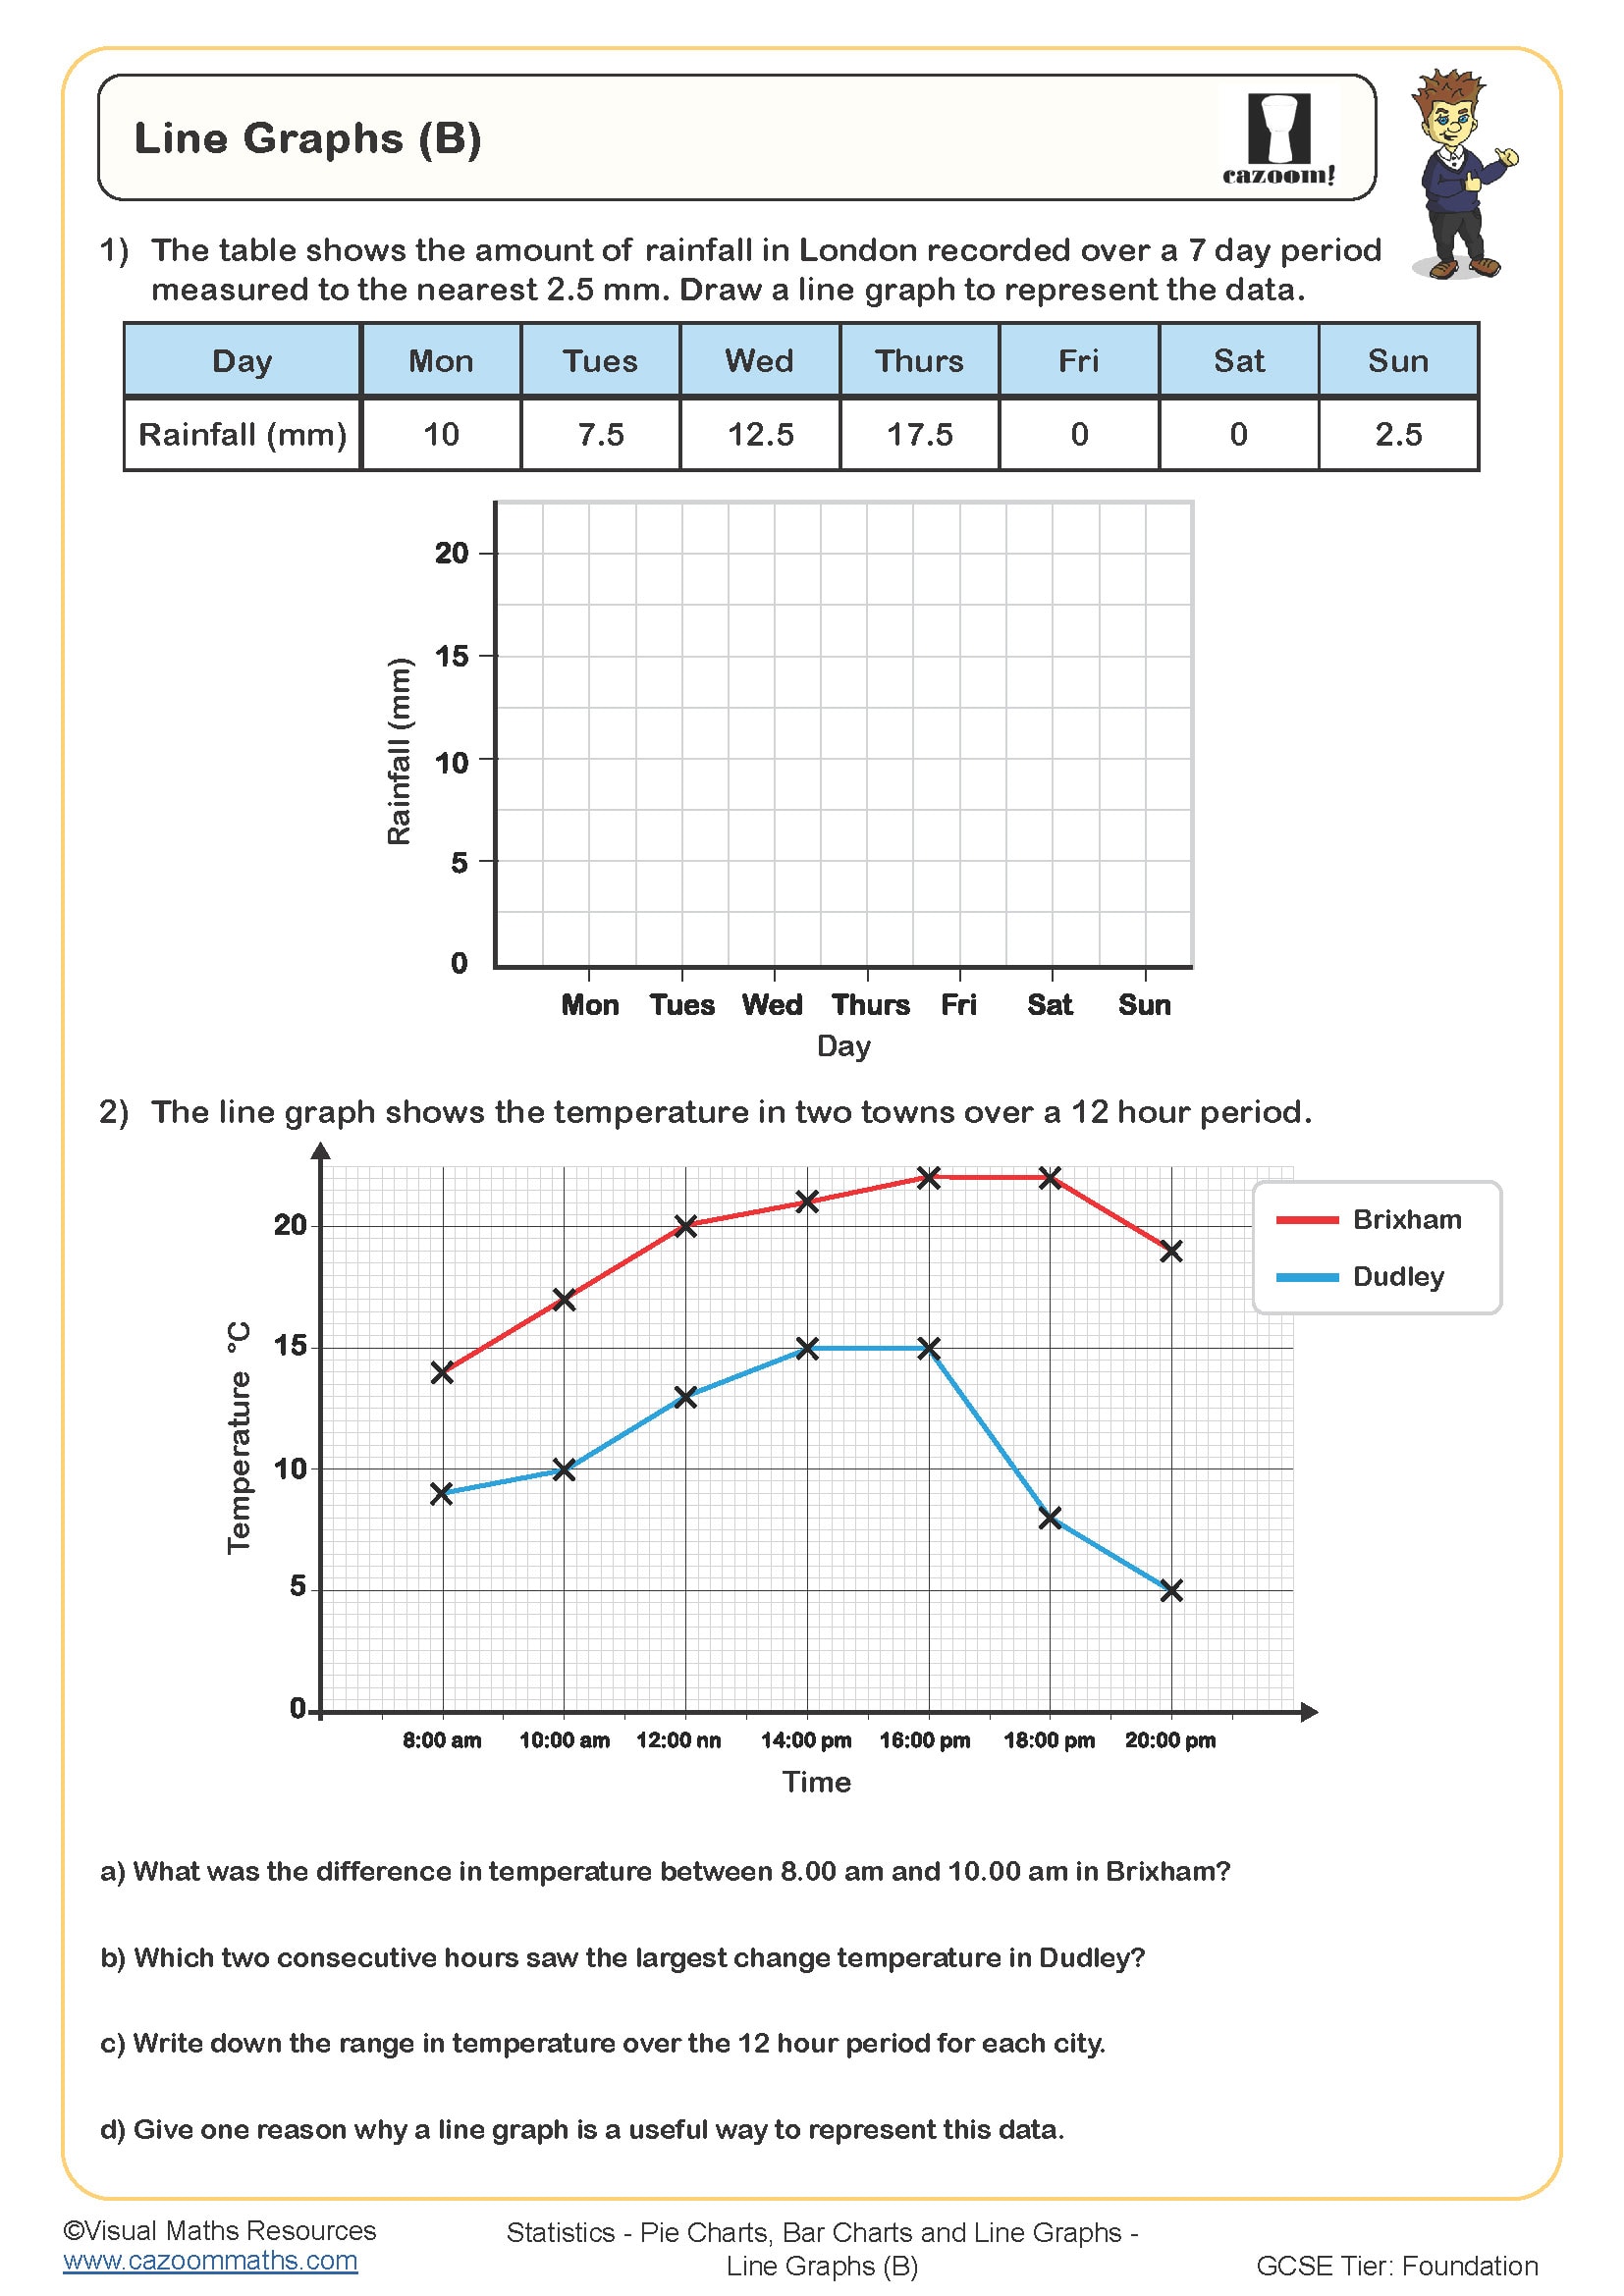
Line Graphs (B)
Year groups: 7, 8
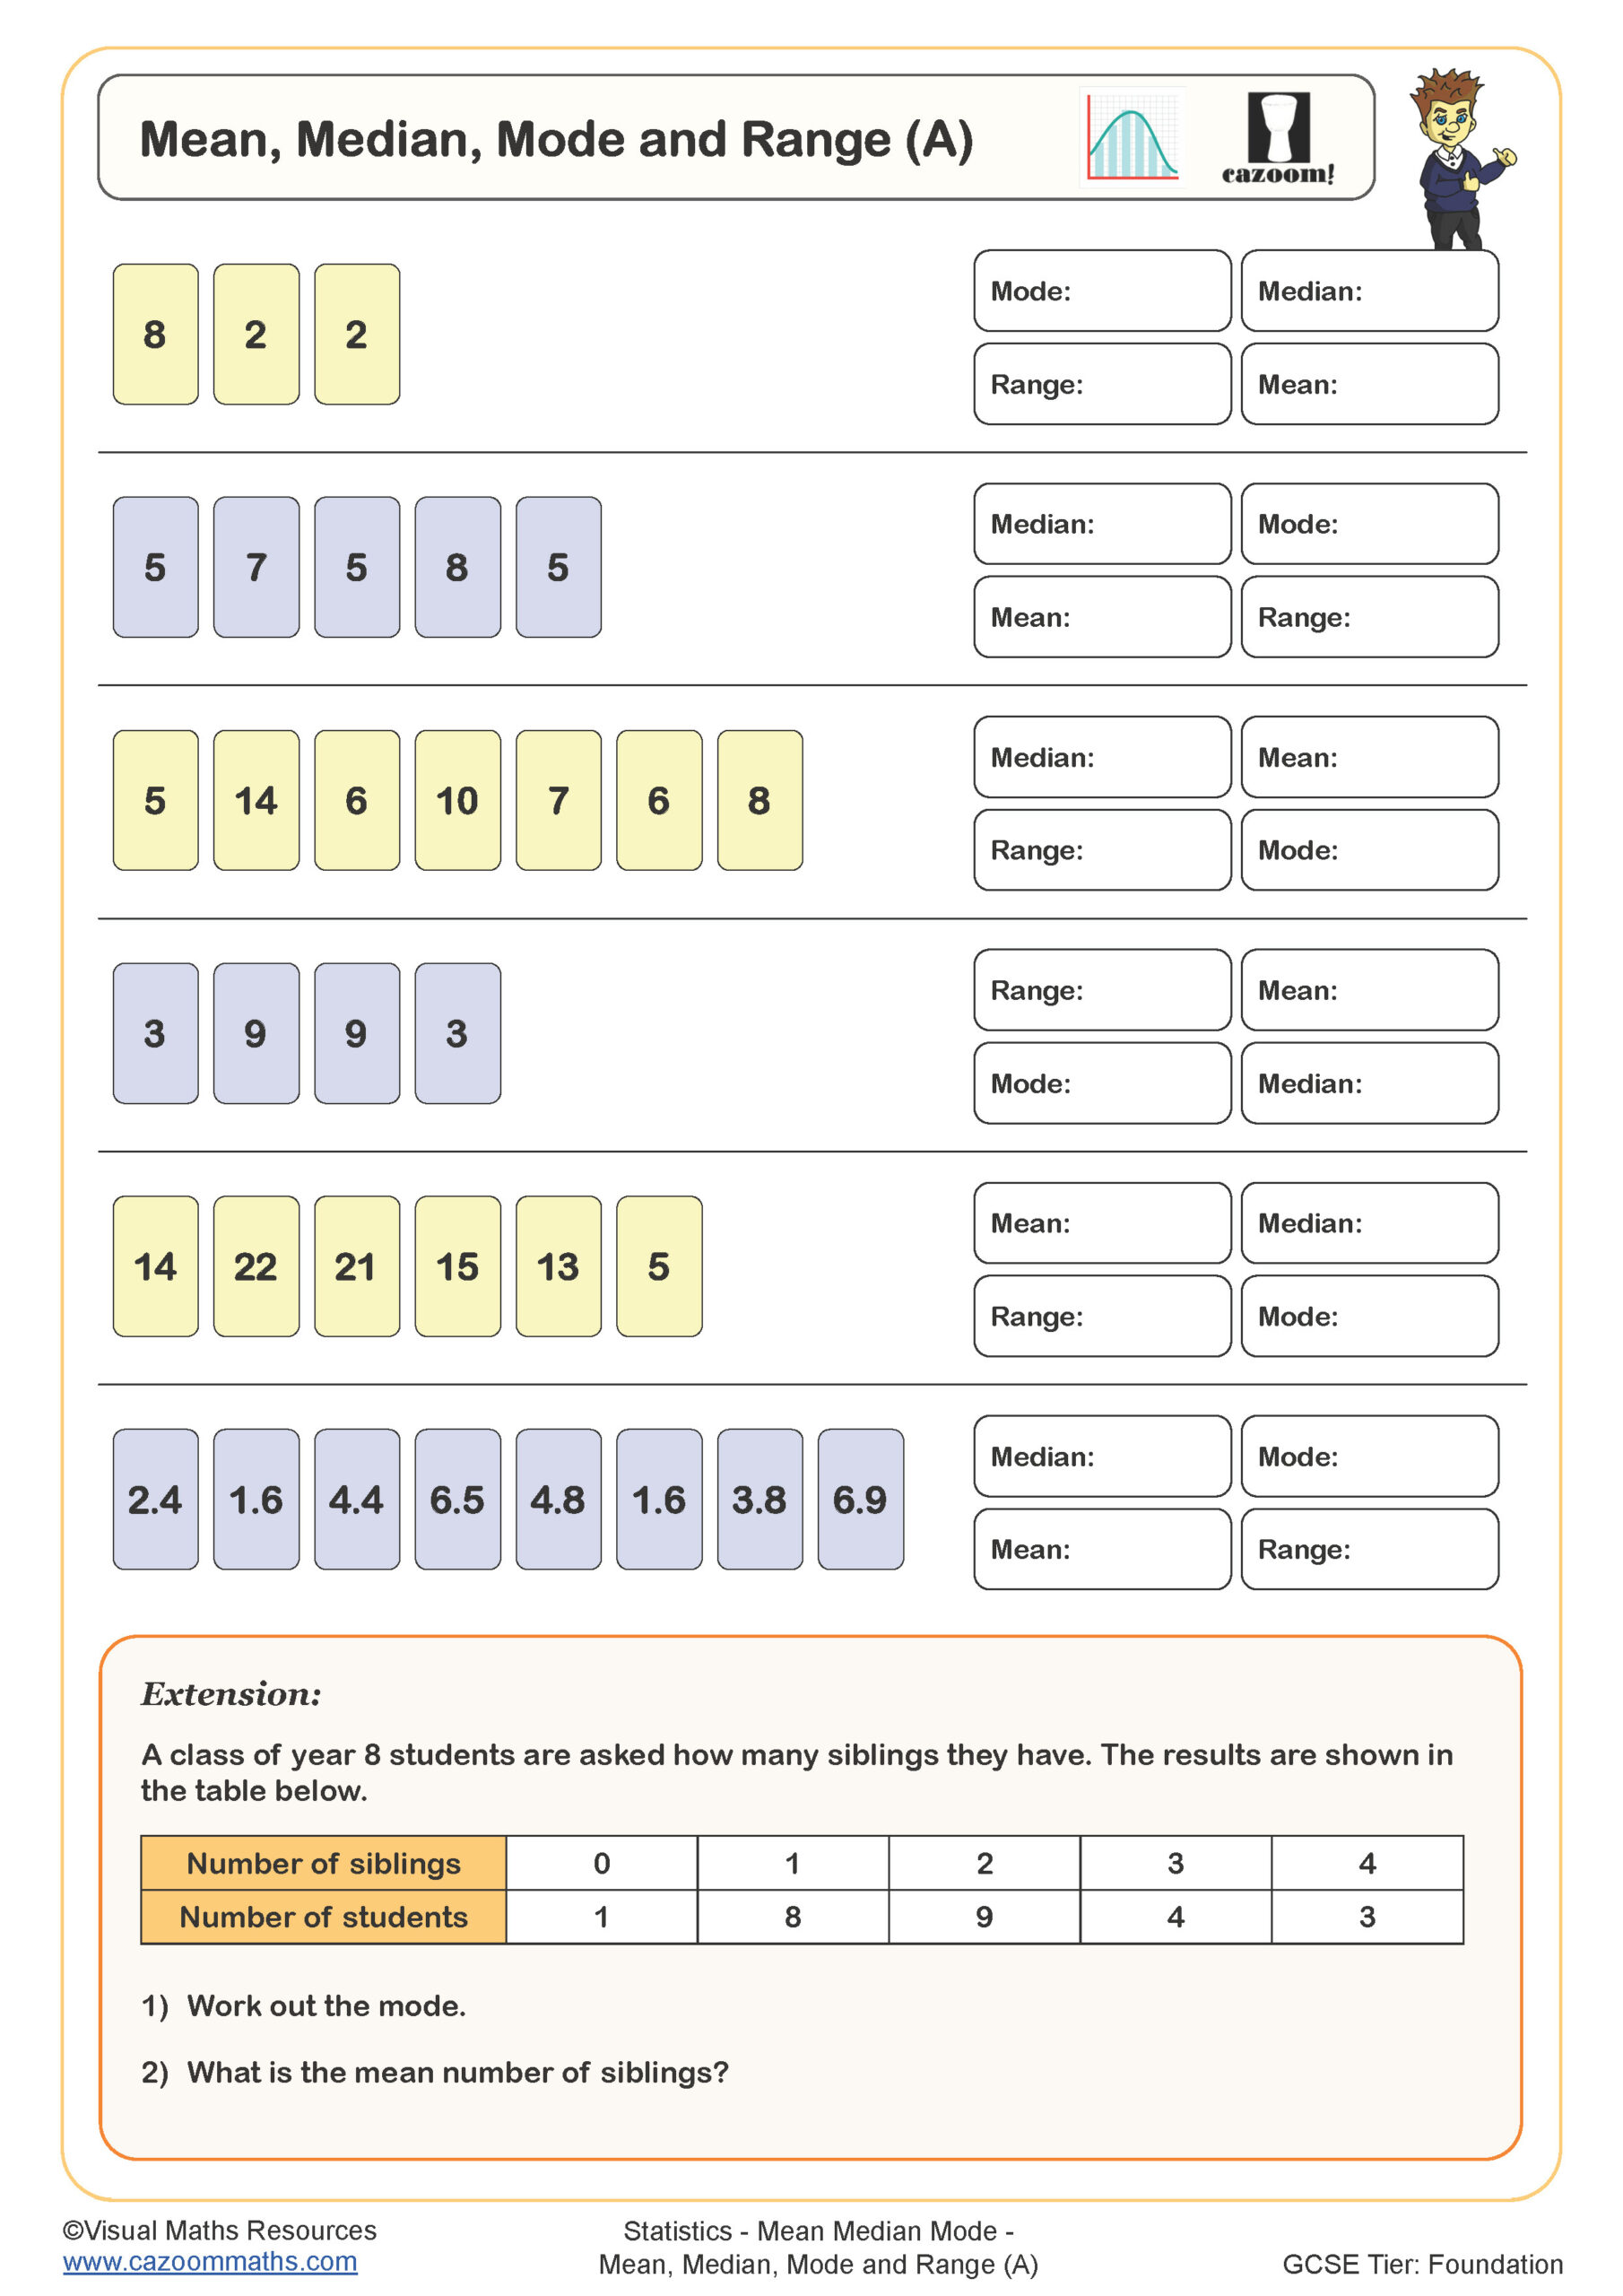
Mean, Median, Mode and Range (A)
Year groups: 7, 8
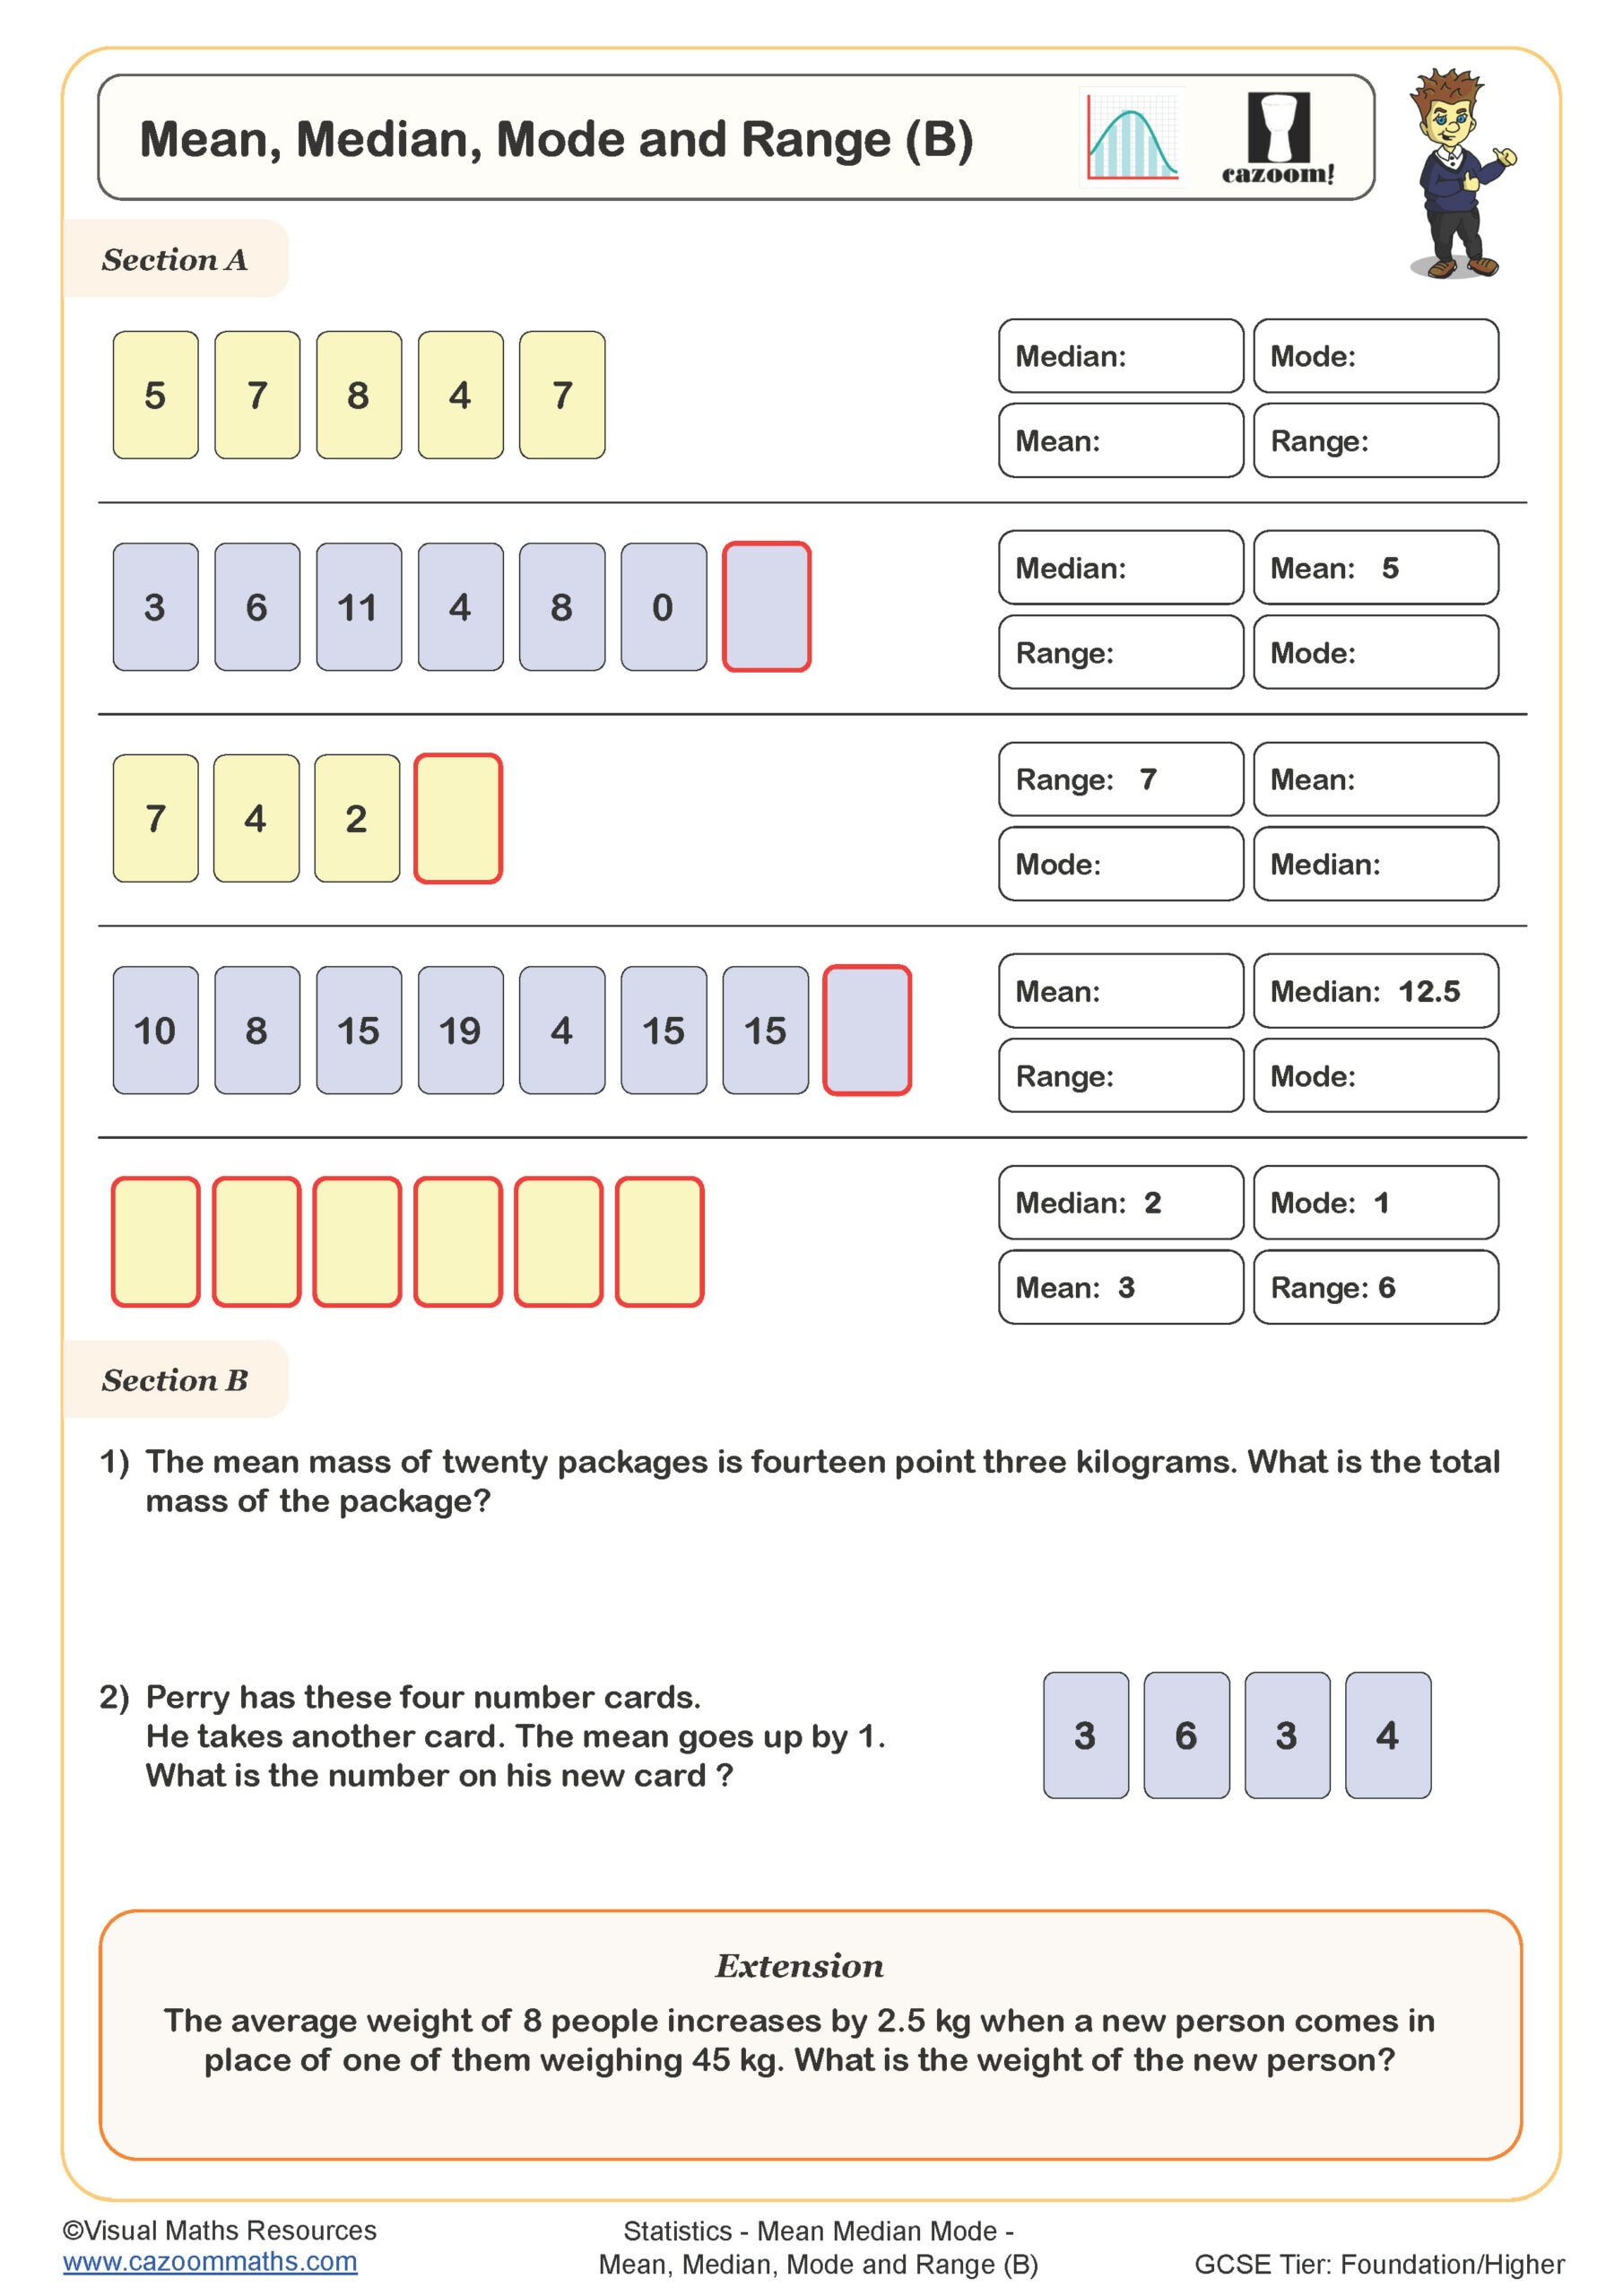
Mean, Median, Mode and Range (B)
Year groups: 7, 8
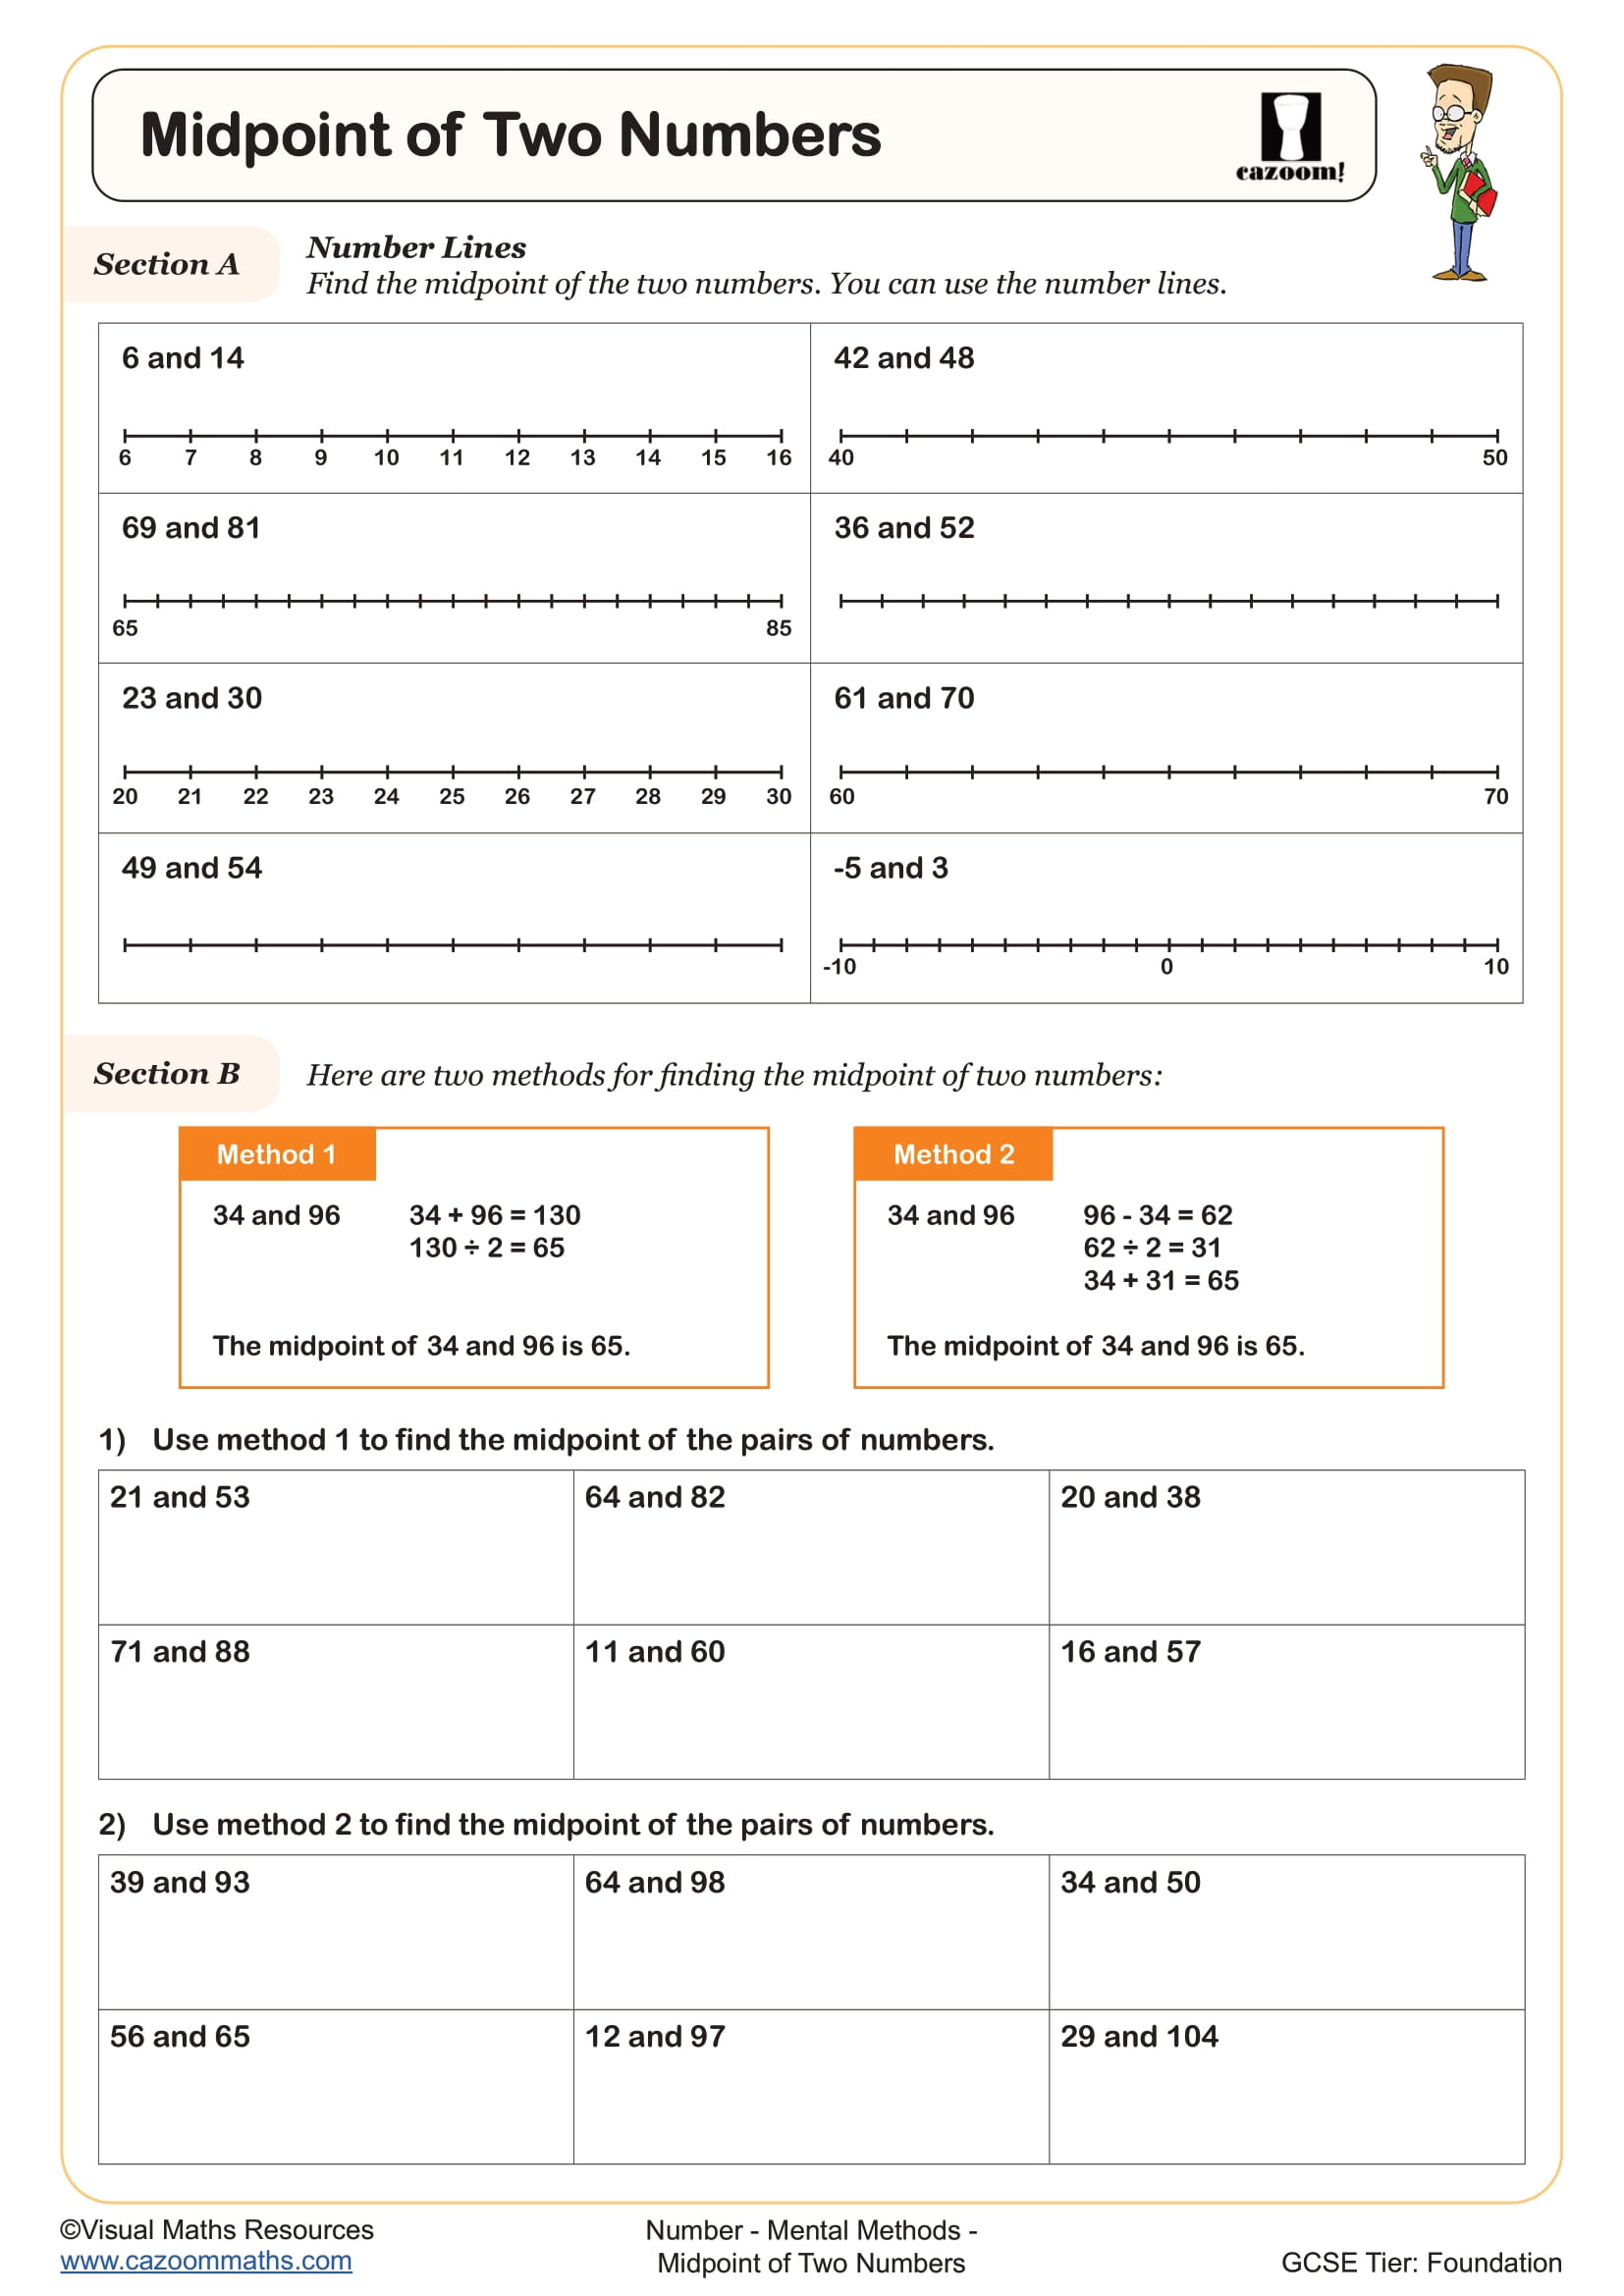
Midpoint of Two Numbers
Year groups: 7
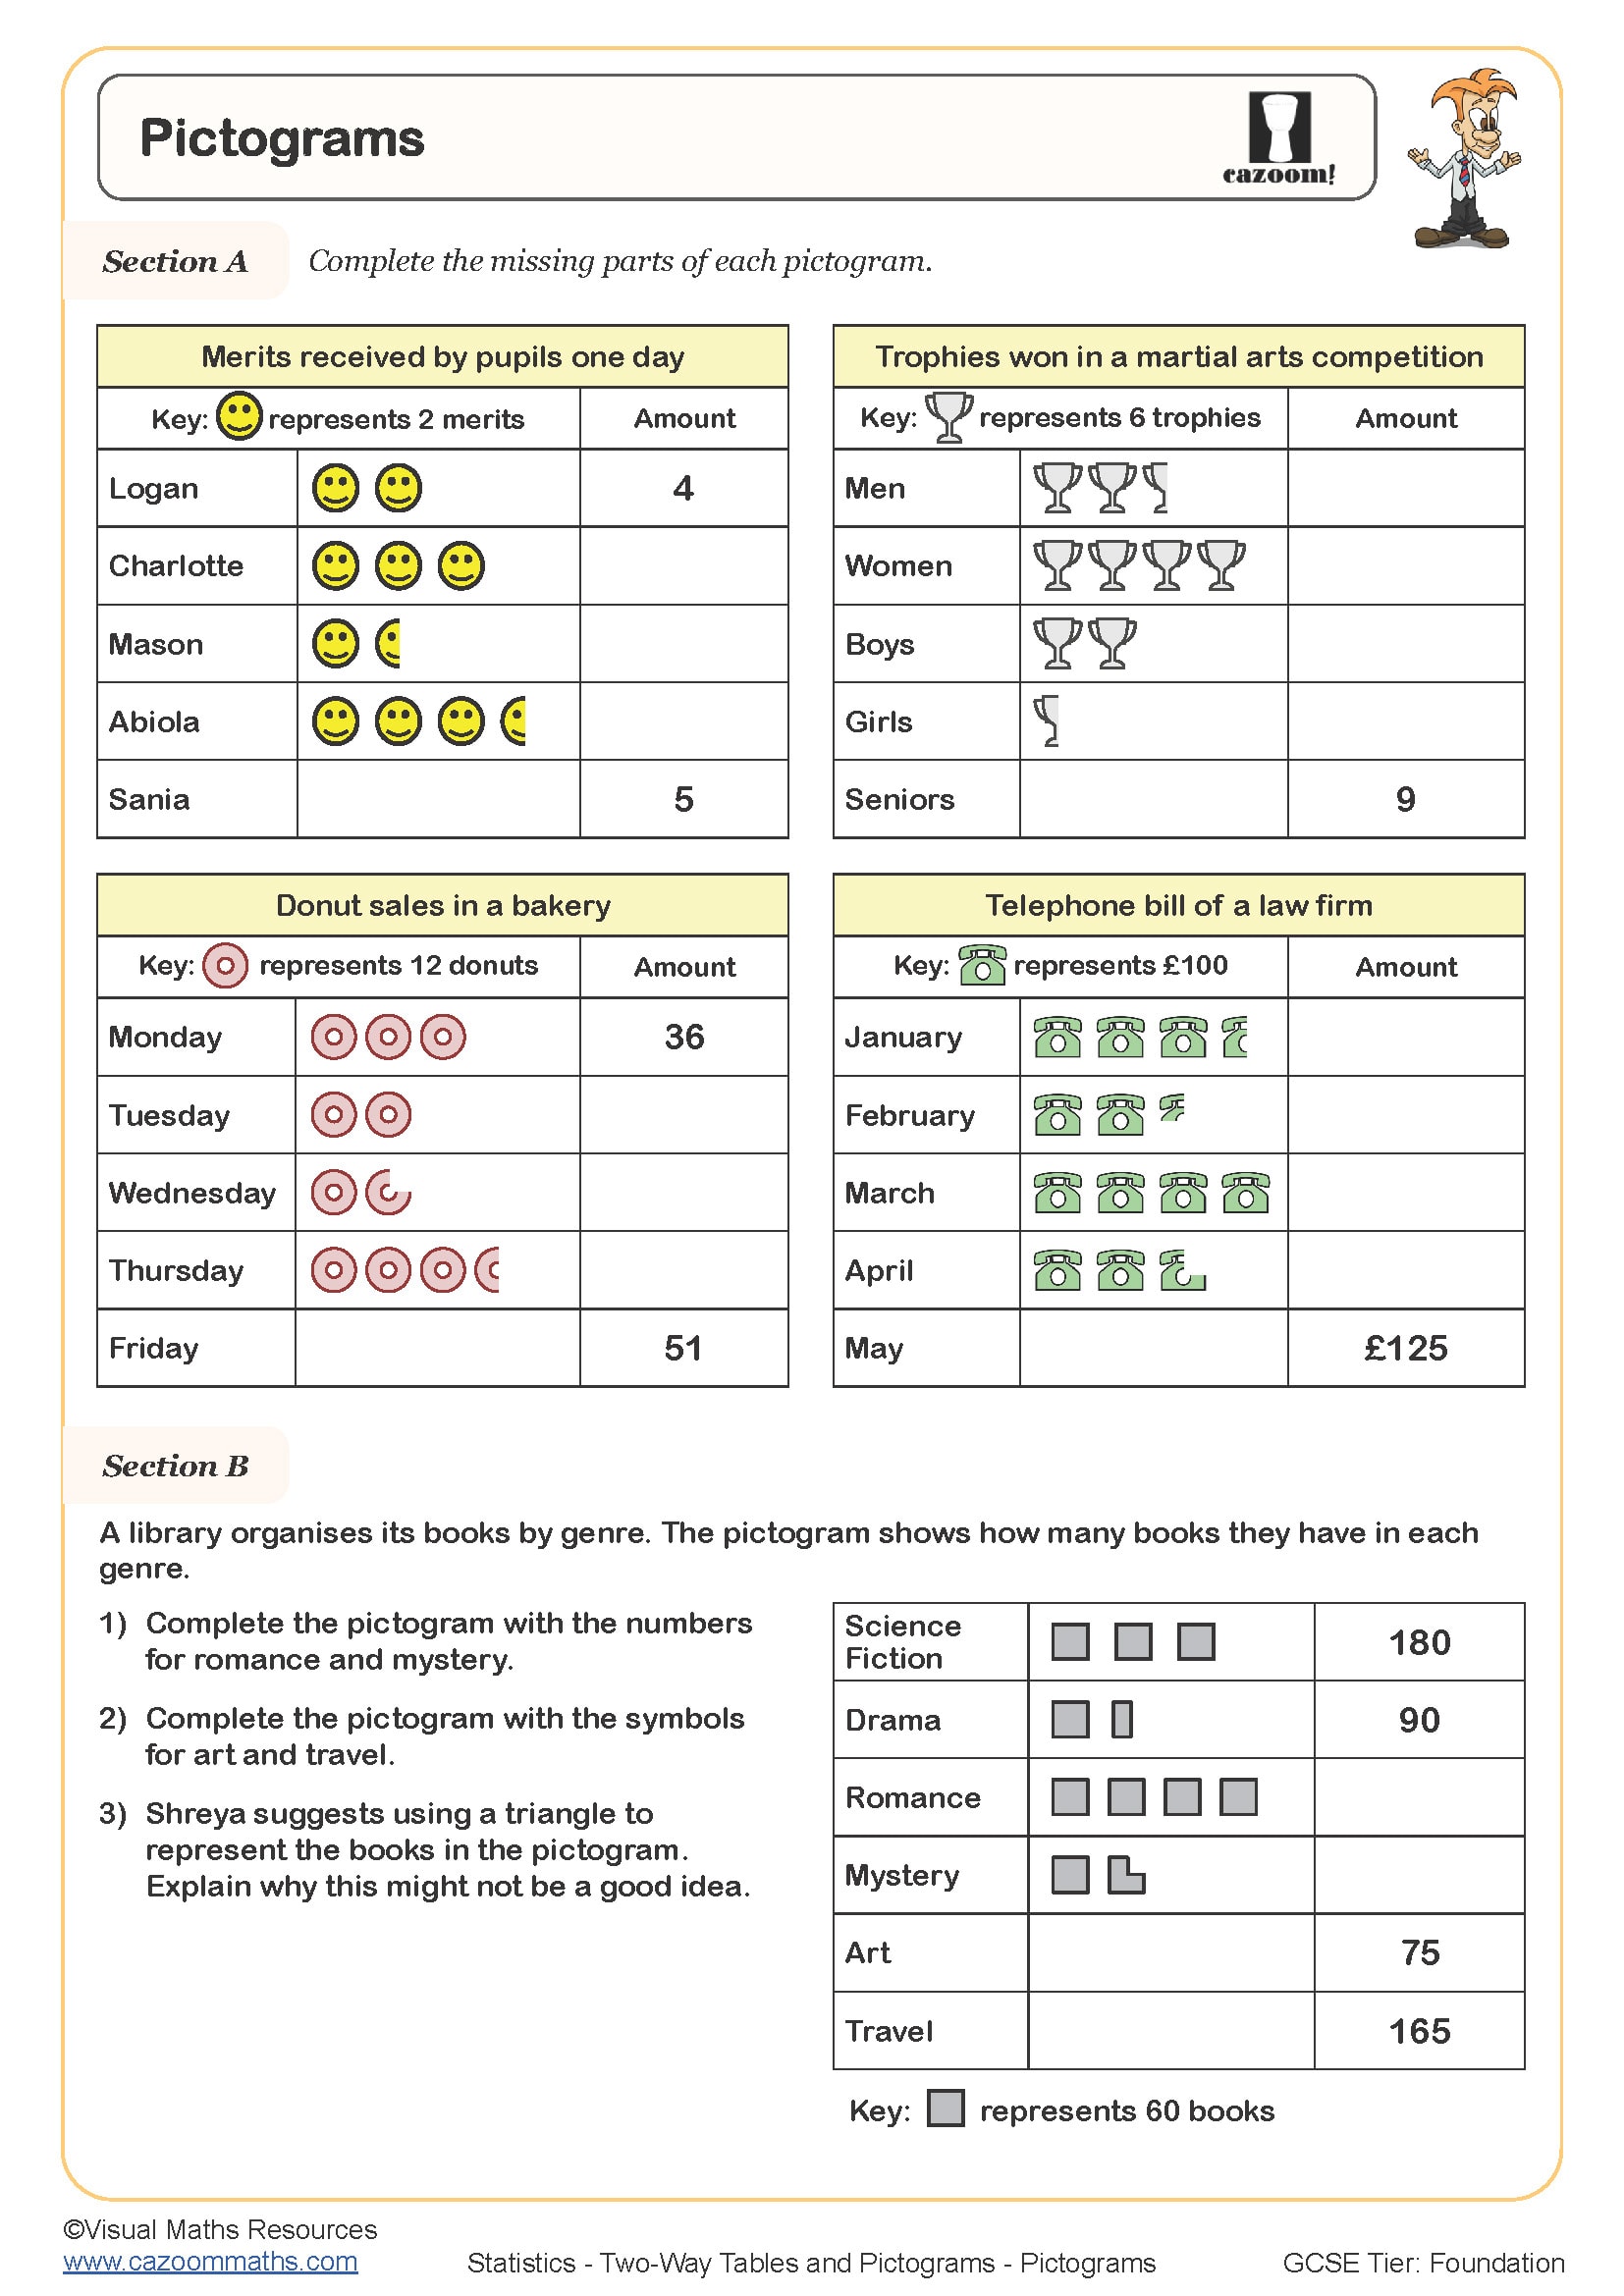
Pictograms
Year groups: 7, 8
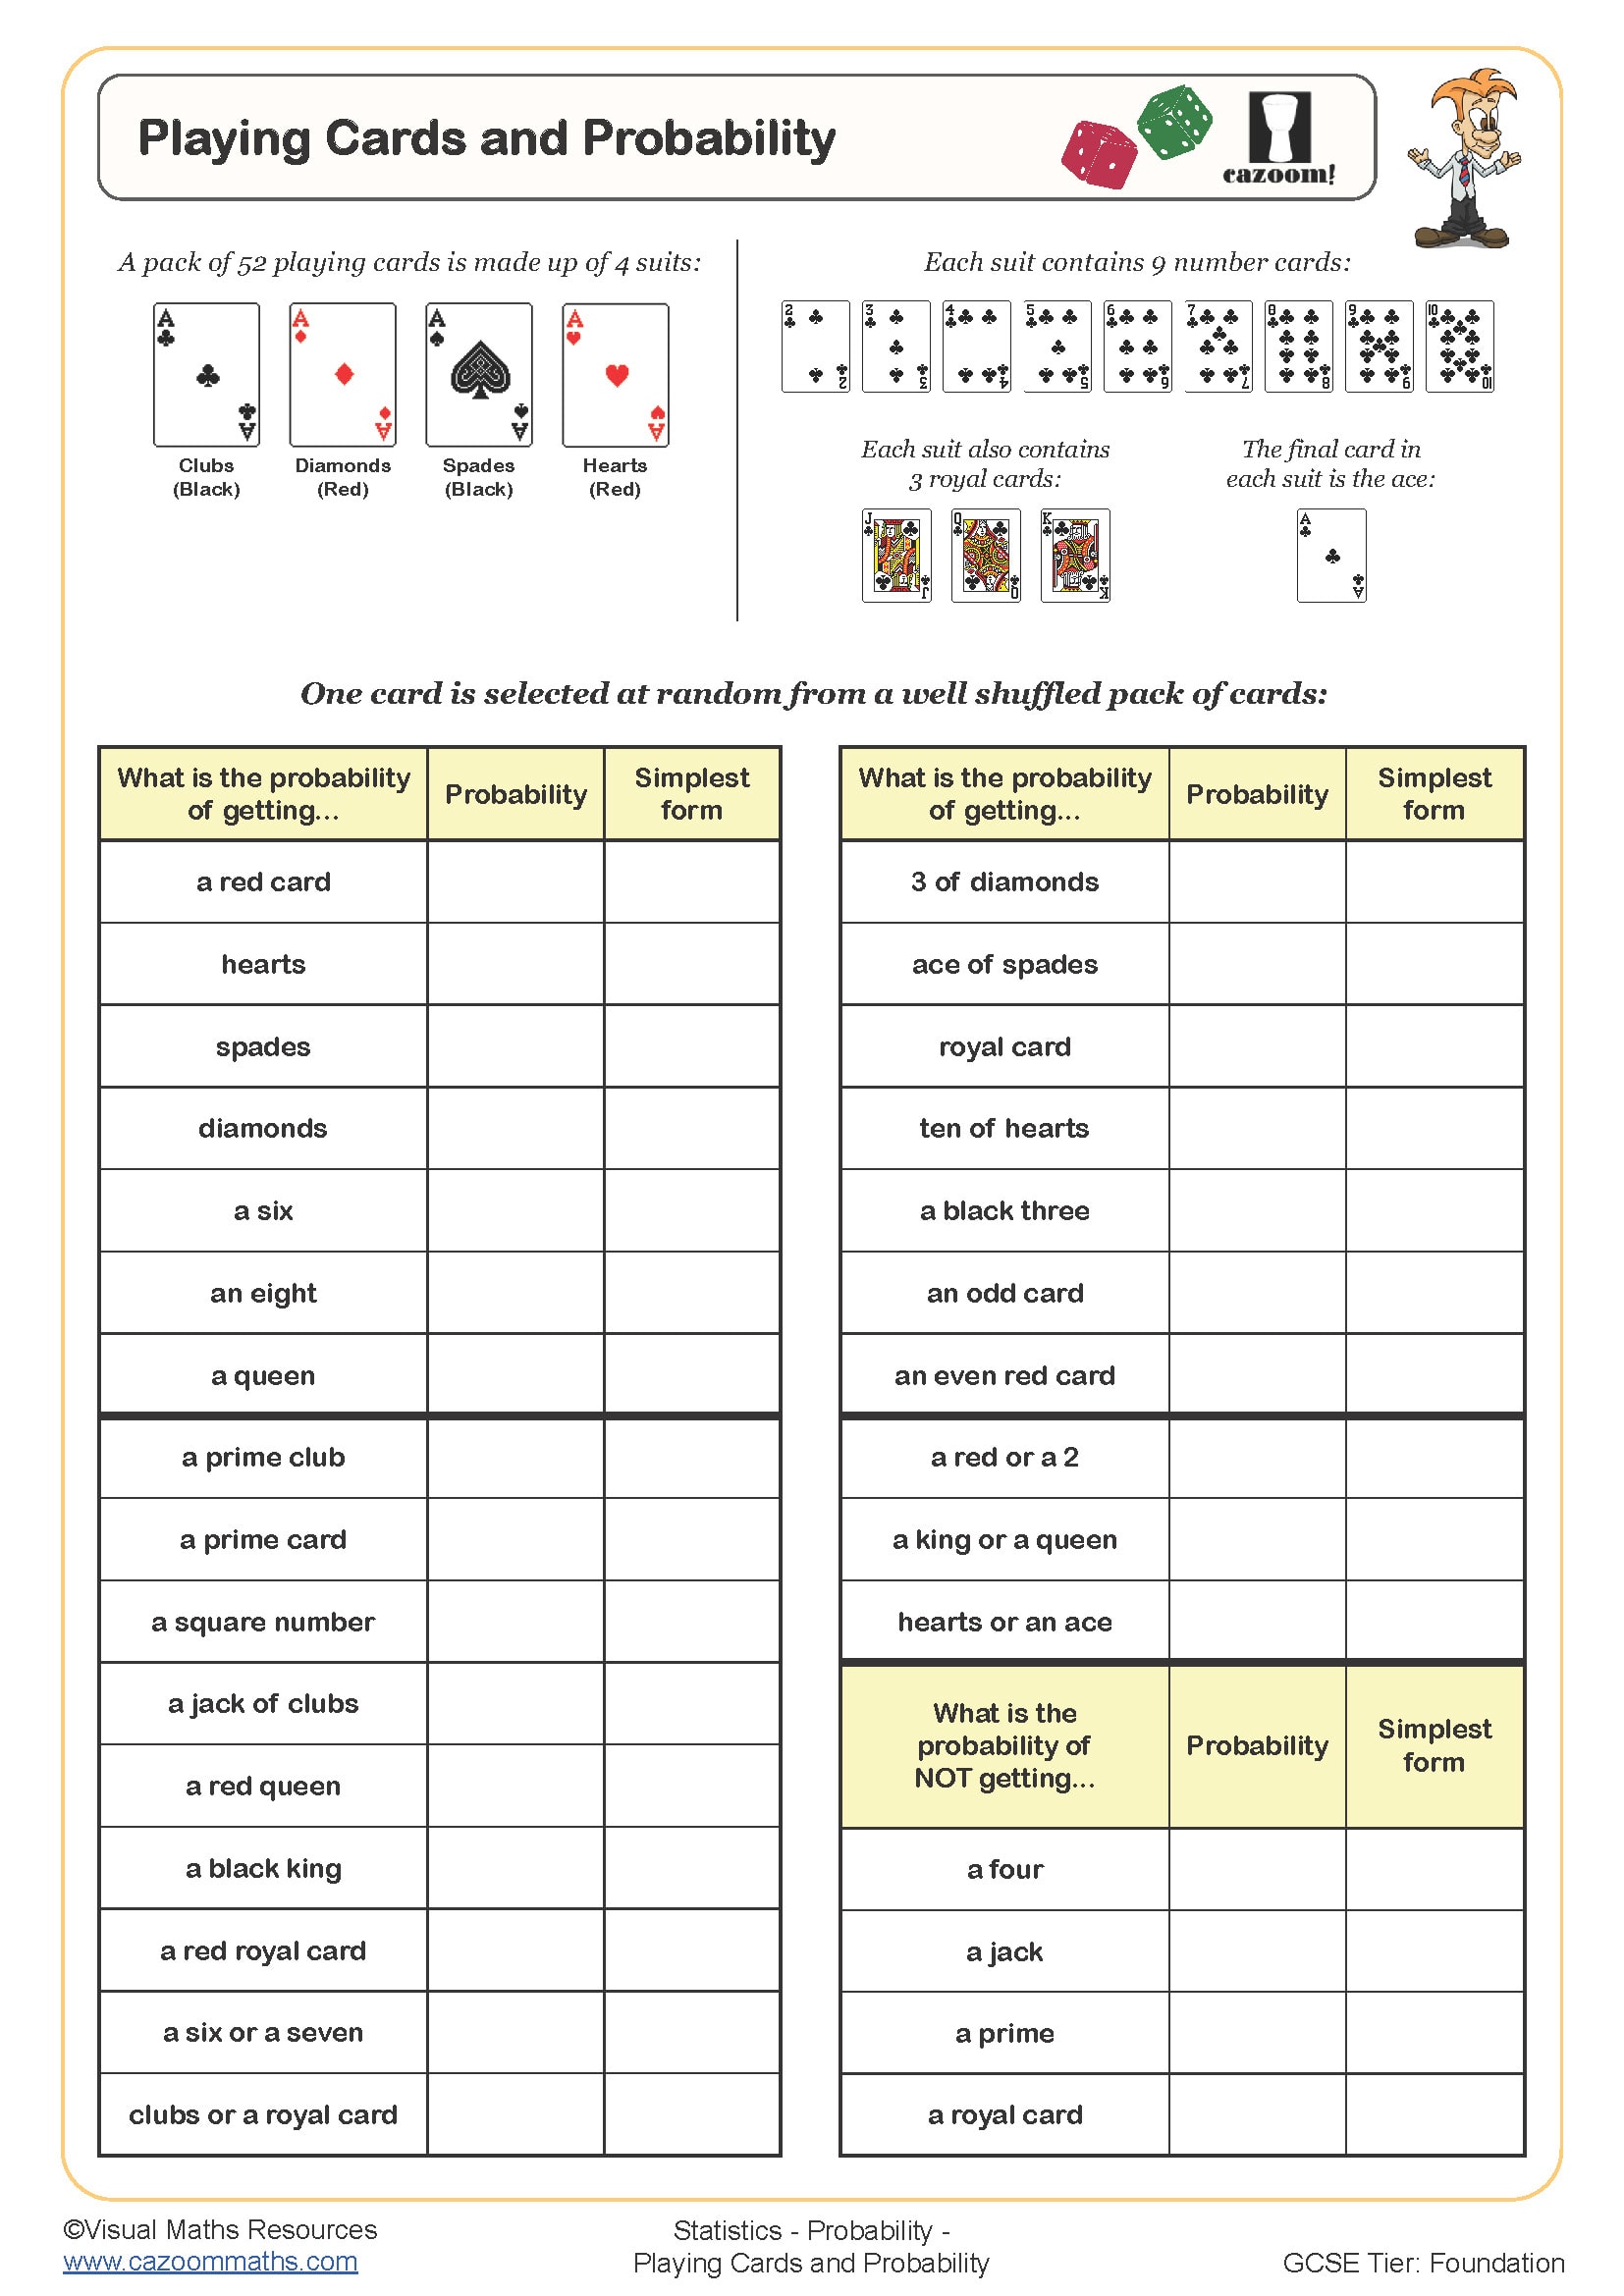
Playing Cards and Probability
Year groups: 7, 8, 9
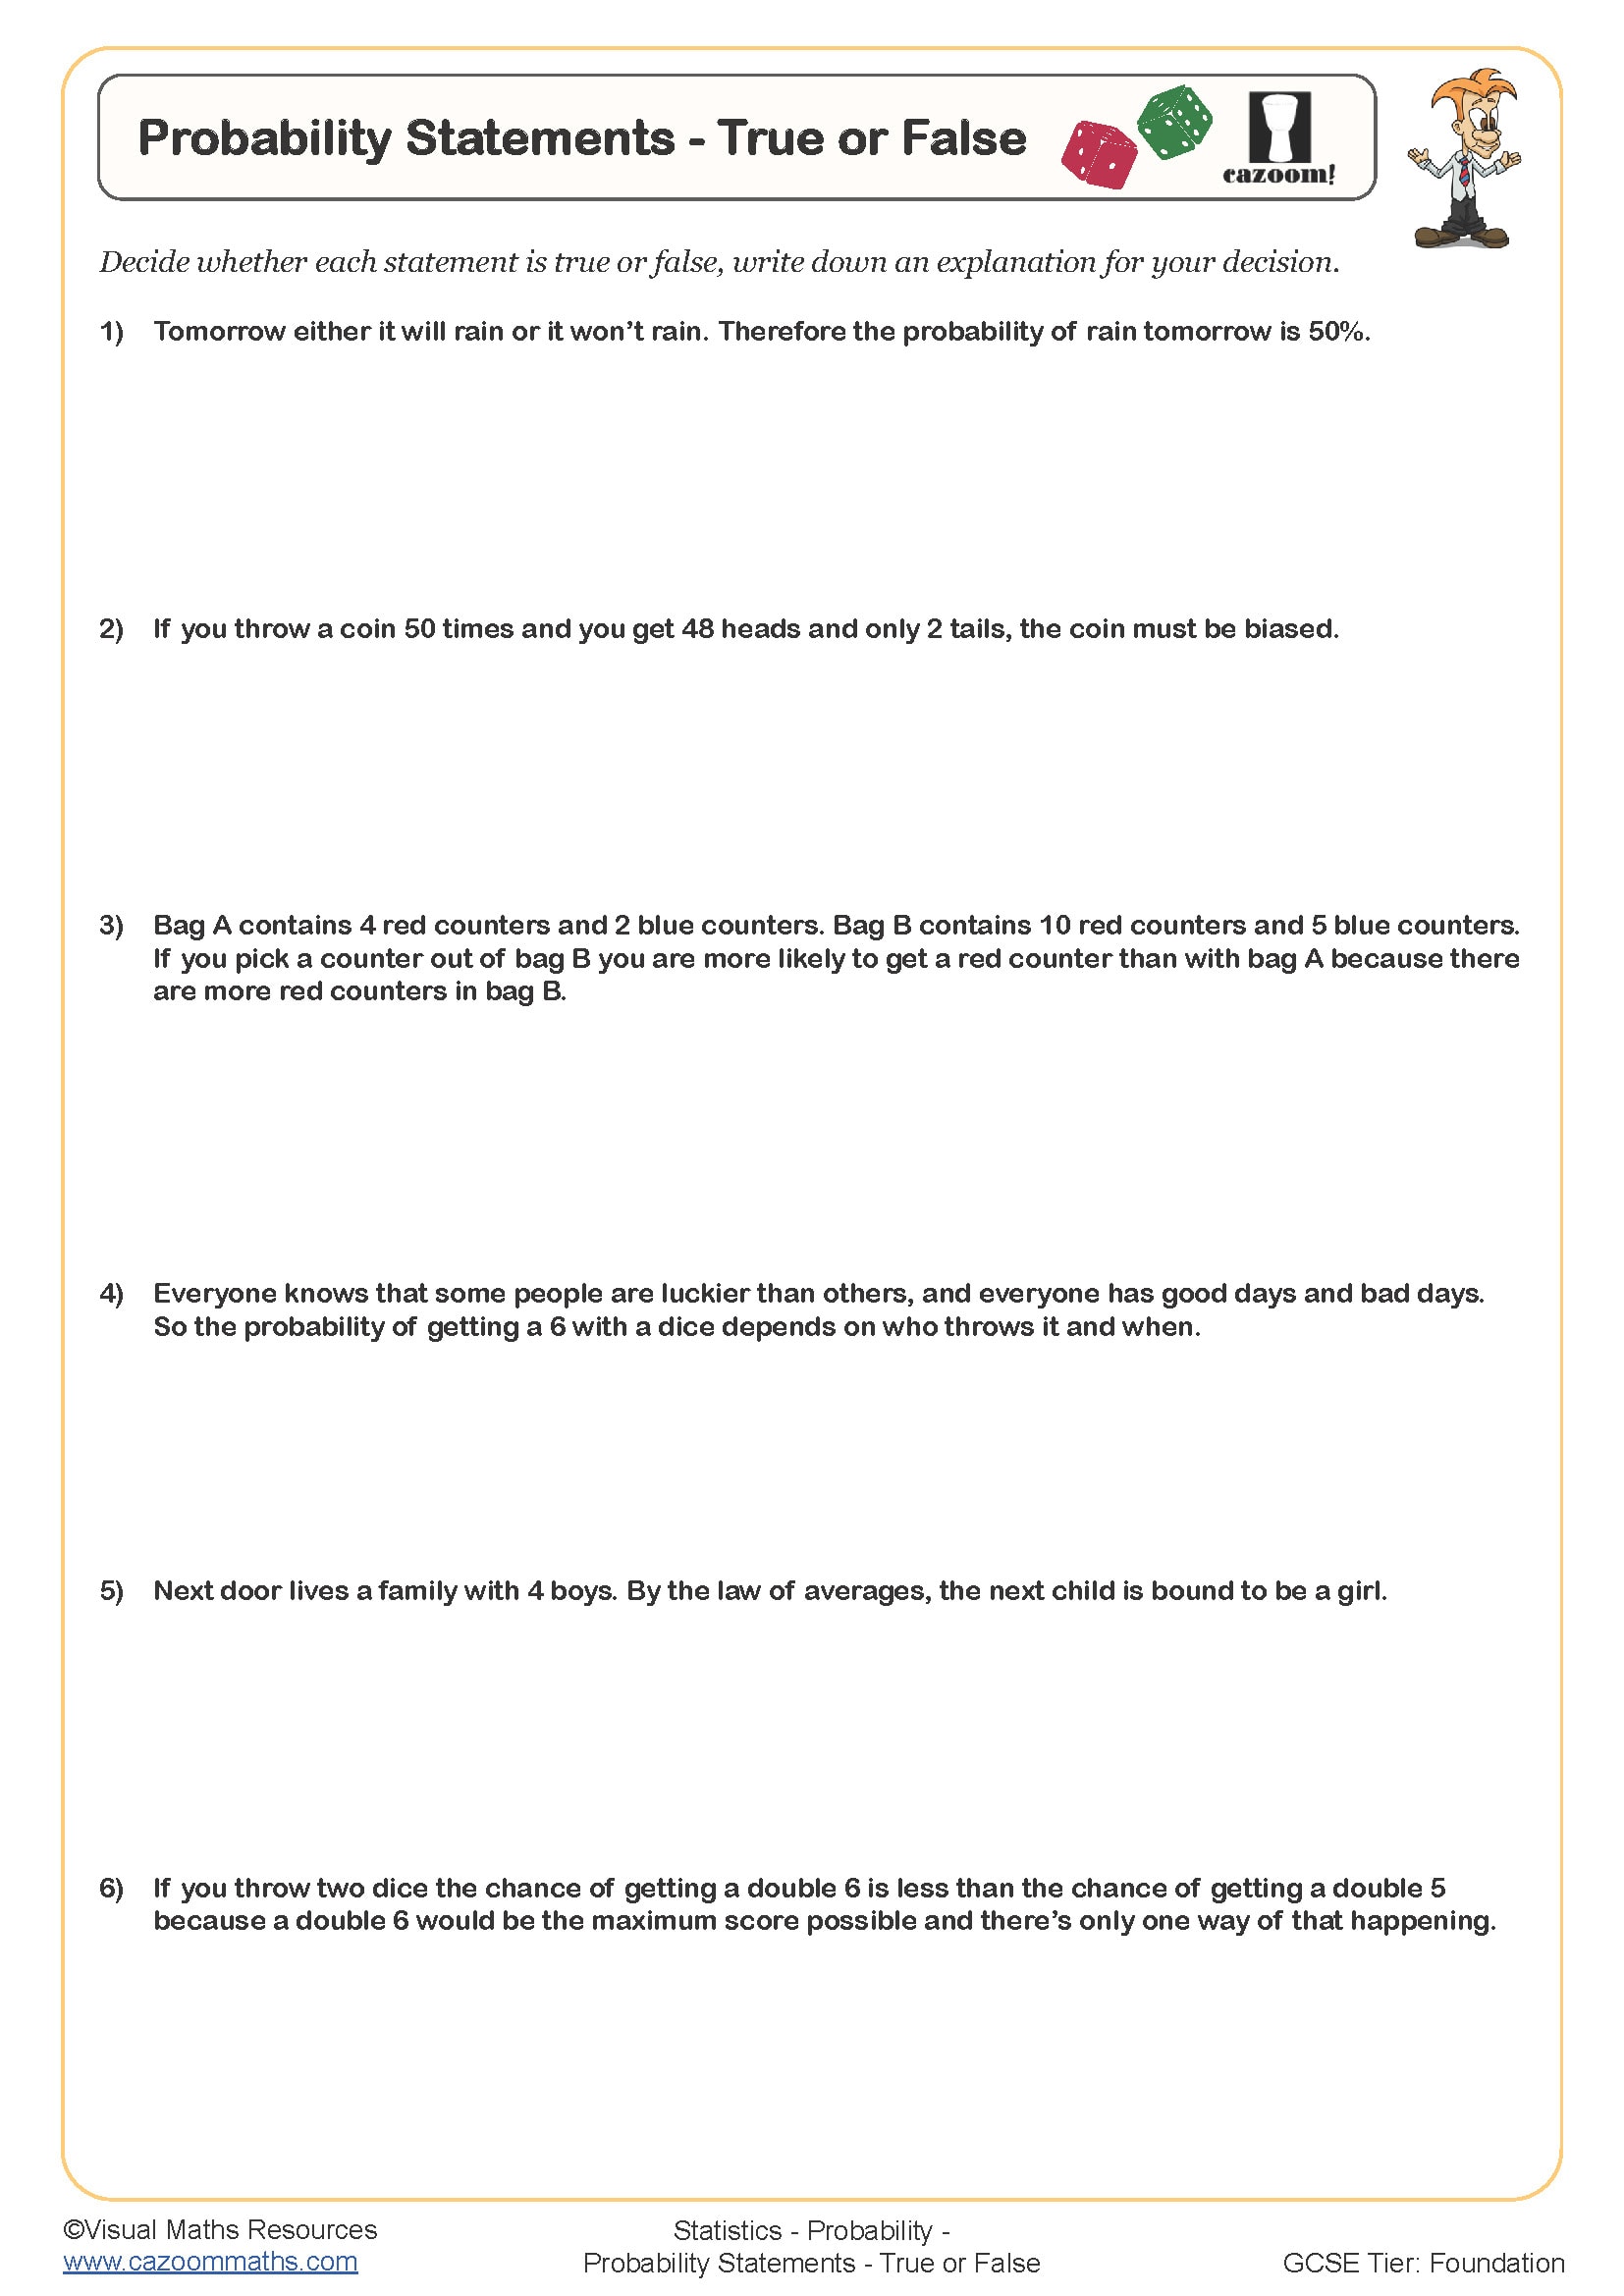
Probability Statements - True or False
Year groups: 7, 8, 9
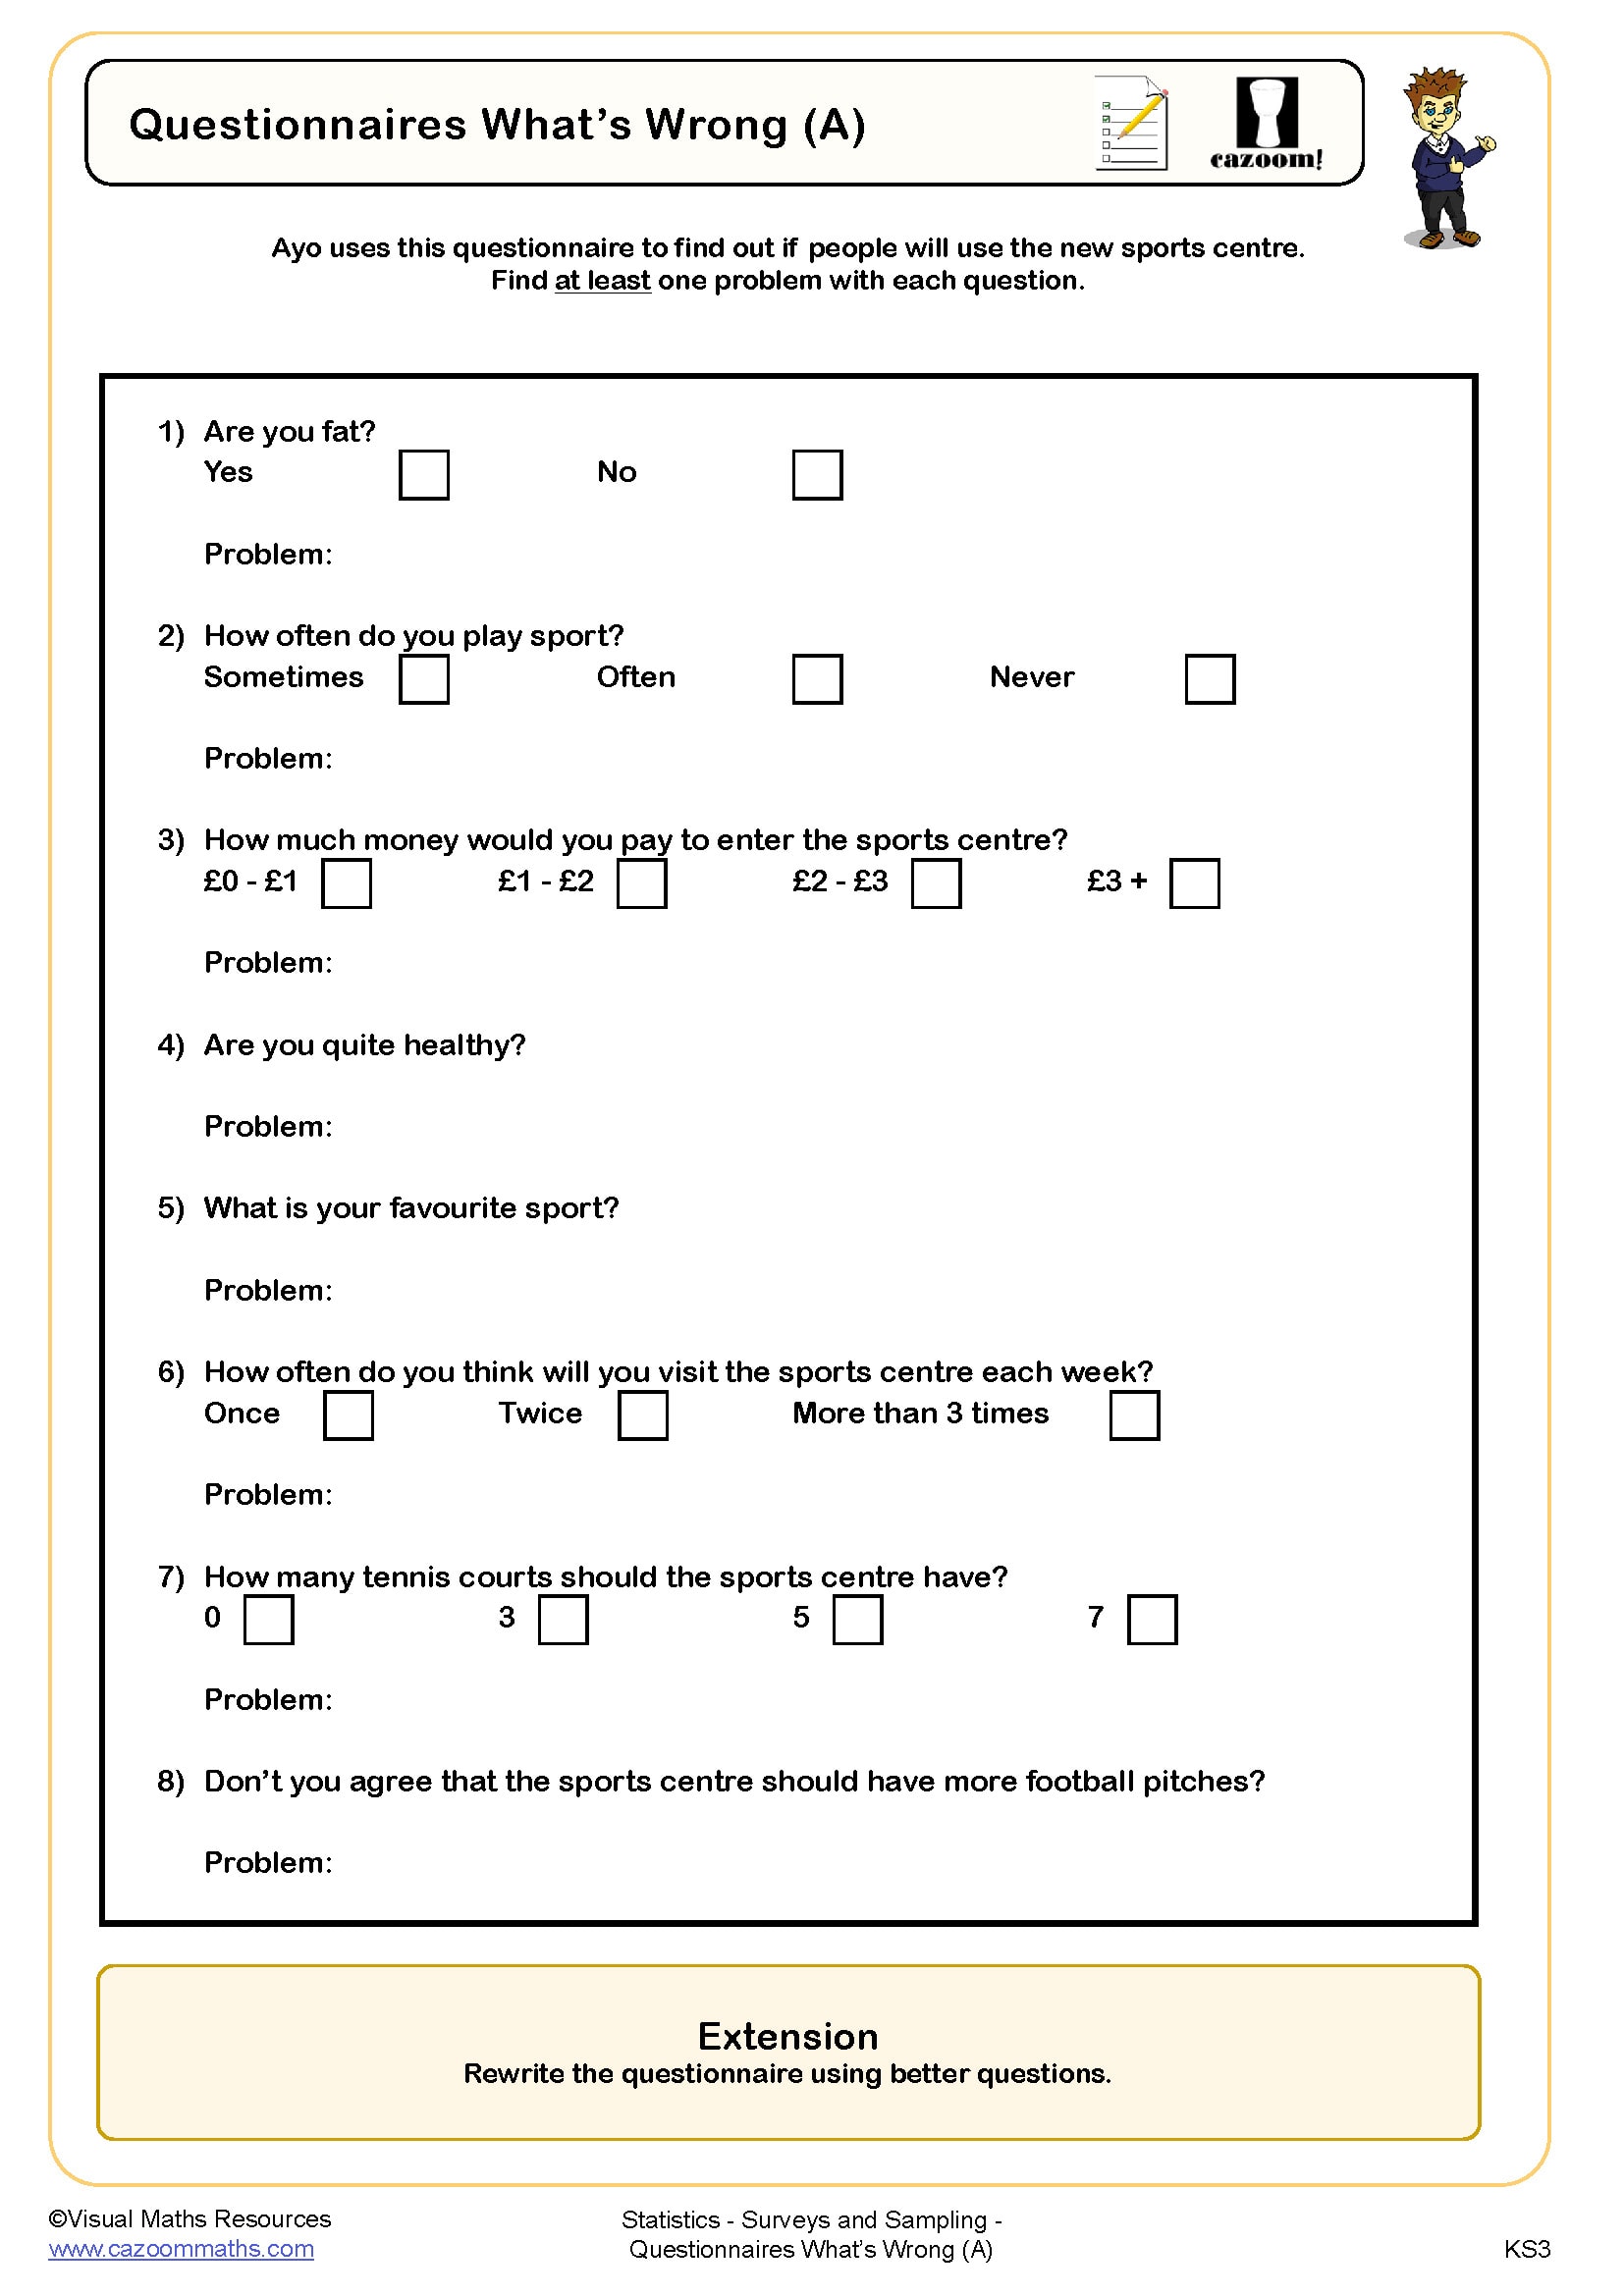
Questionnaires What's Wrong (A)
Year groups: 7, 8
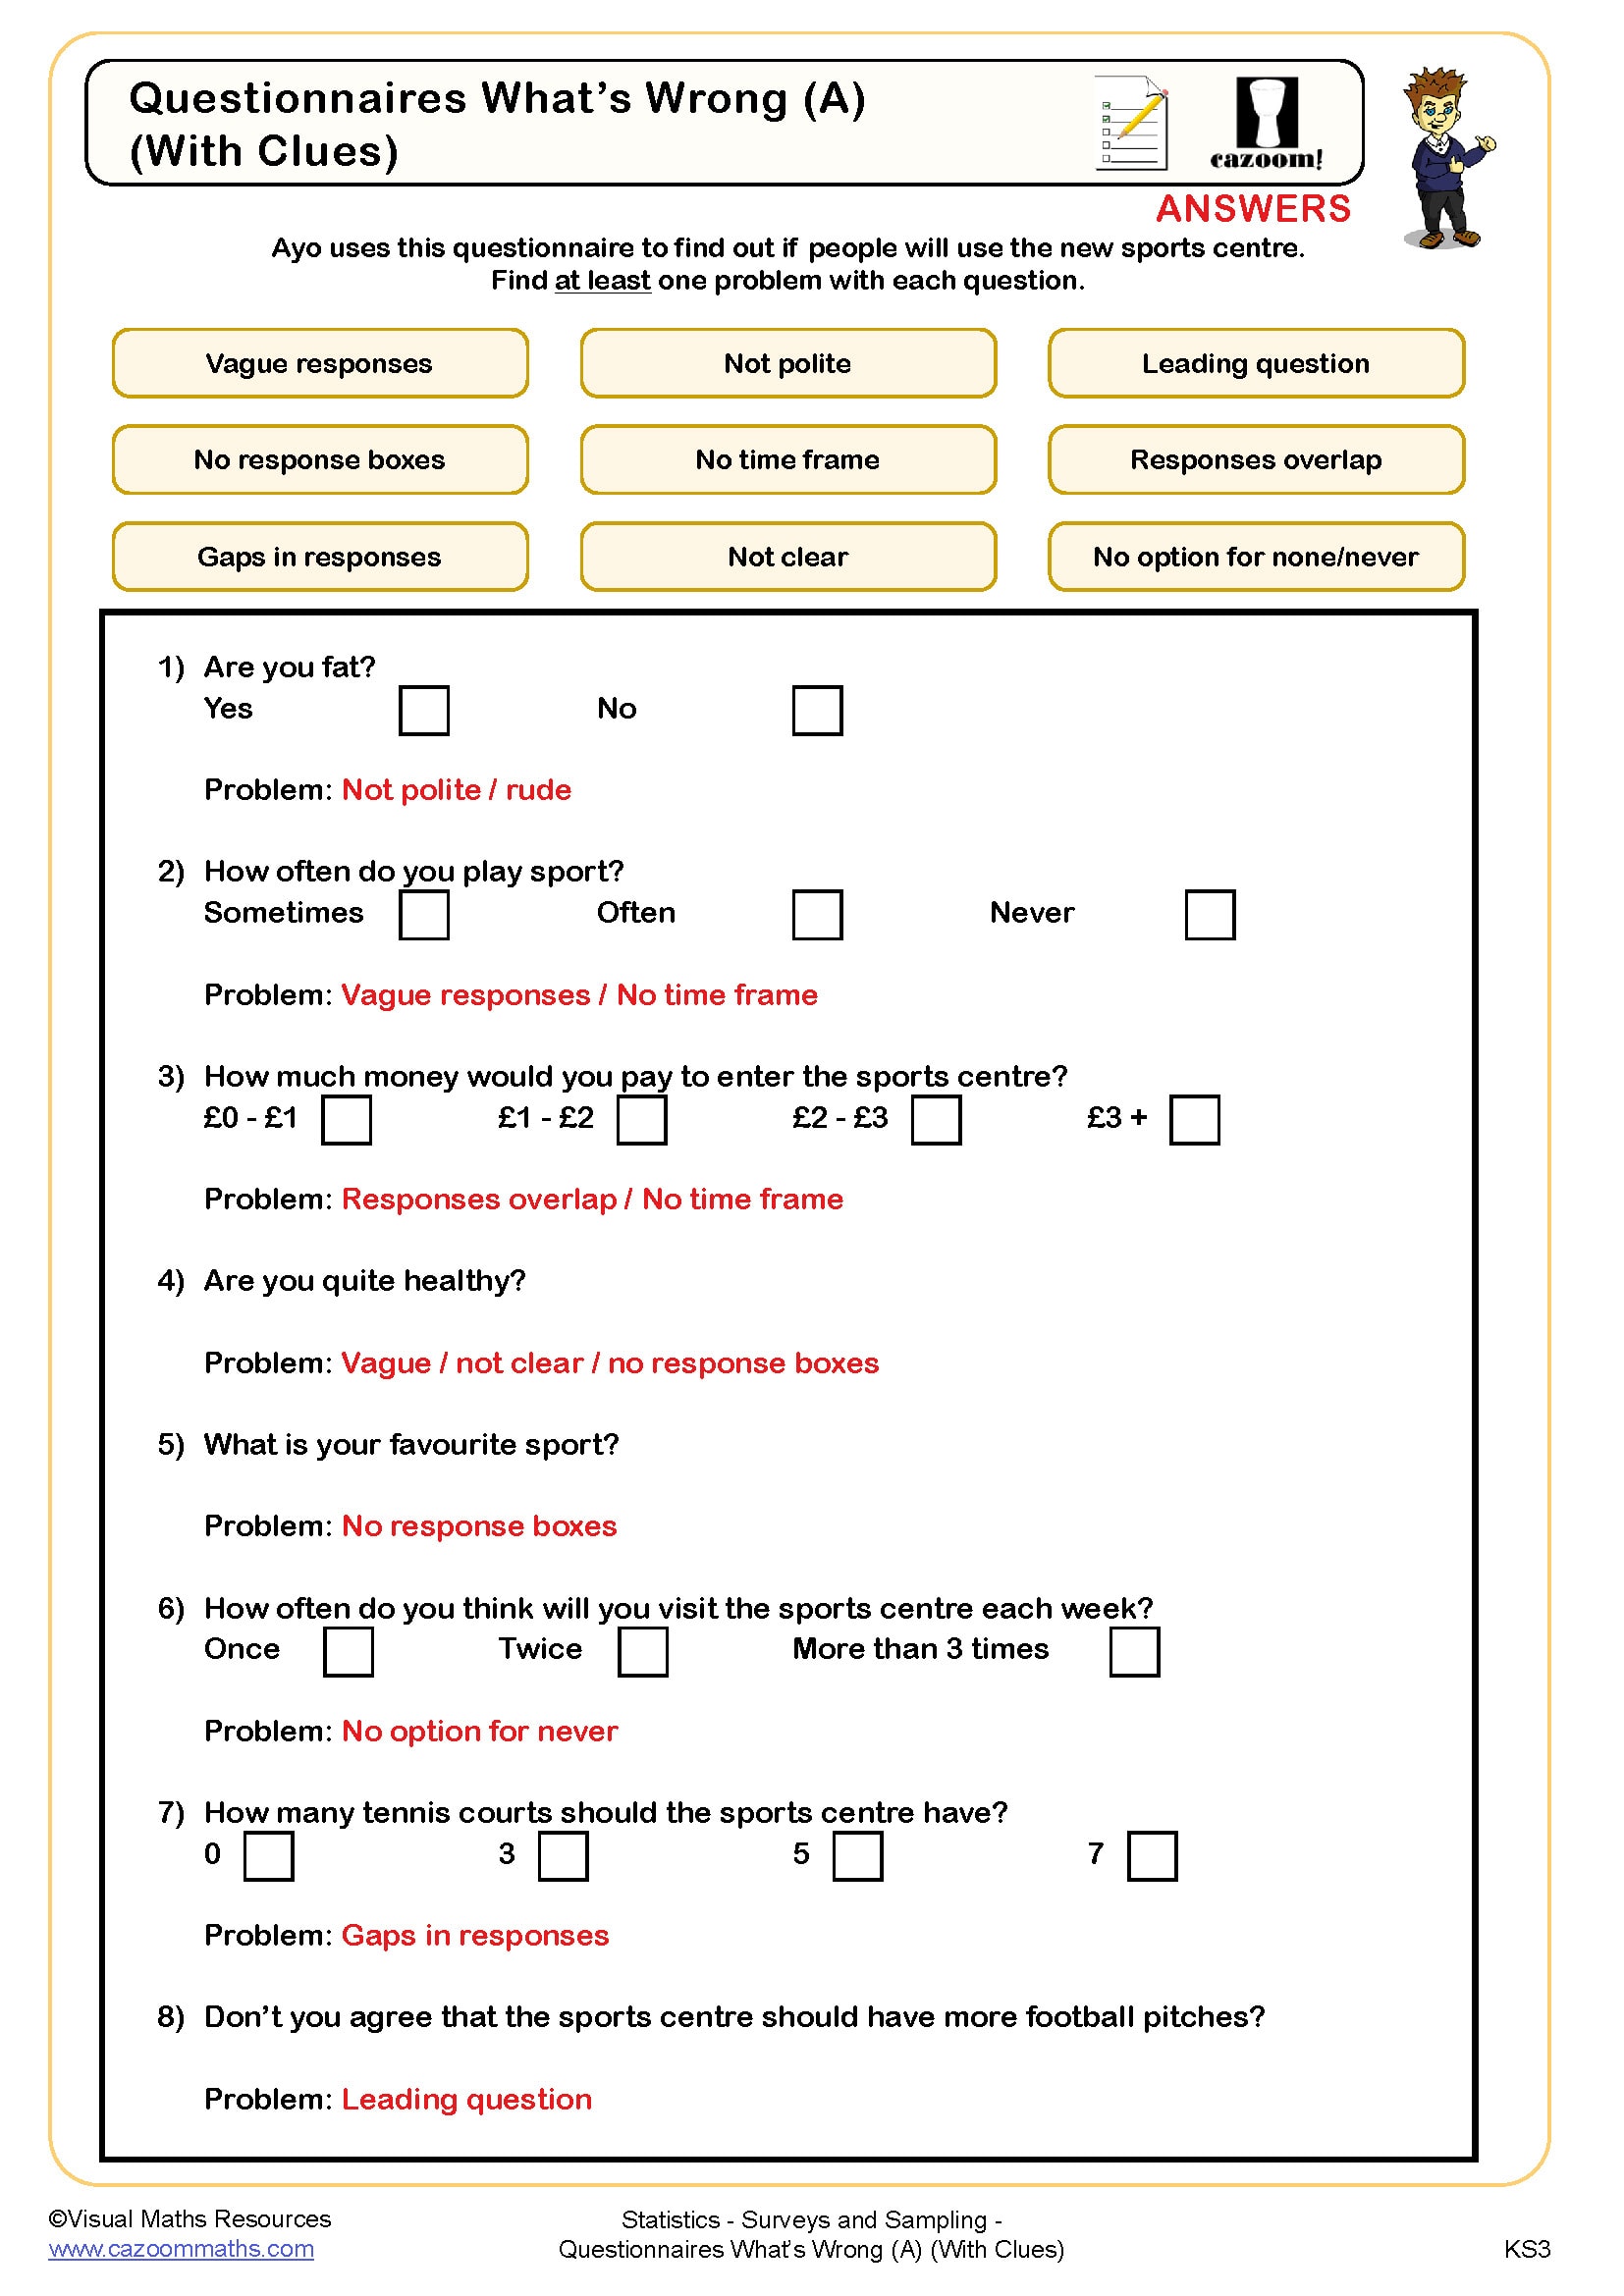
Questionnaires What's Wrong (A) (With Clues)
Year groups: 7, 8
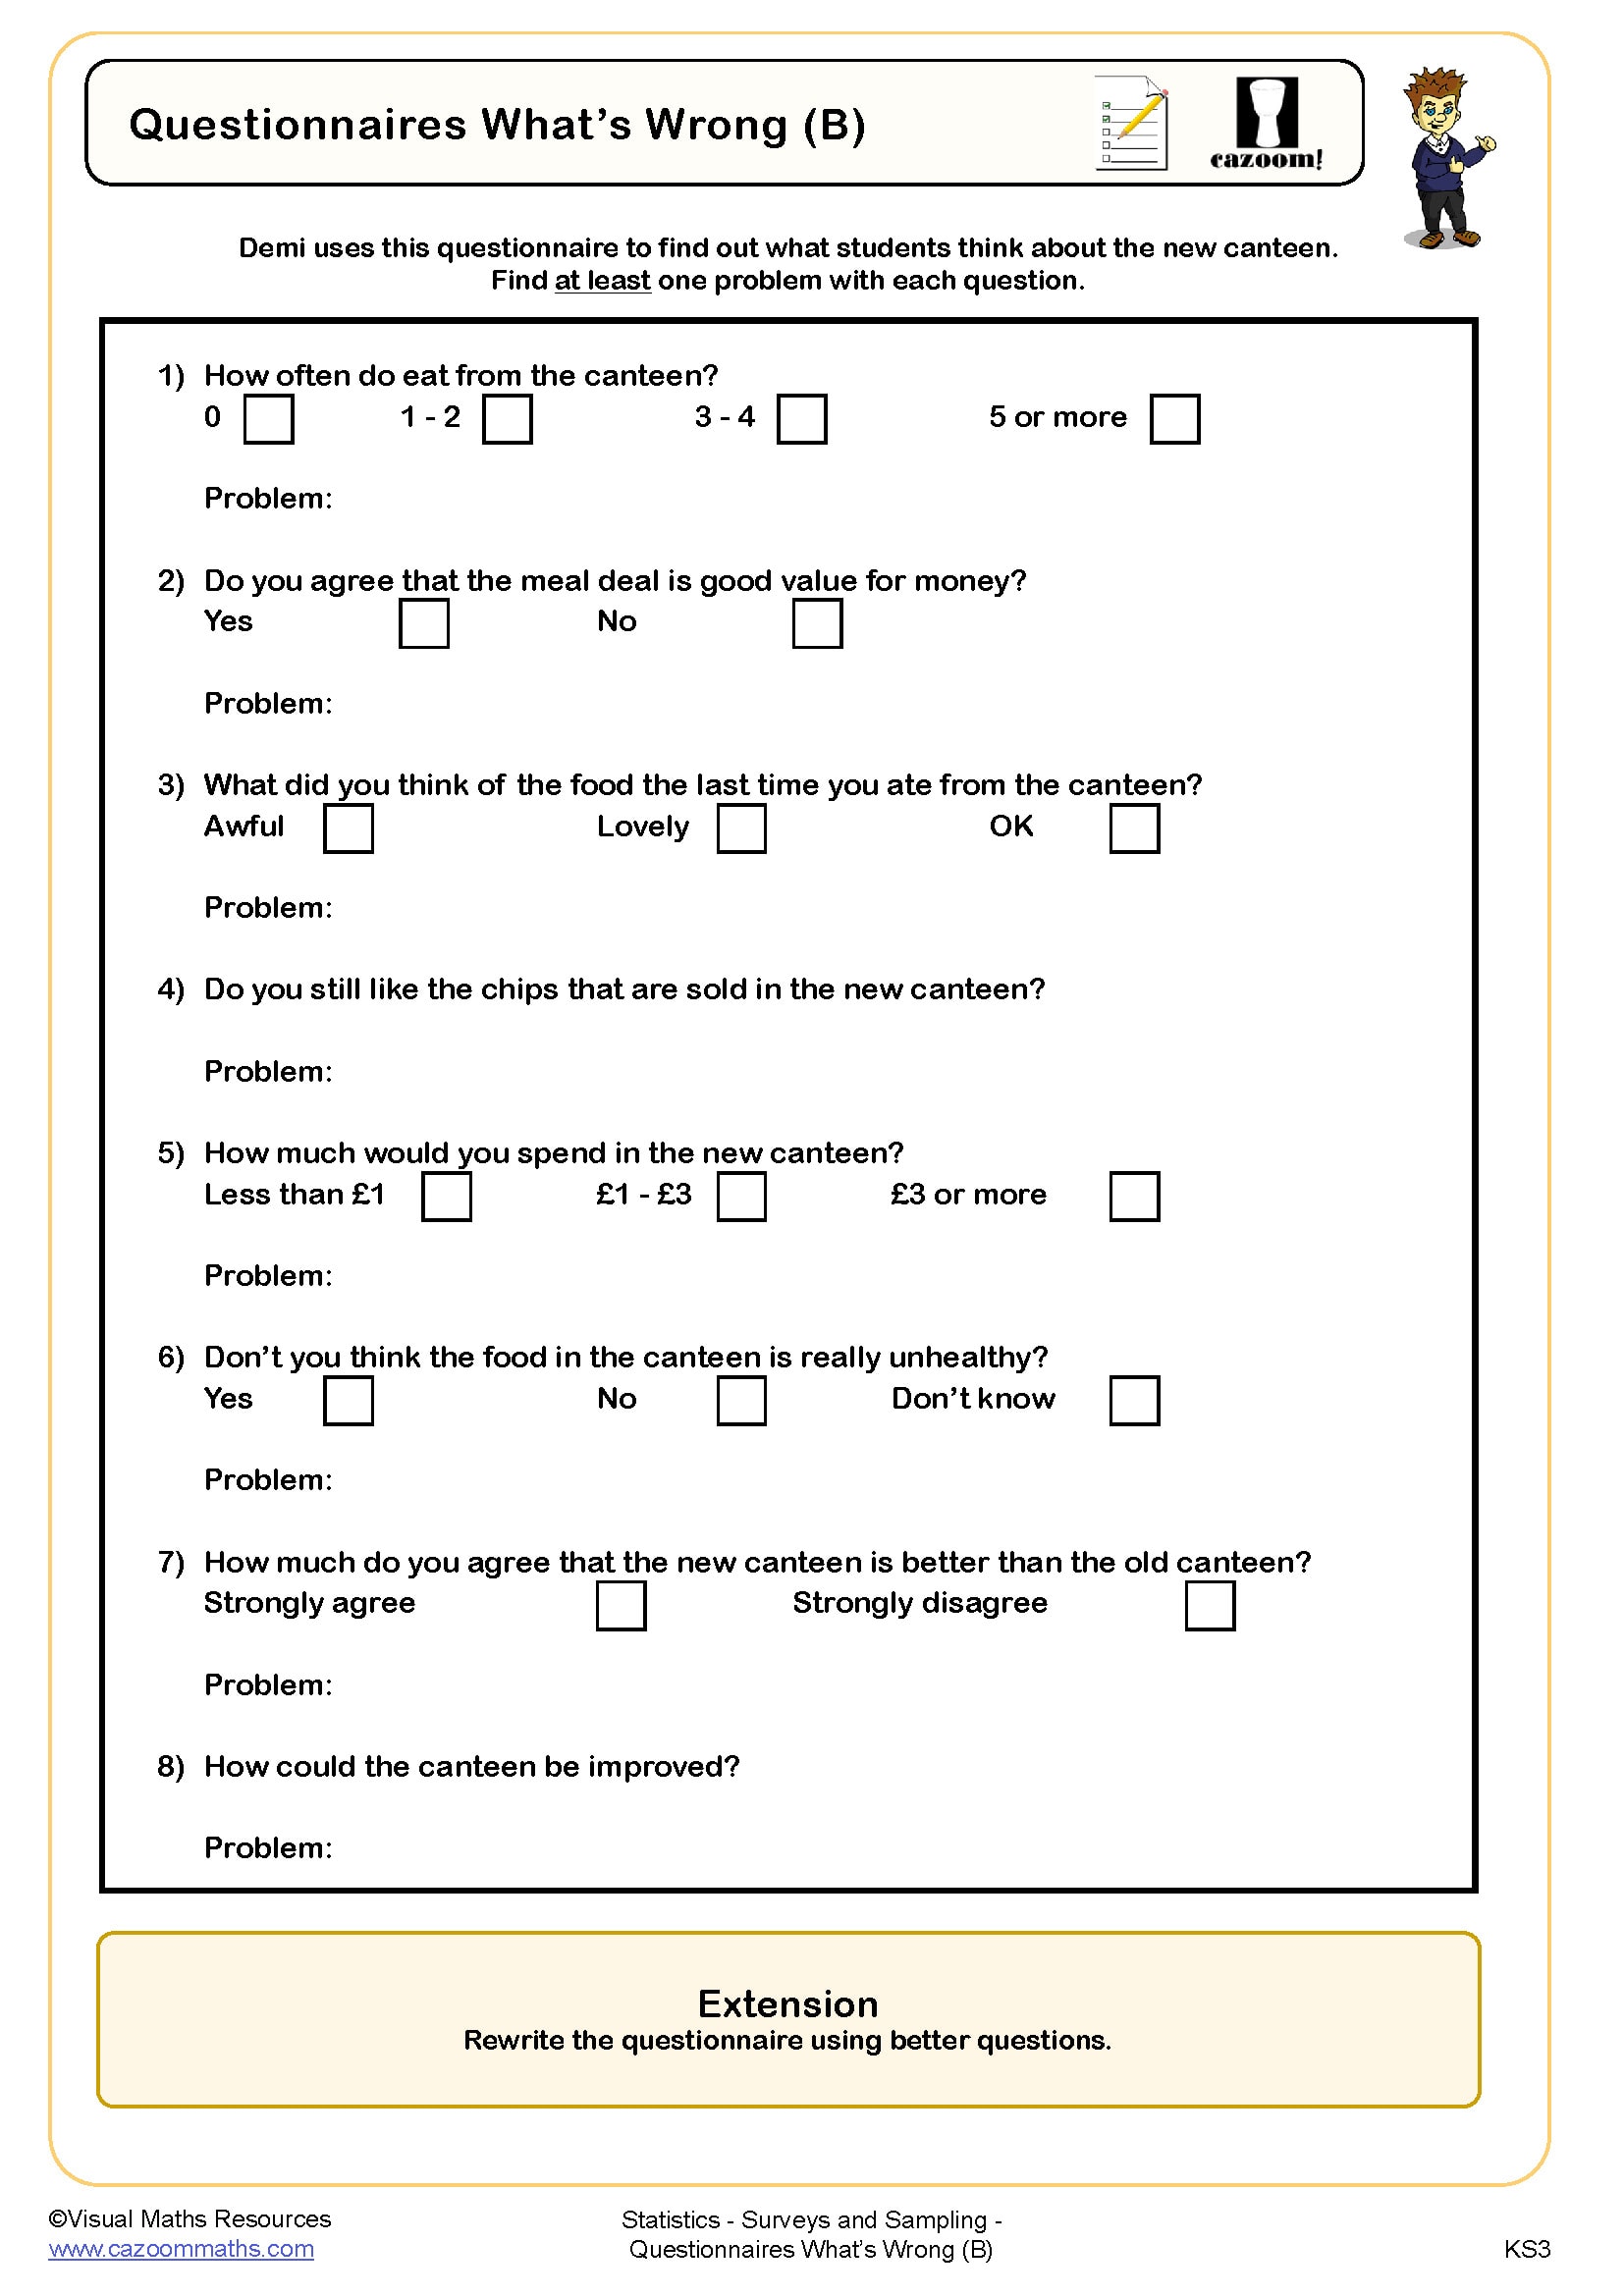
Questionnaires What's Wrong (B)
Year groups: 7, 8
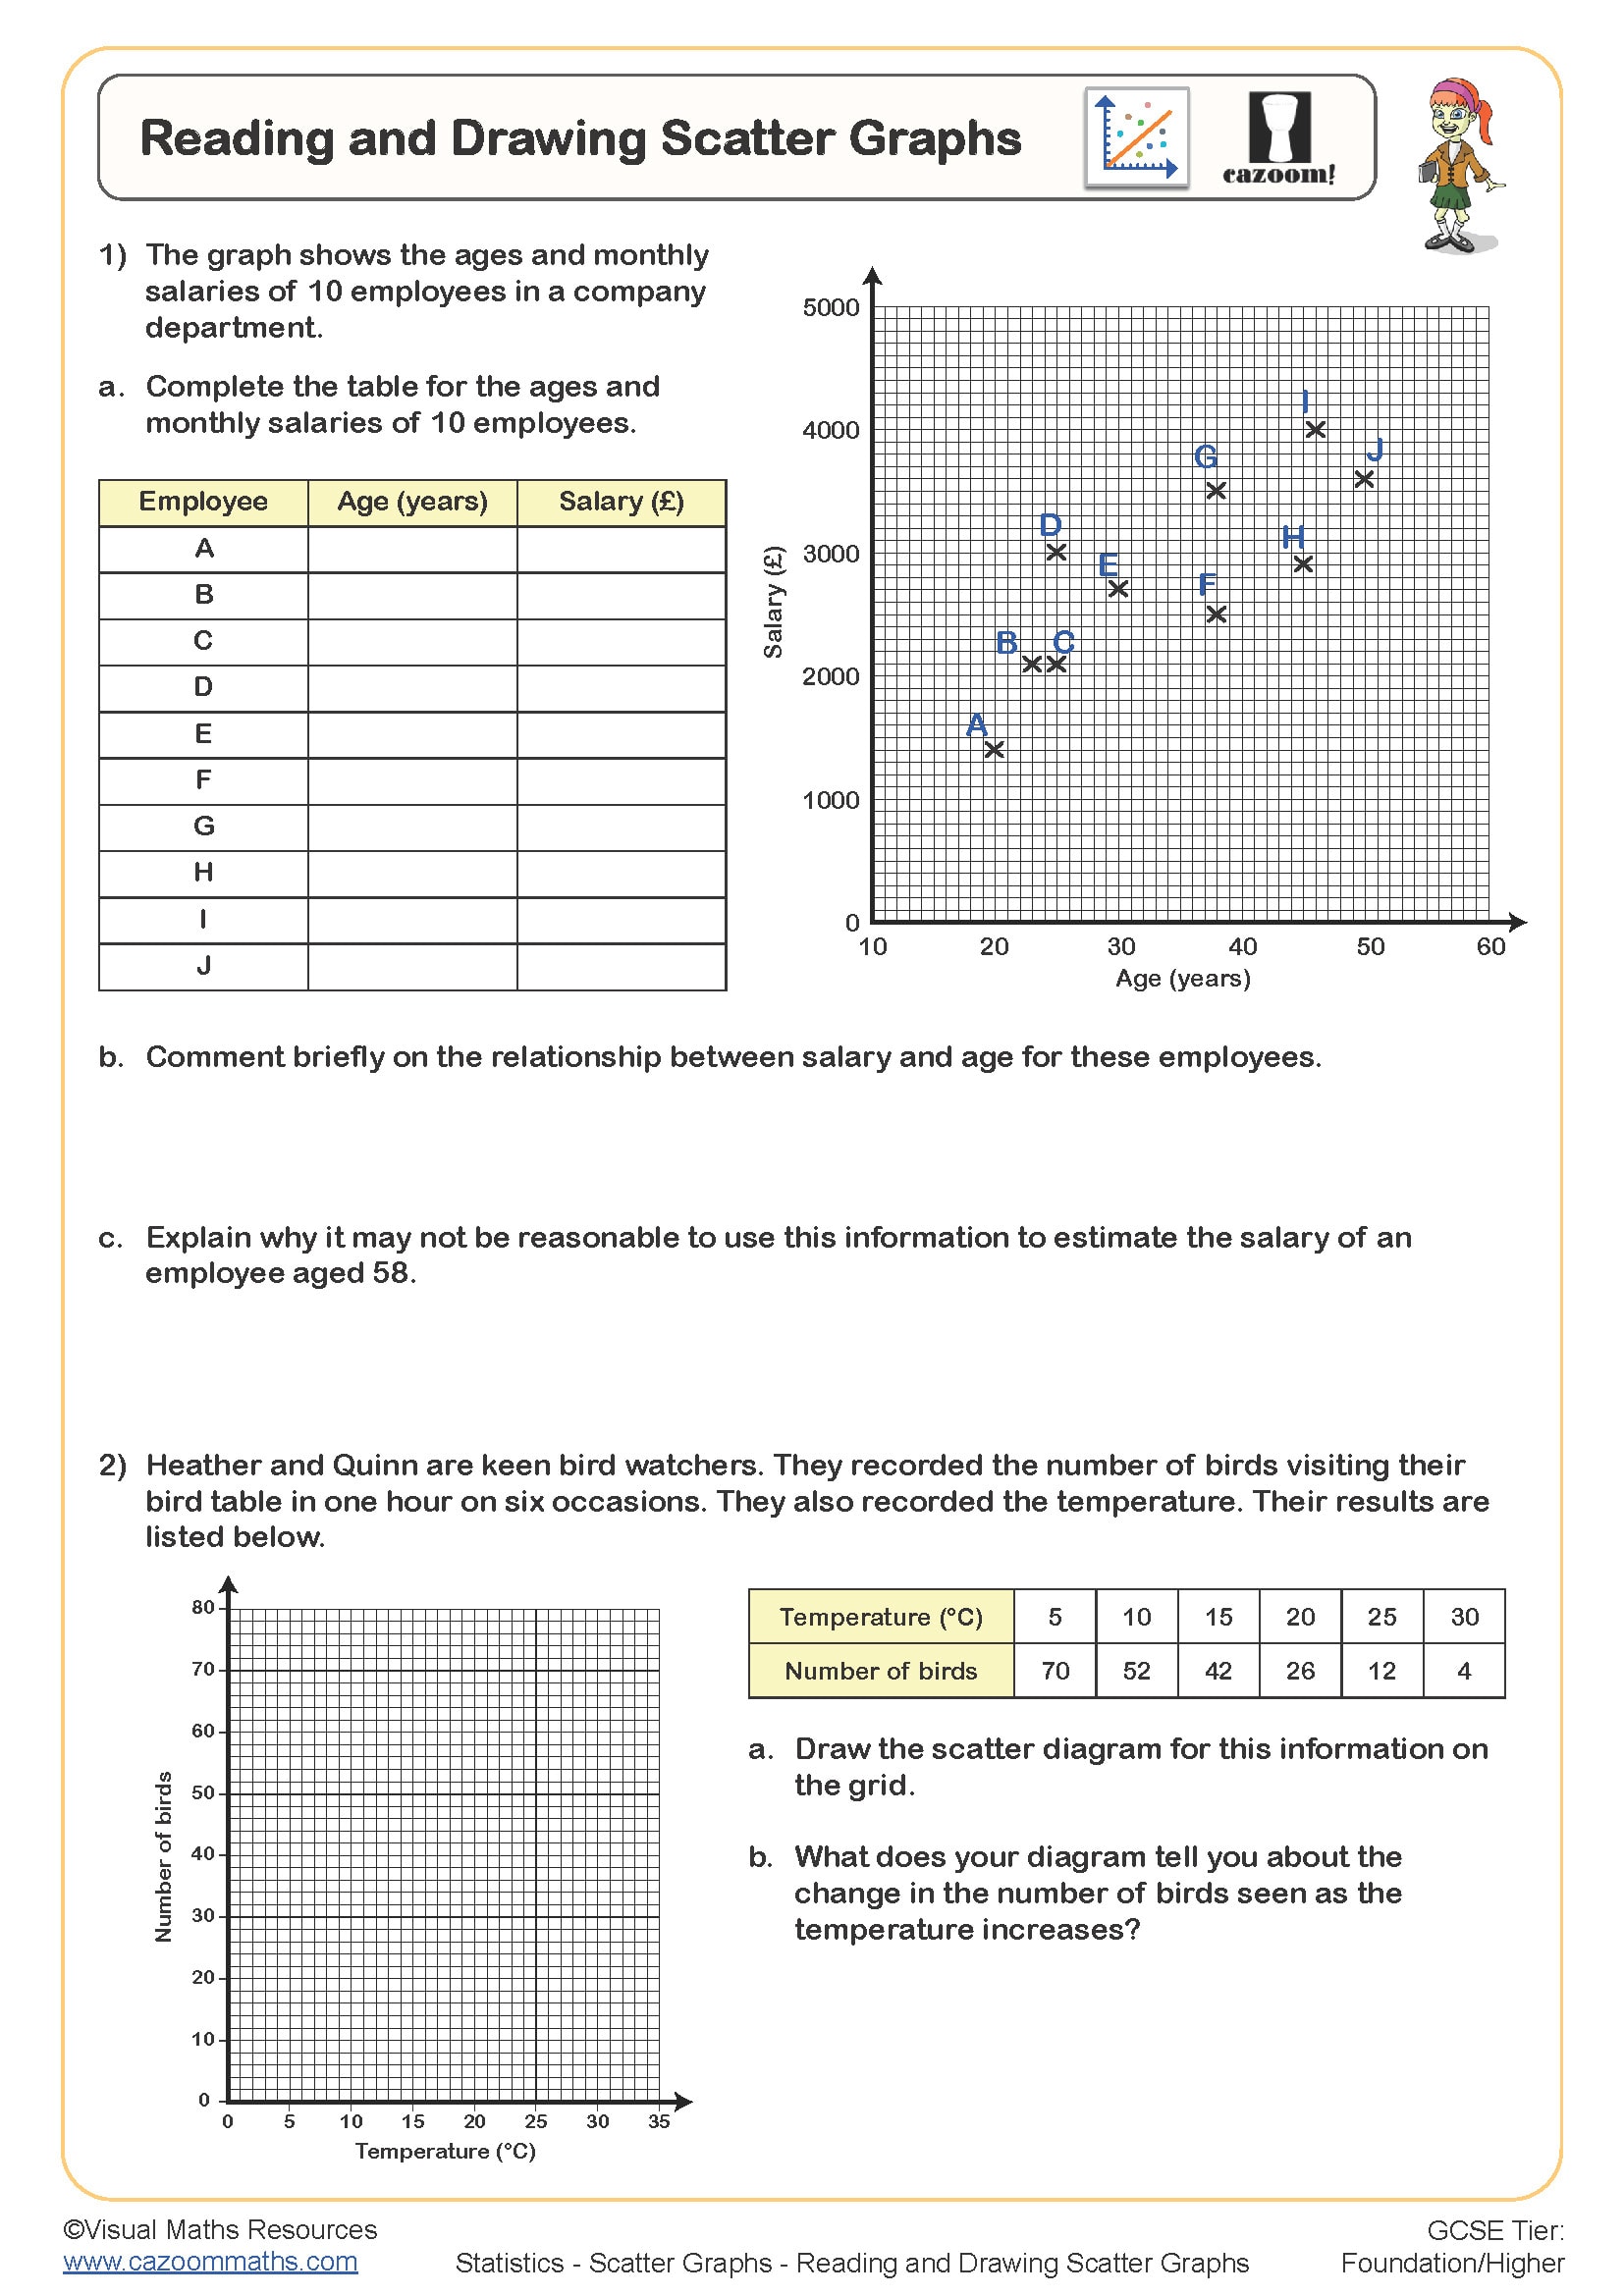
Reading and Drawing Scatter Graphs
Year groups: 7, 8
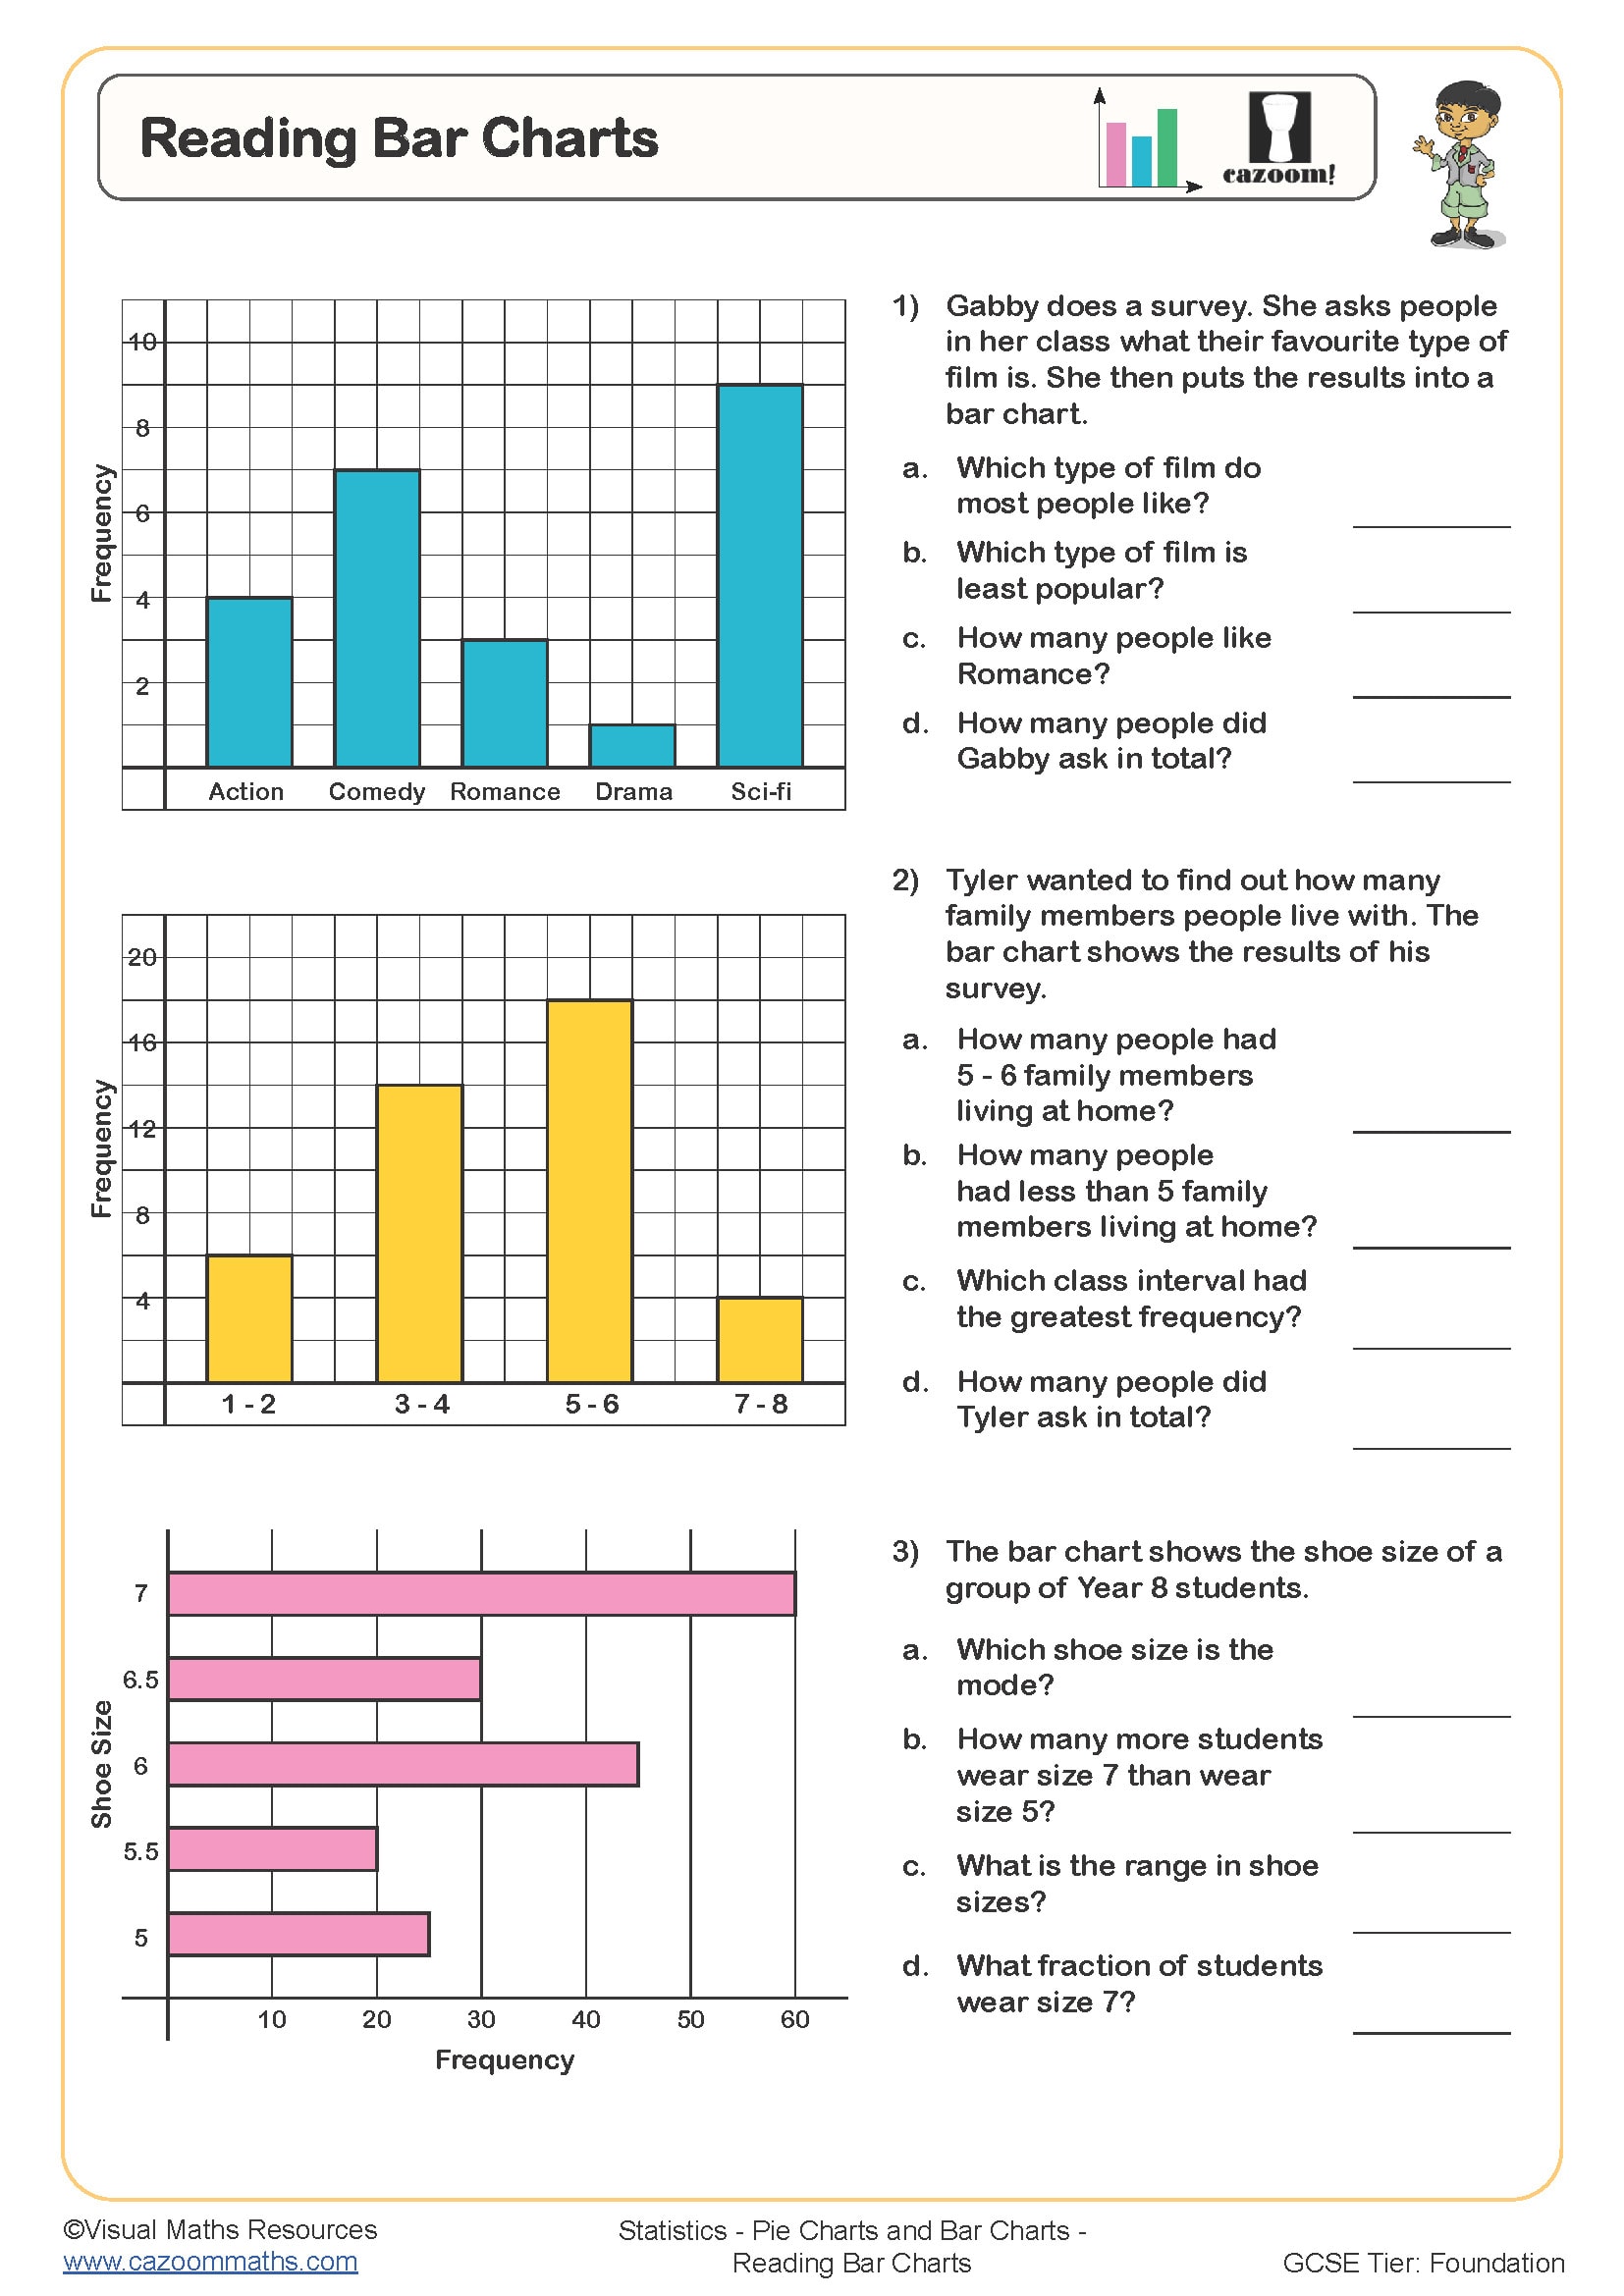
Reading Bar Charts
Year groups: 7, 8
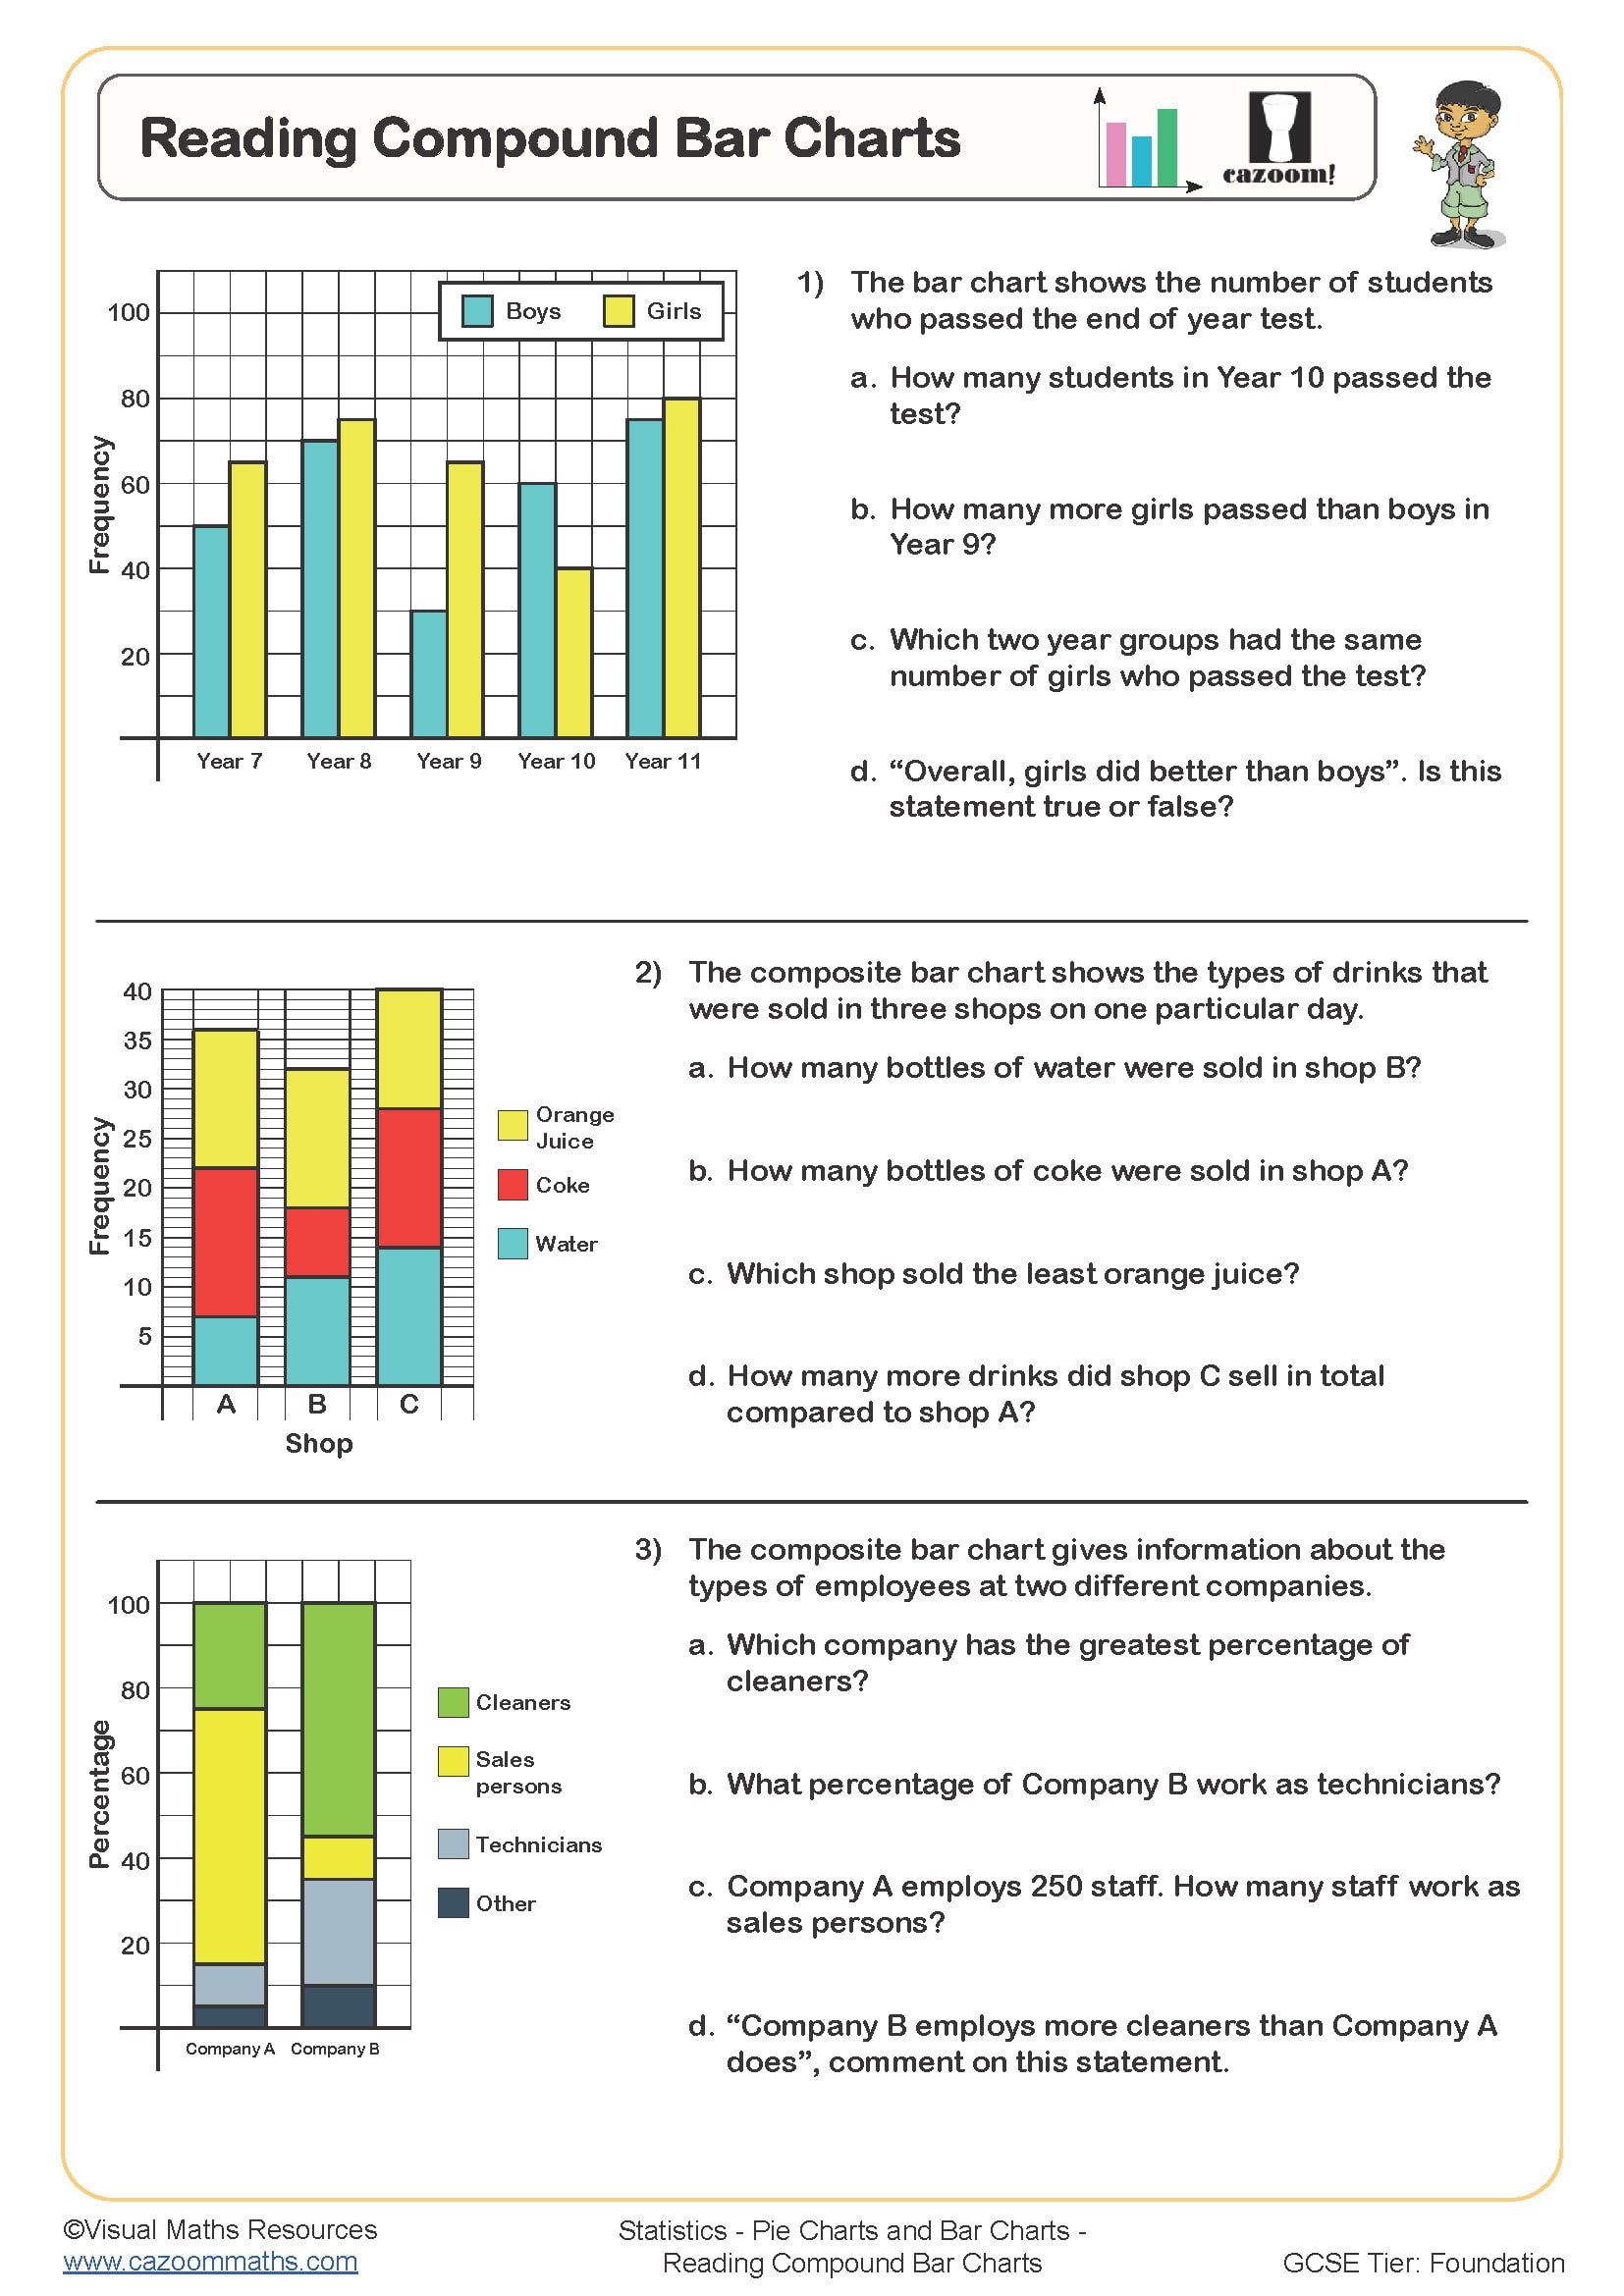
Reading Compound Bar Charts
Year groups: 7, 8
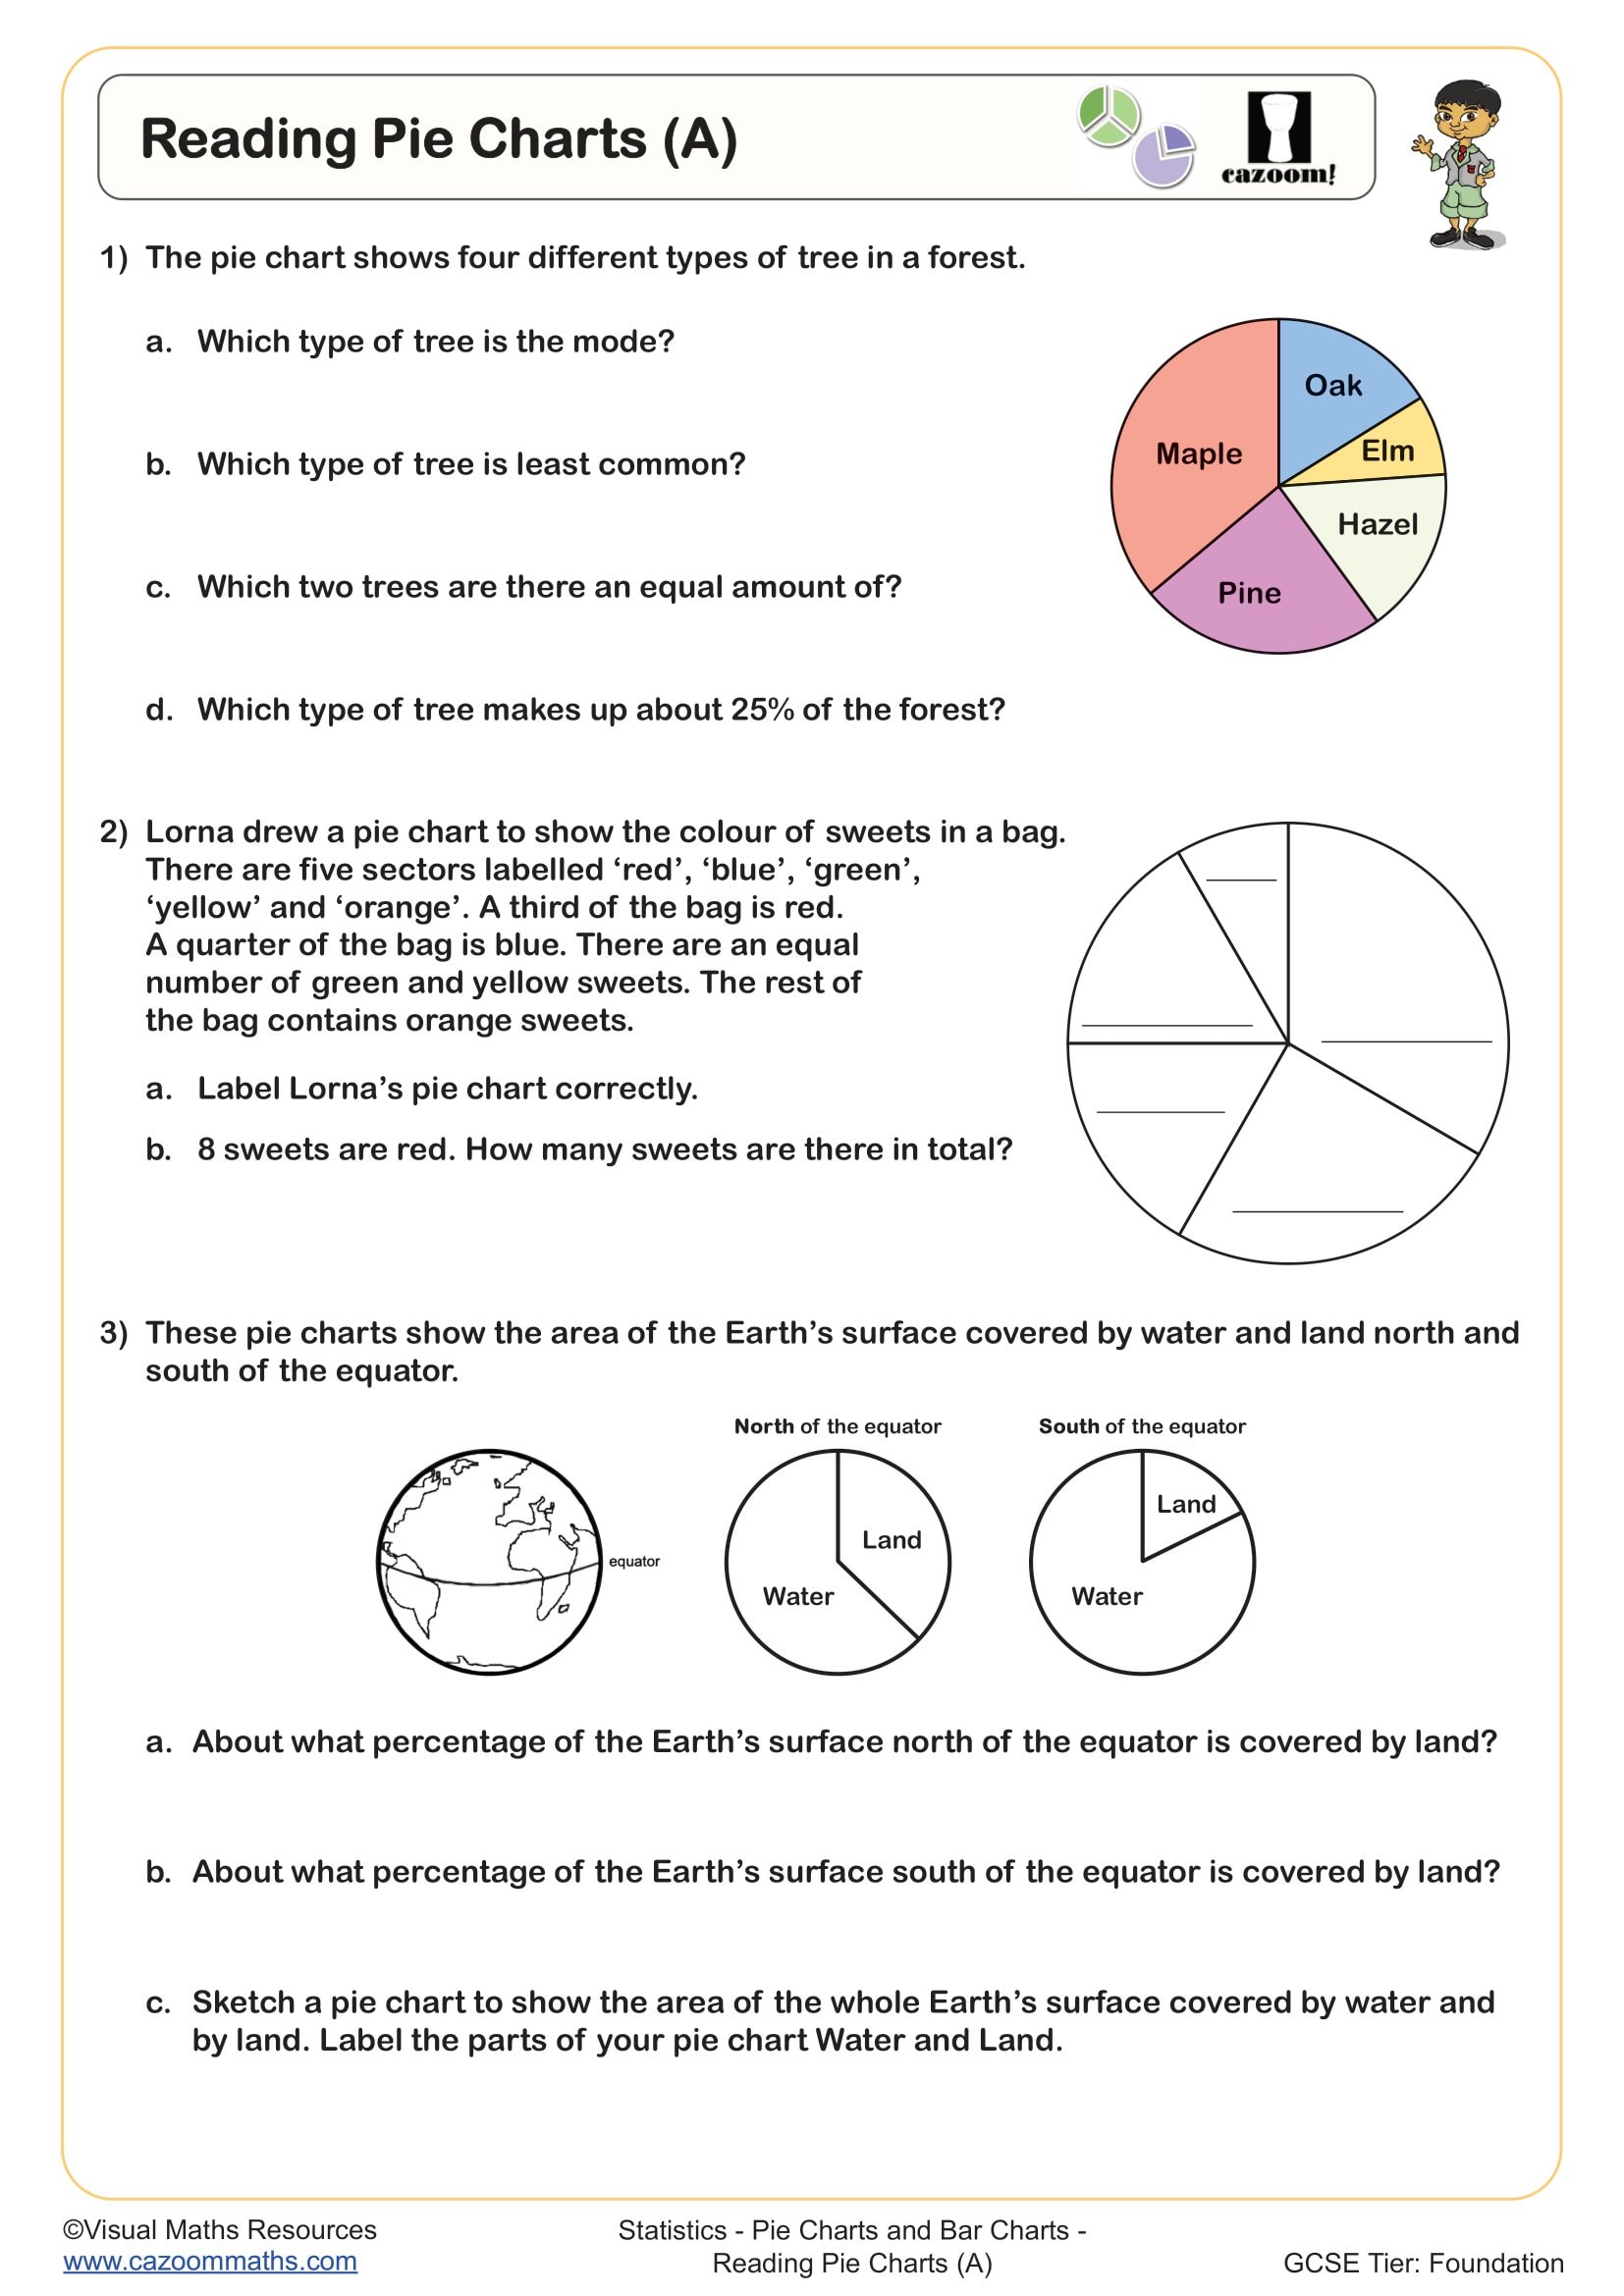
Reading Pie Charts (A)
Year groups: 7, 8
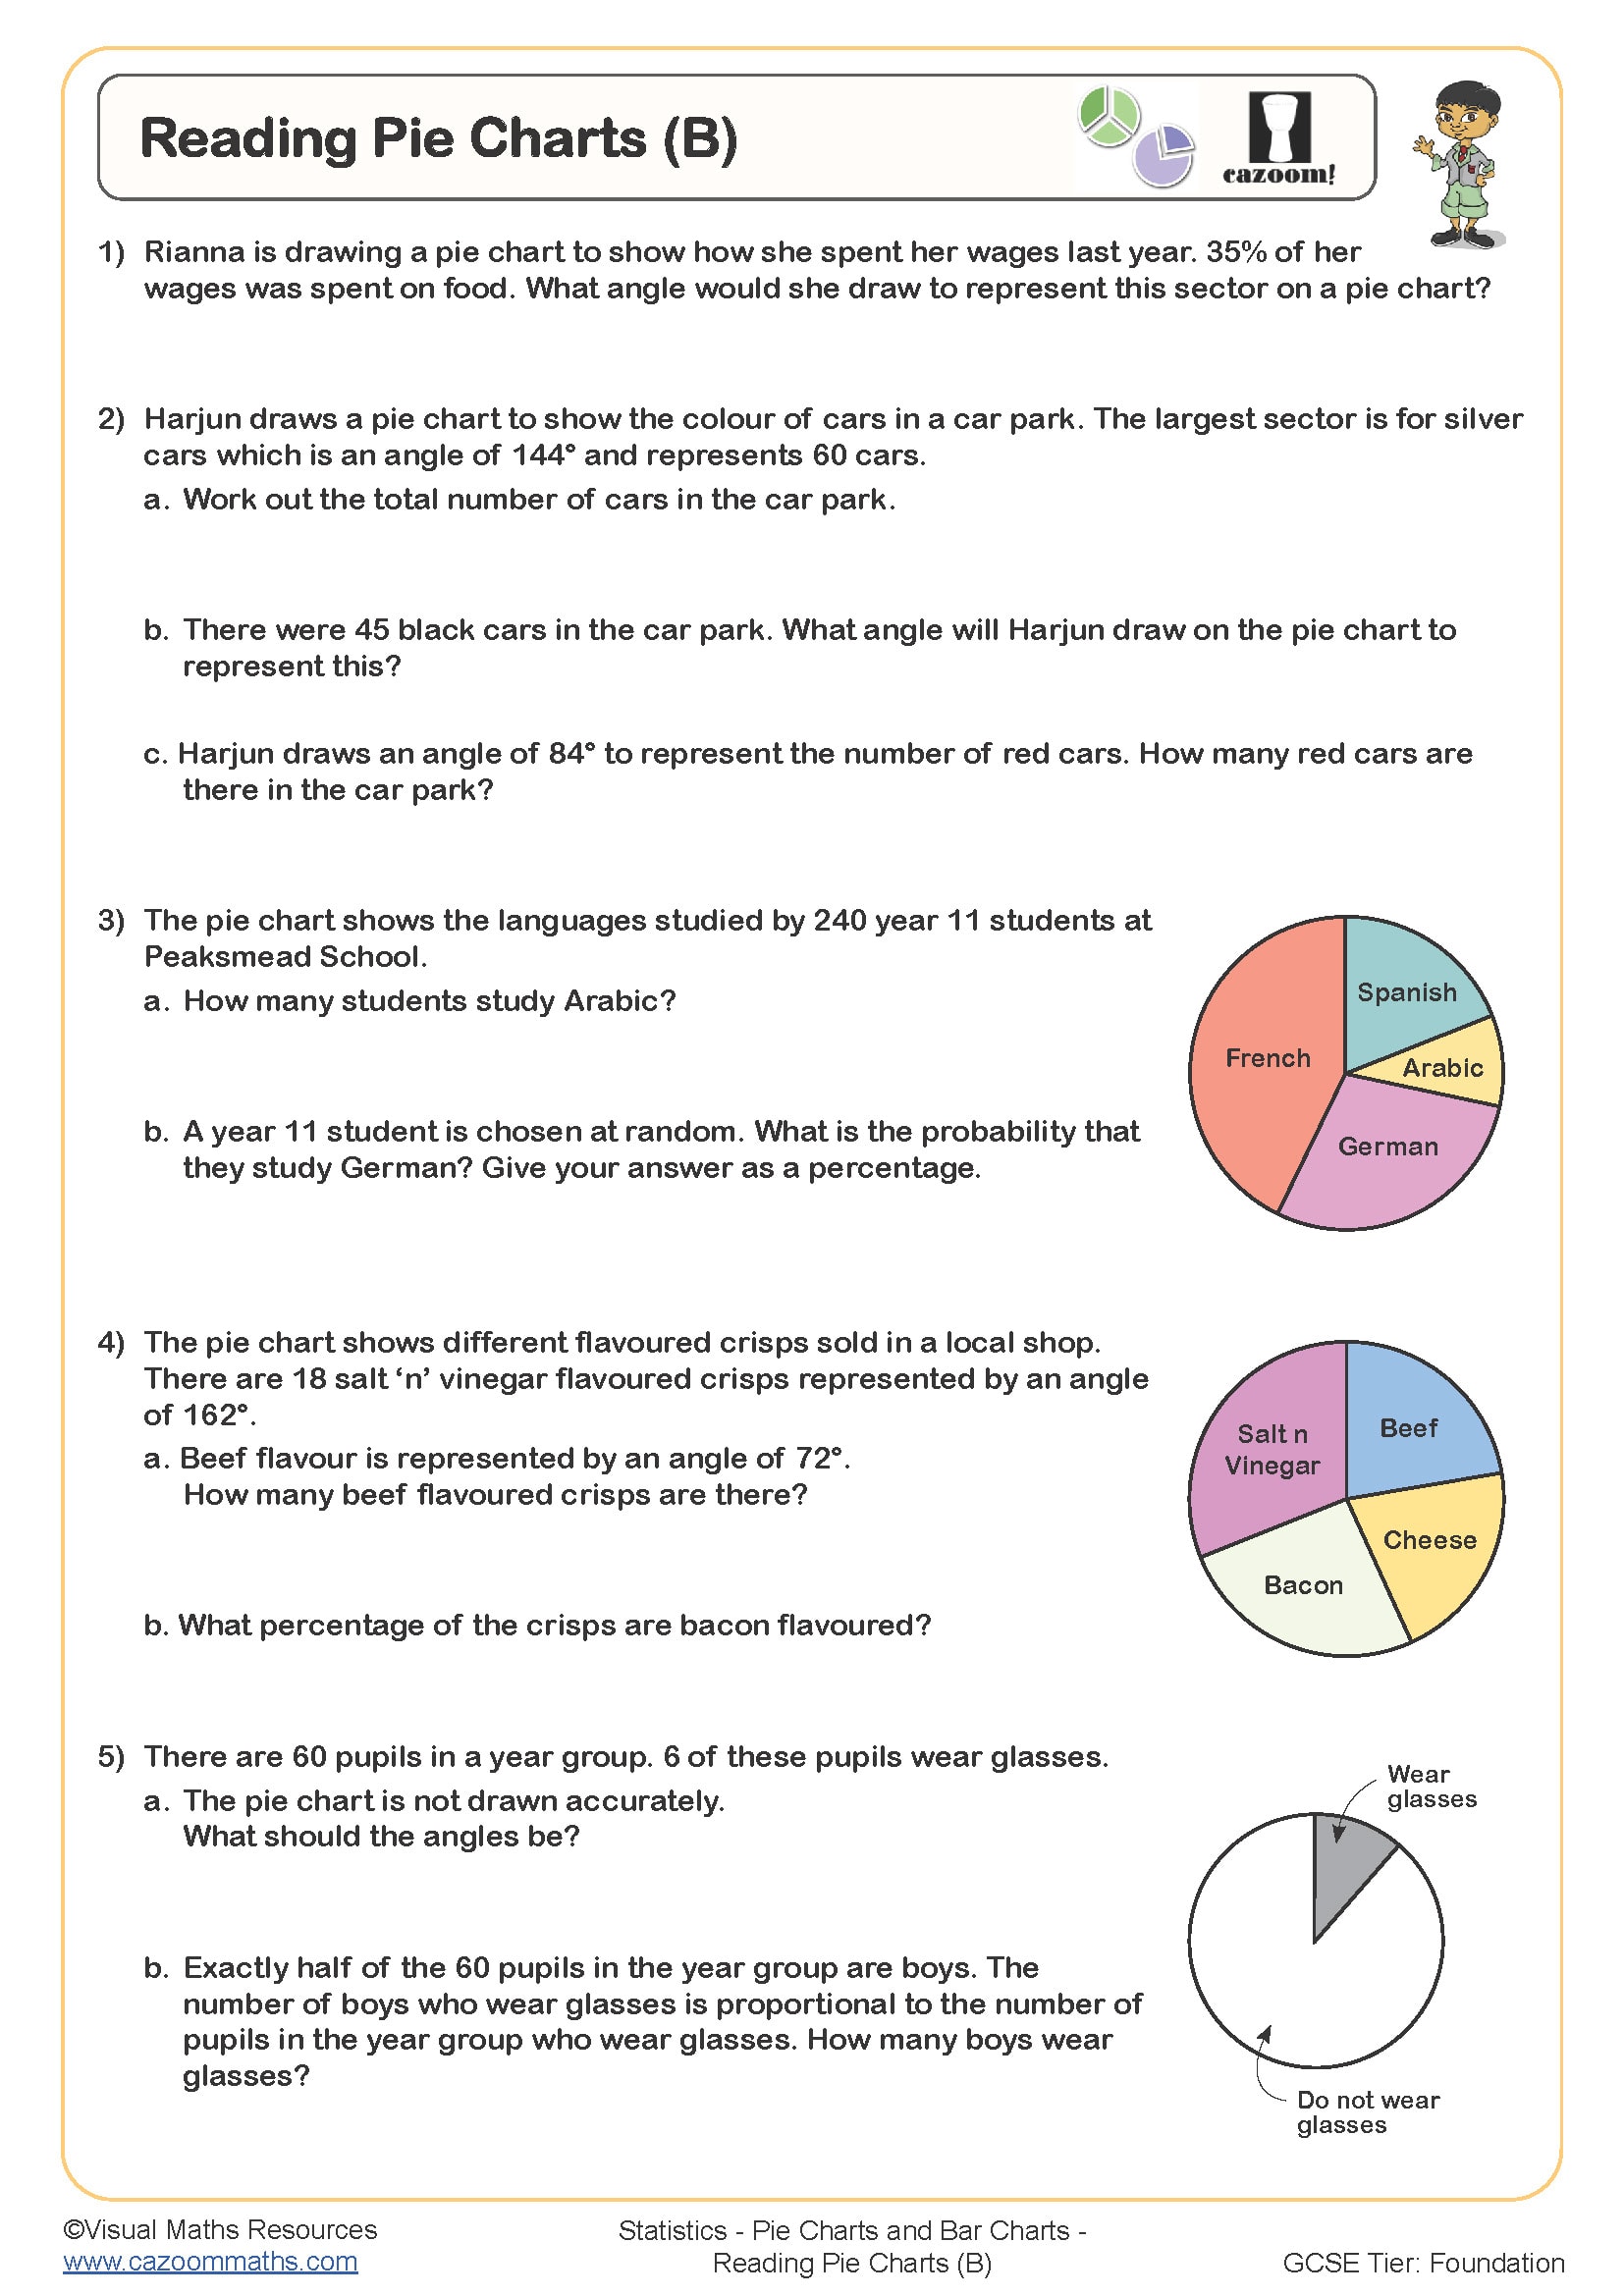
Reading Pie Charts (B)
Year groups: 7, 8
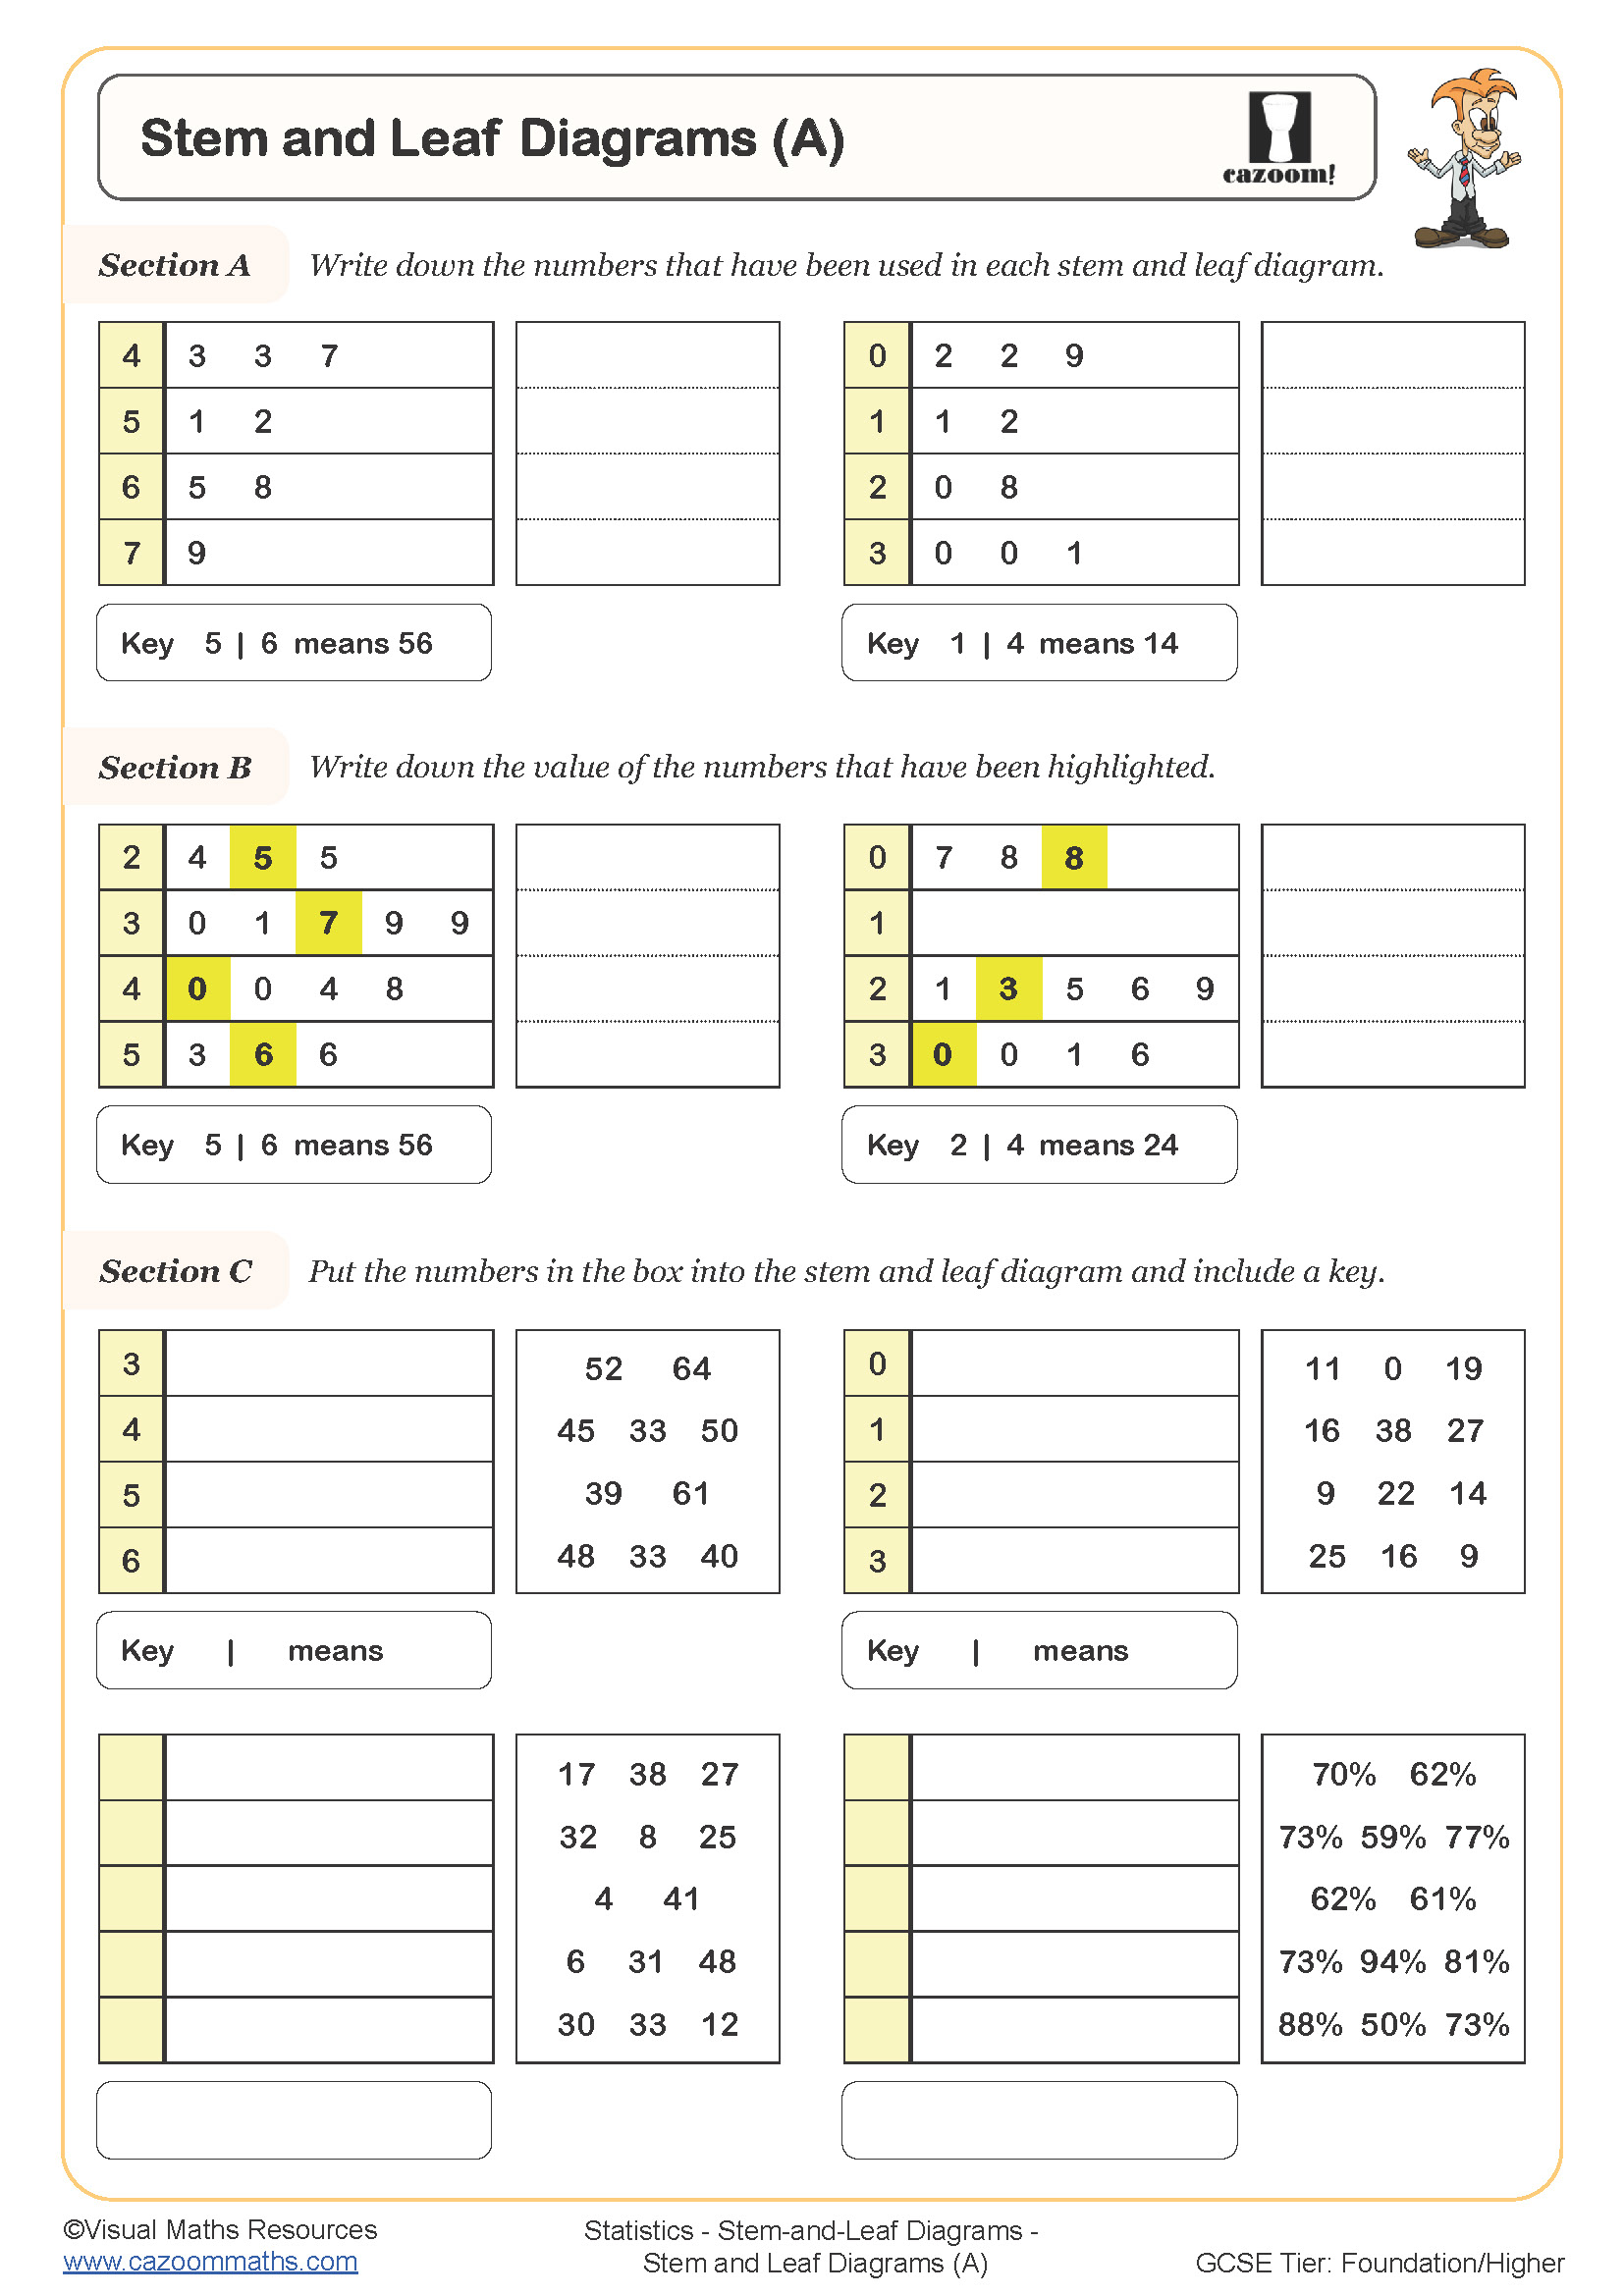
Stem and Leaf Diagrams (A)
Year groups: 7, 8
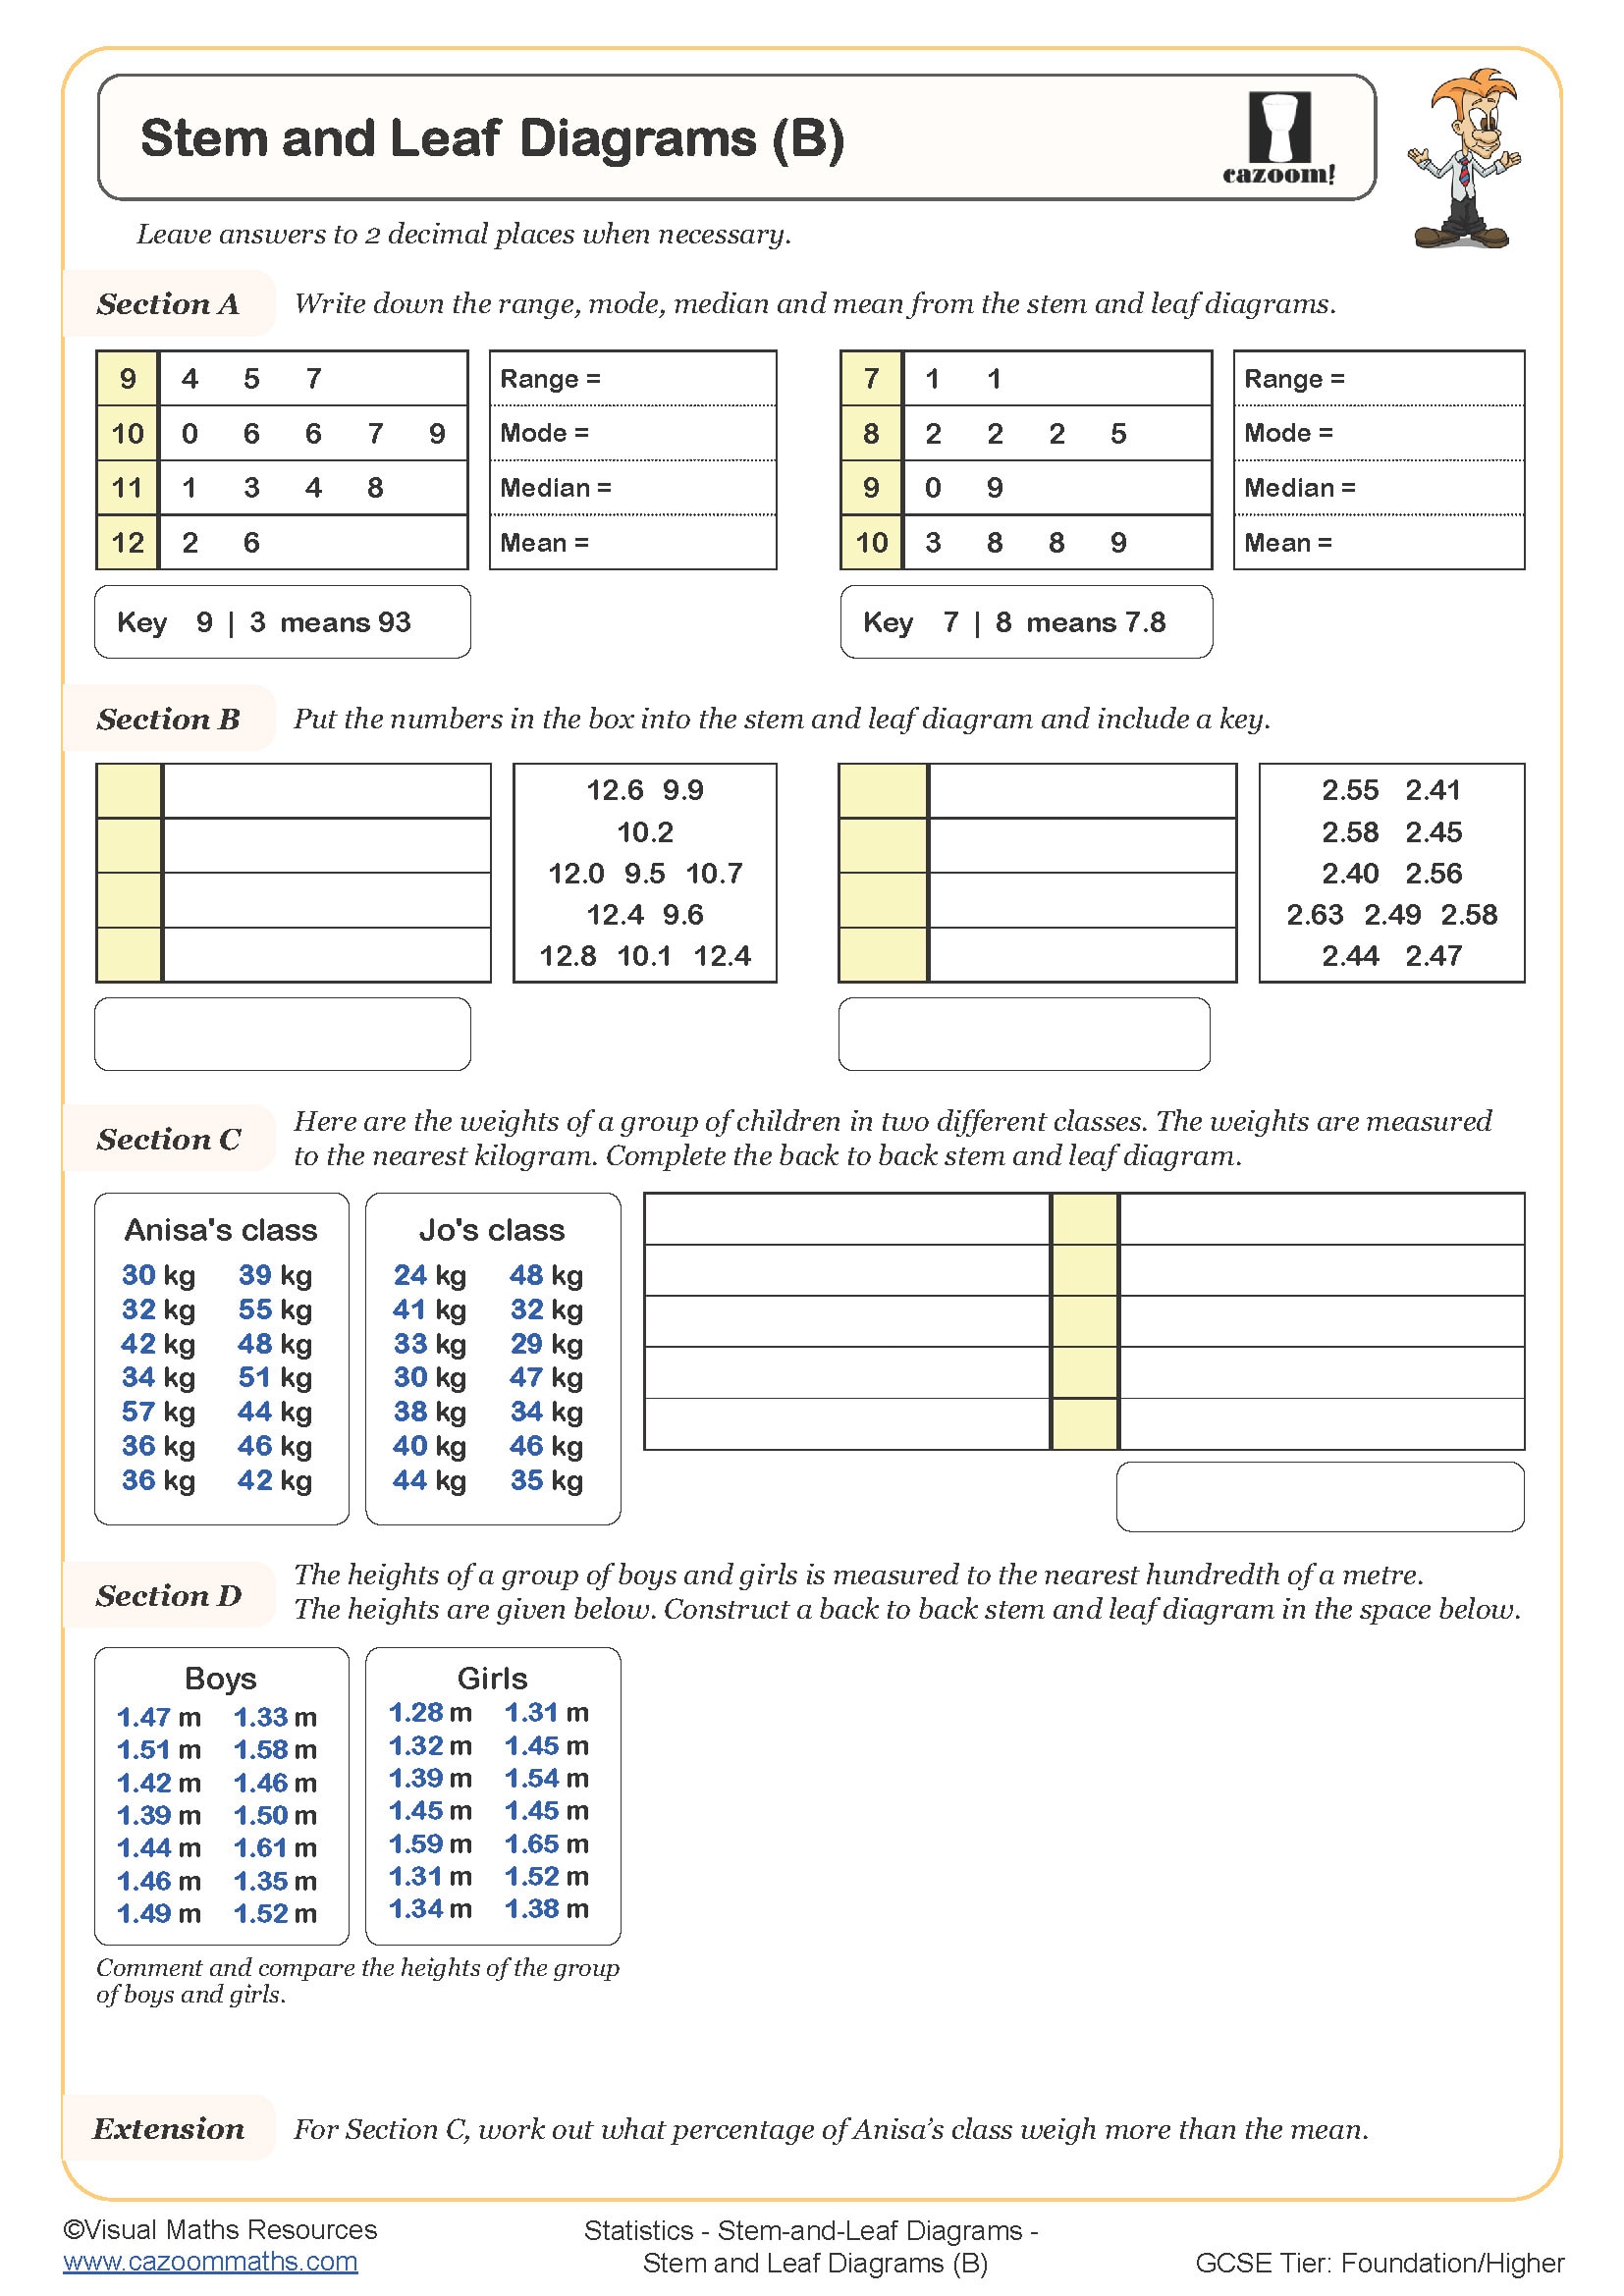
Stem and Leaf Diagrams (B)
Year groups: 7, 8
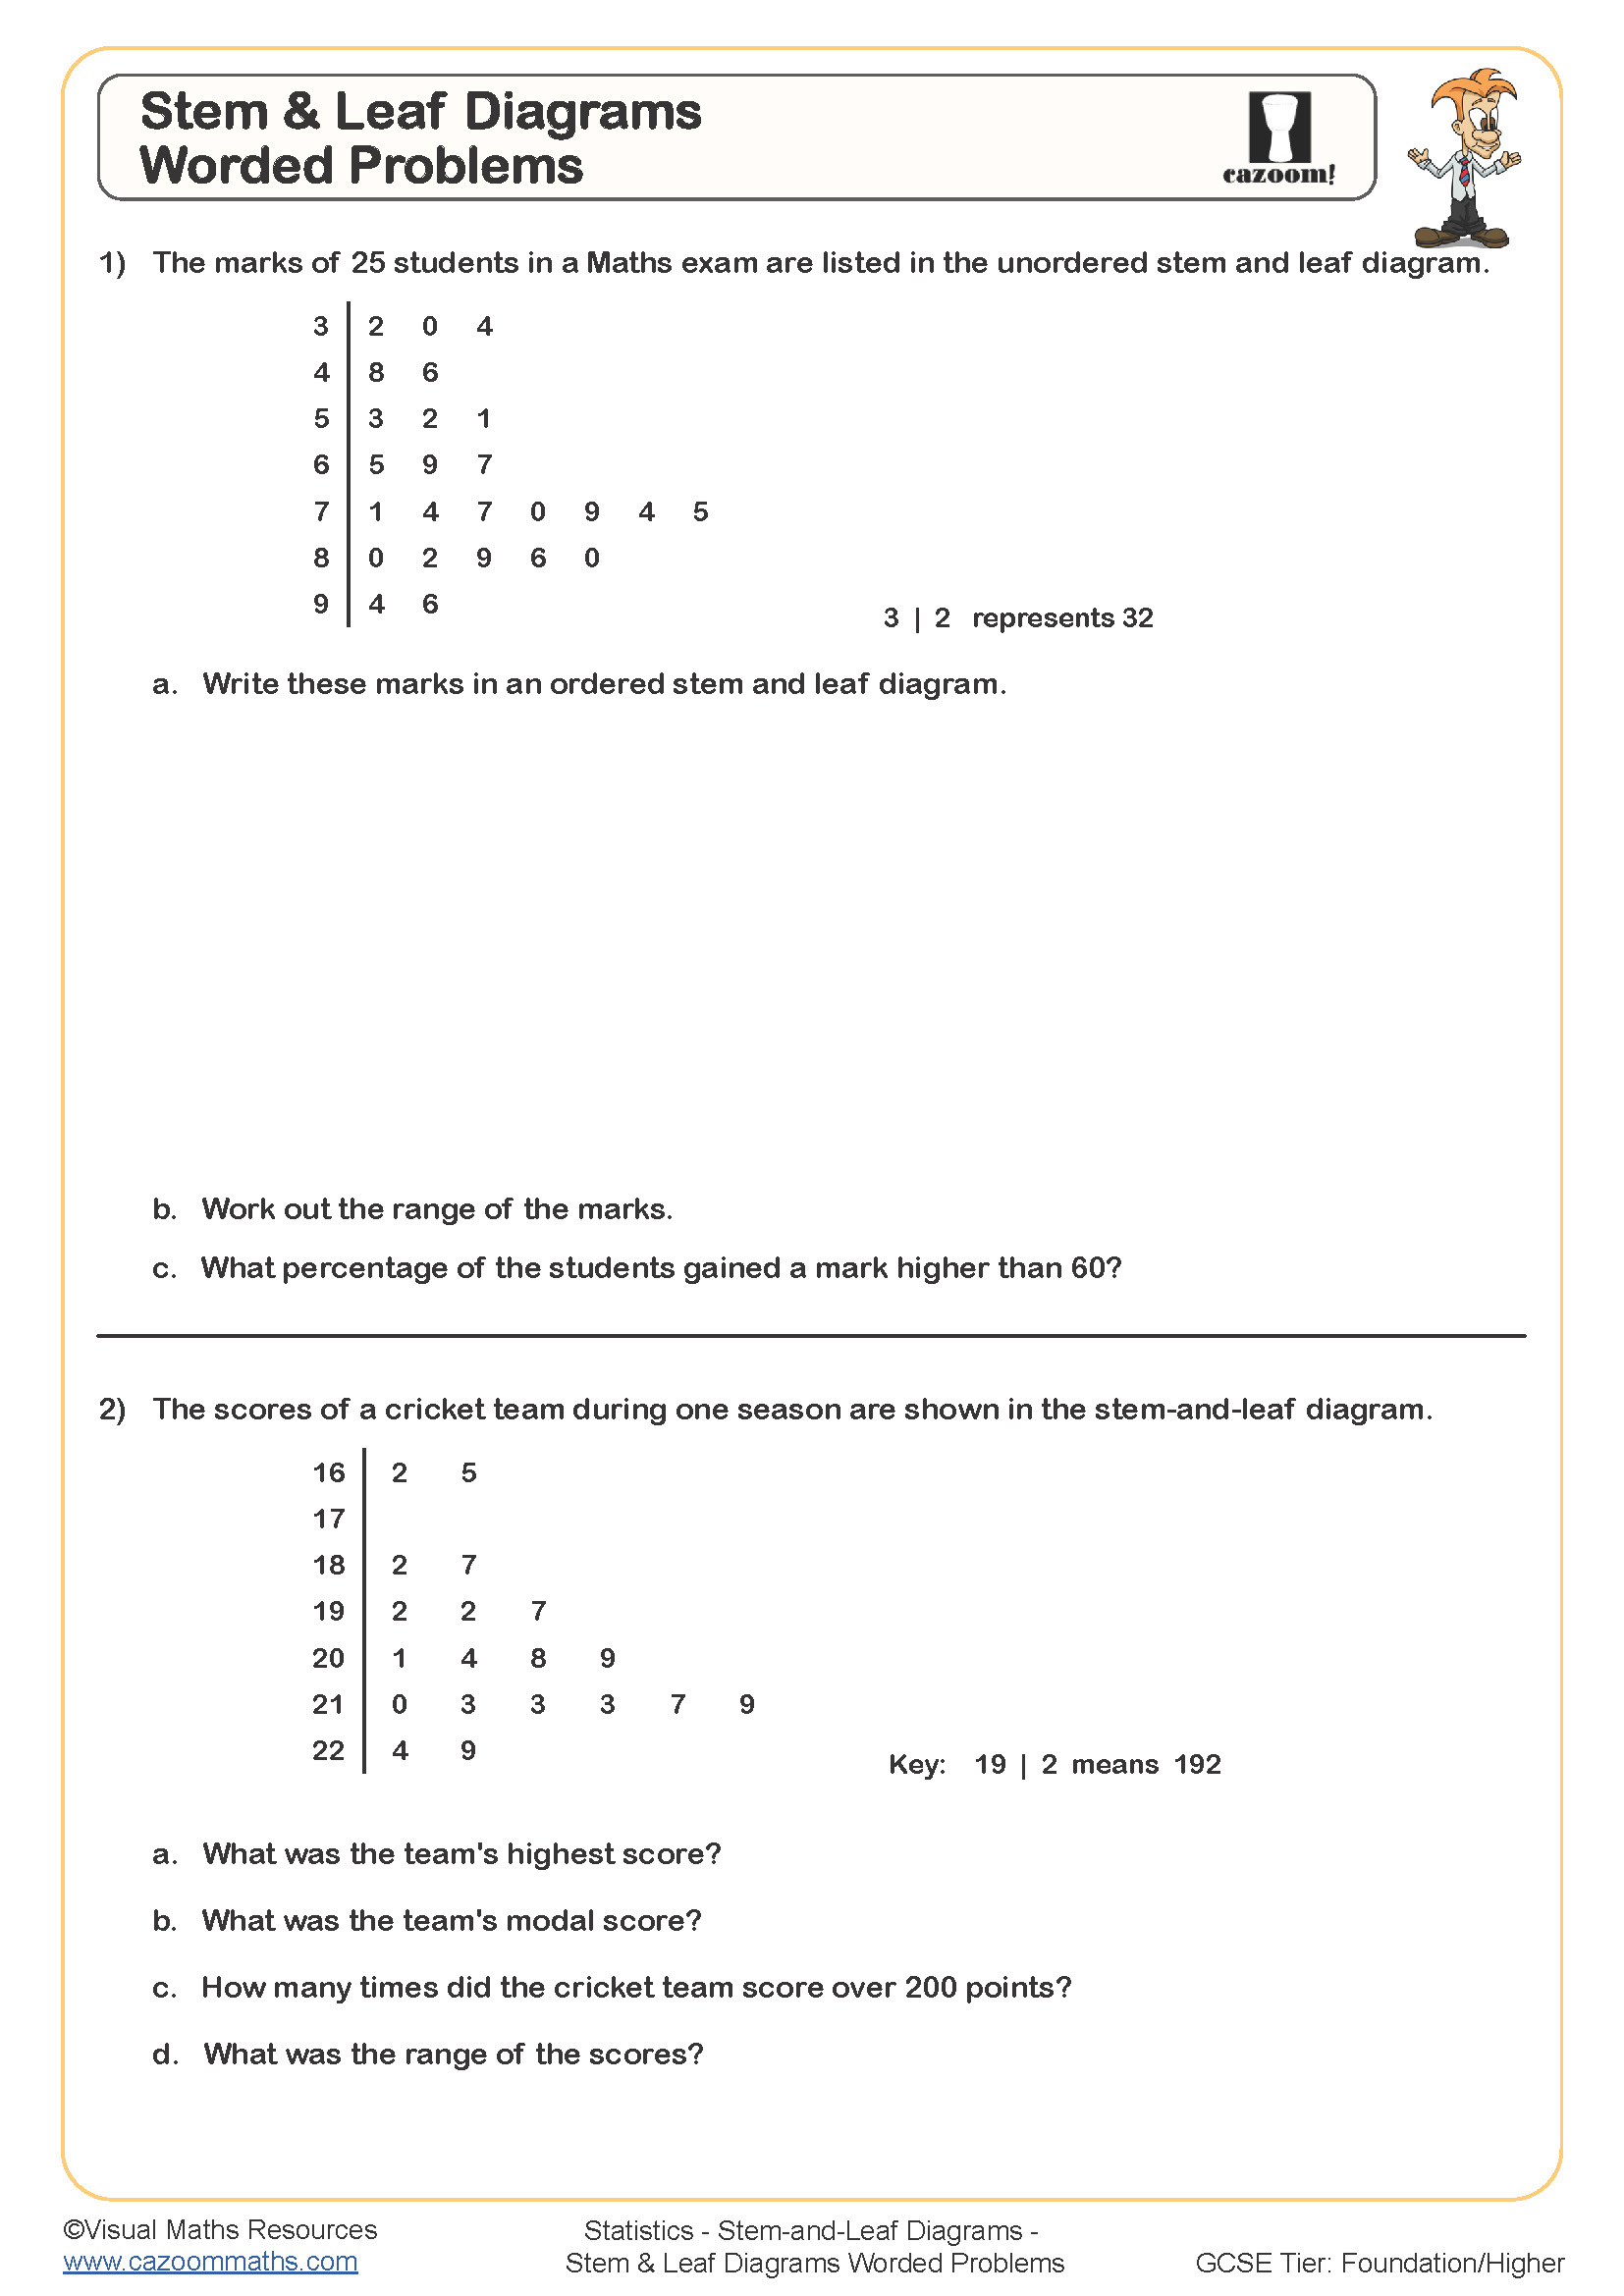
Stem and Leaf Word Problems
Year groups: 7, 8
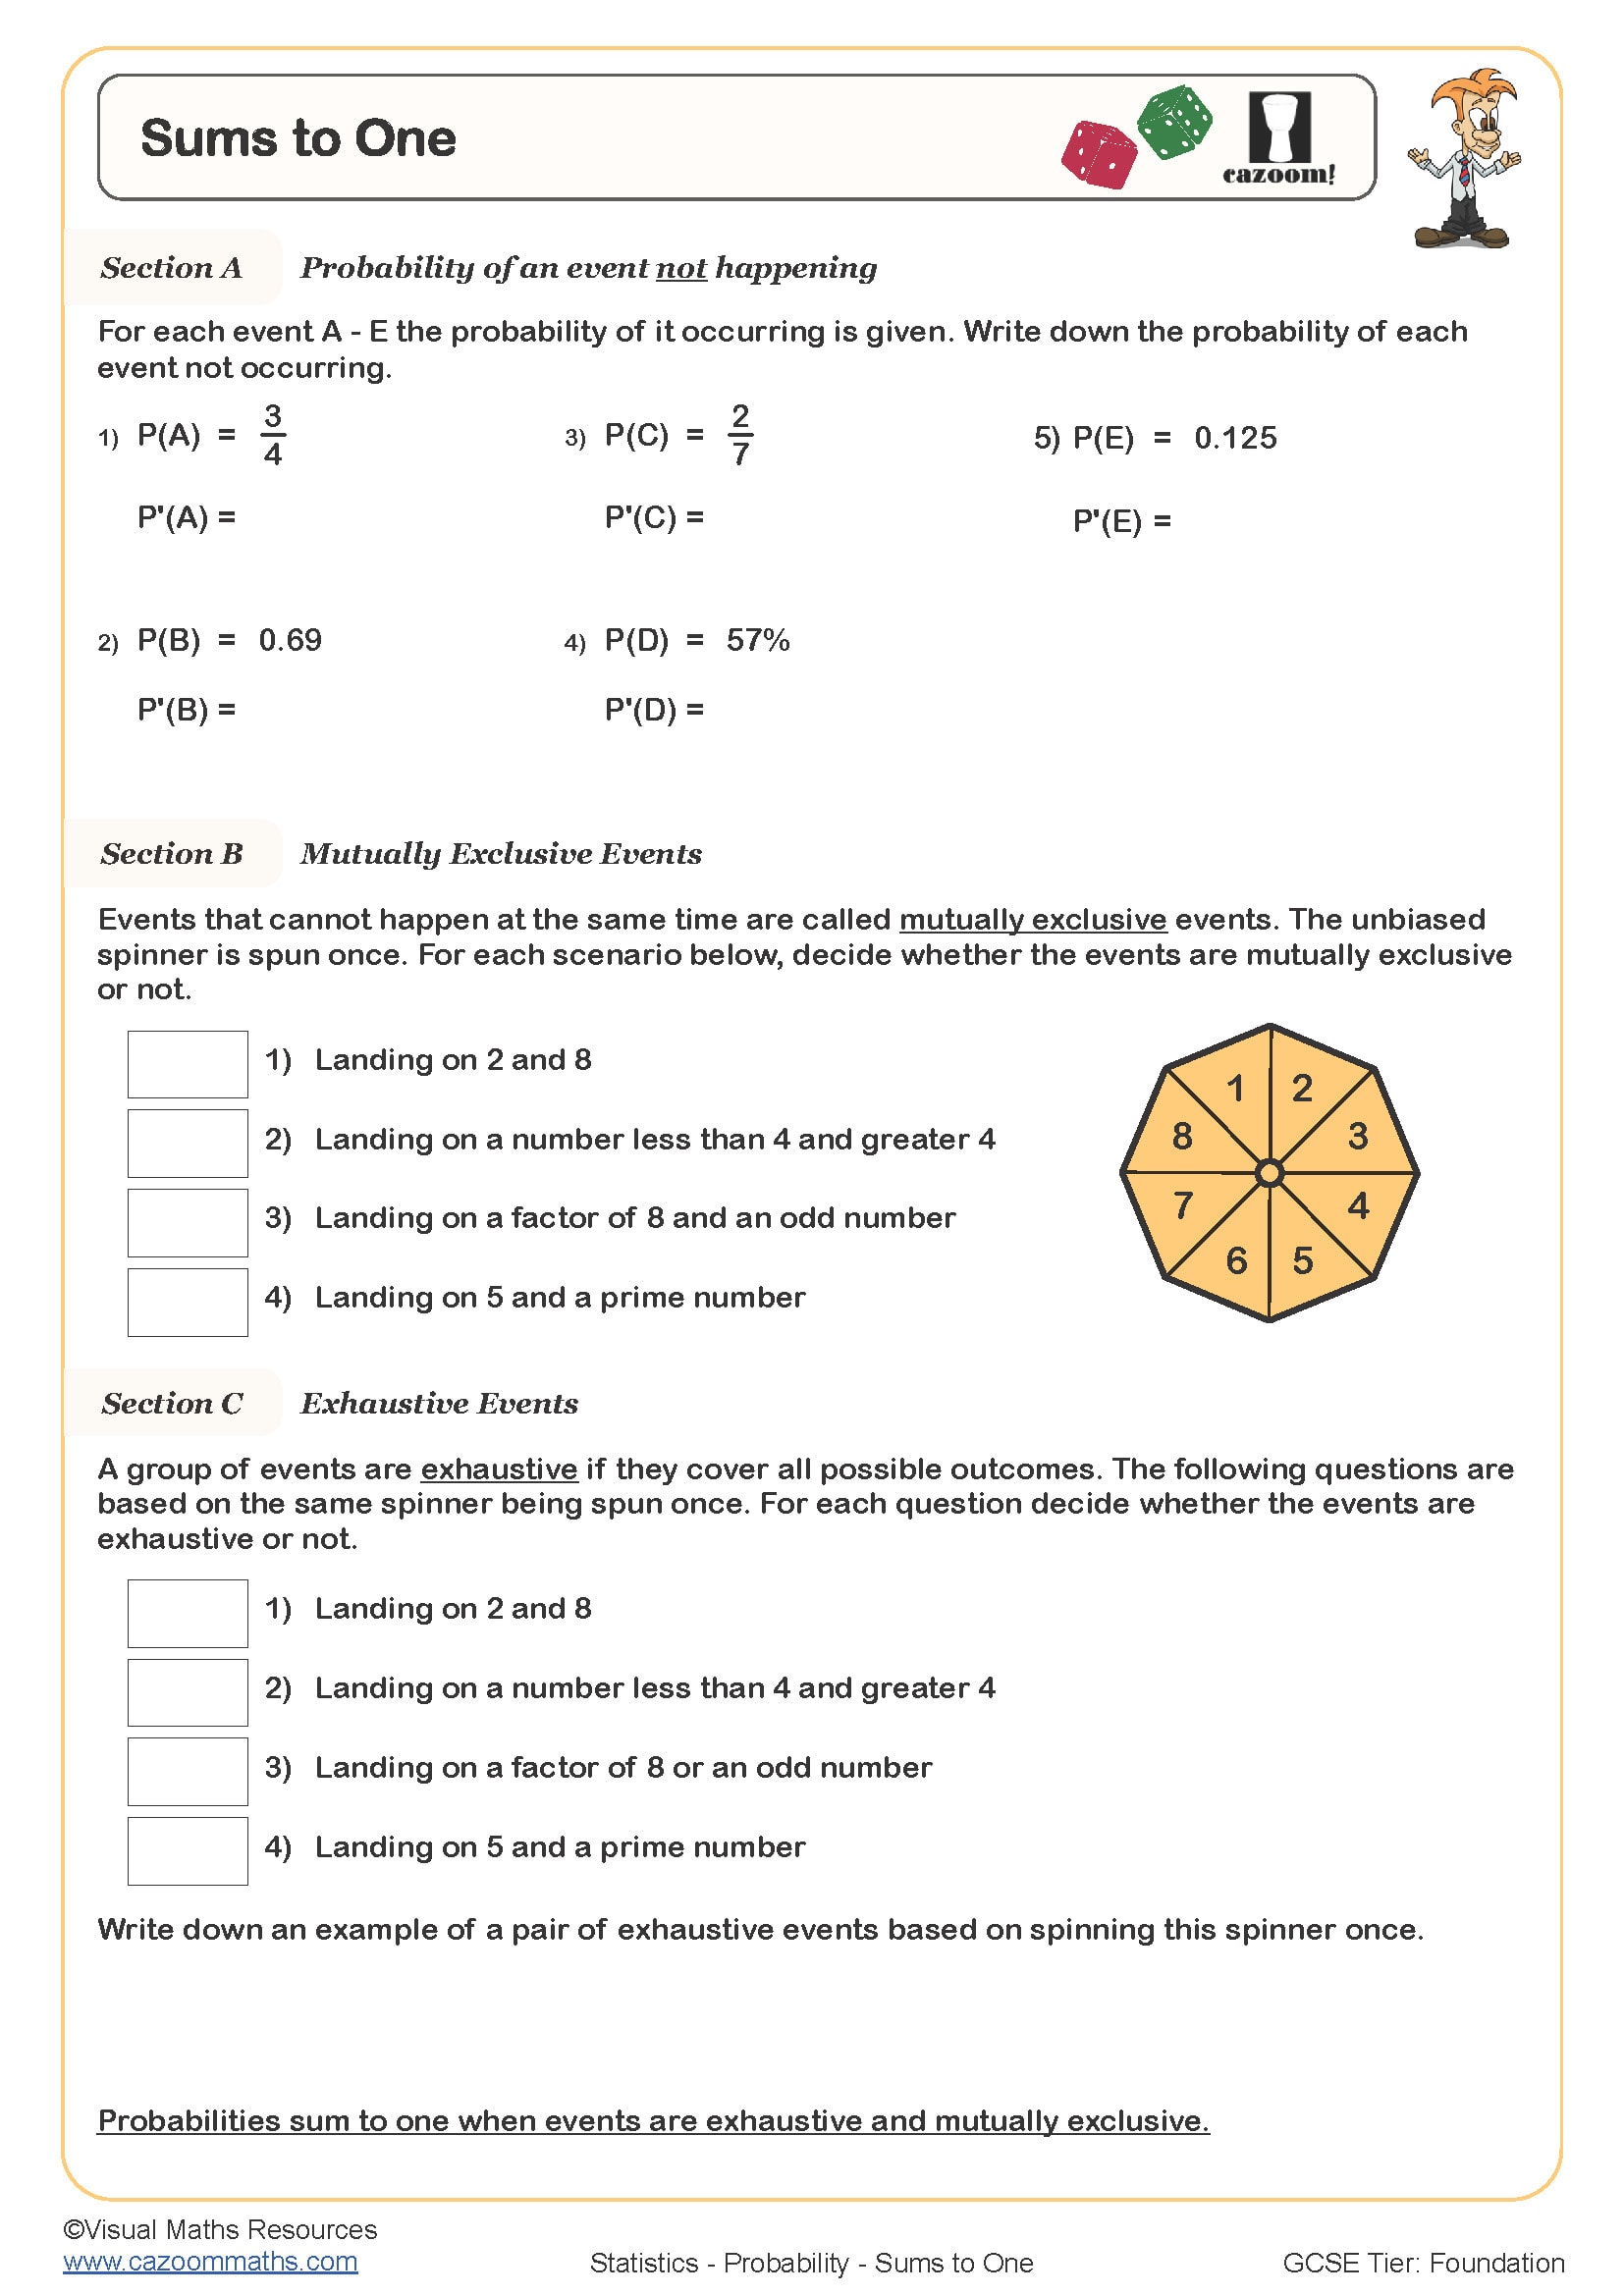
Sums to One
Year groups: 7, 8, 9
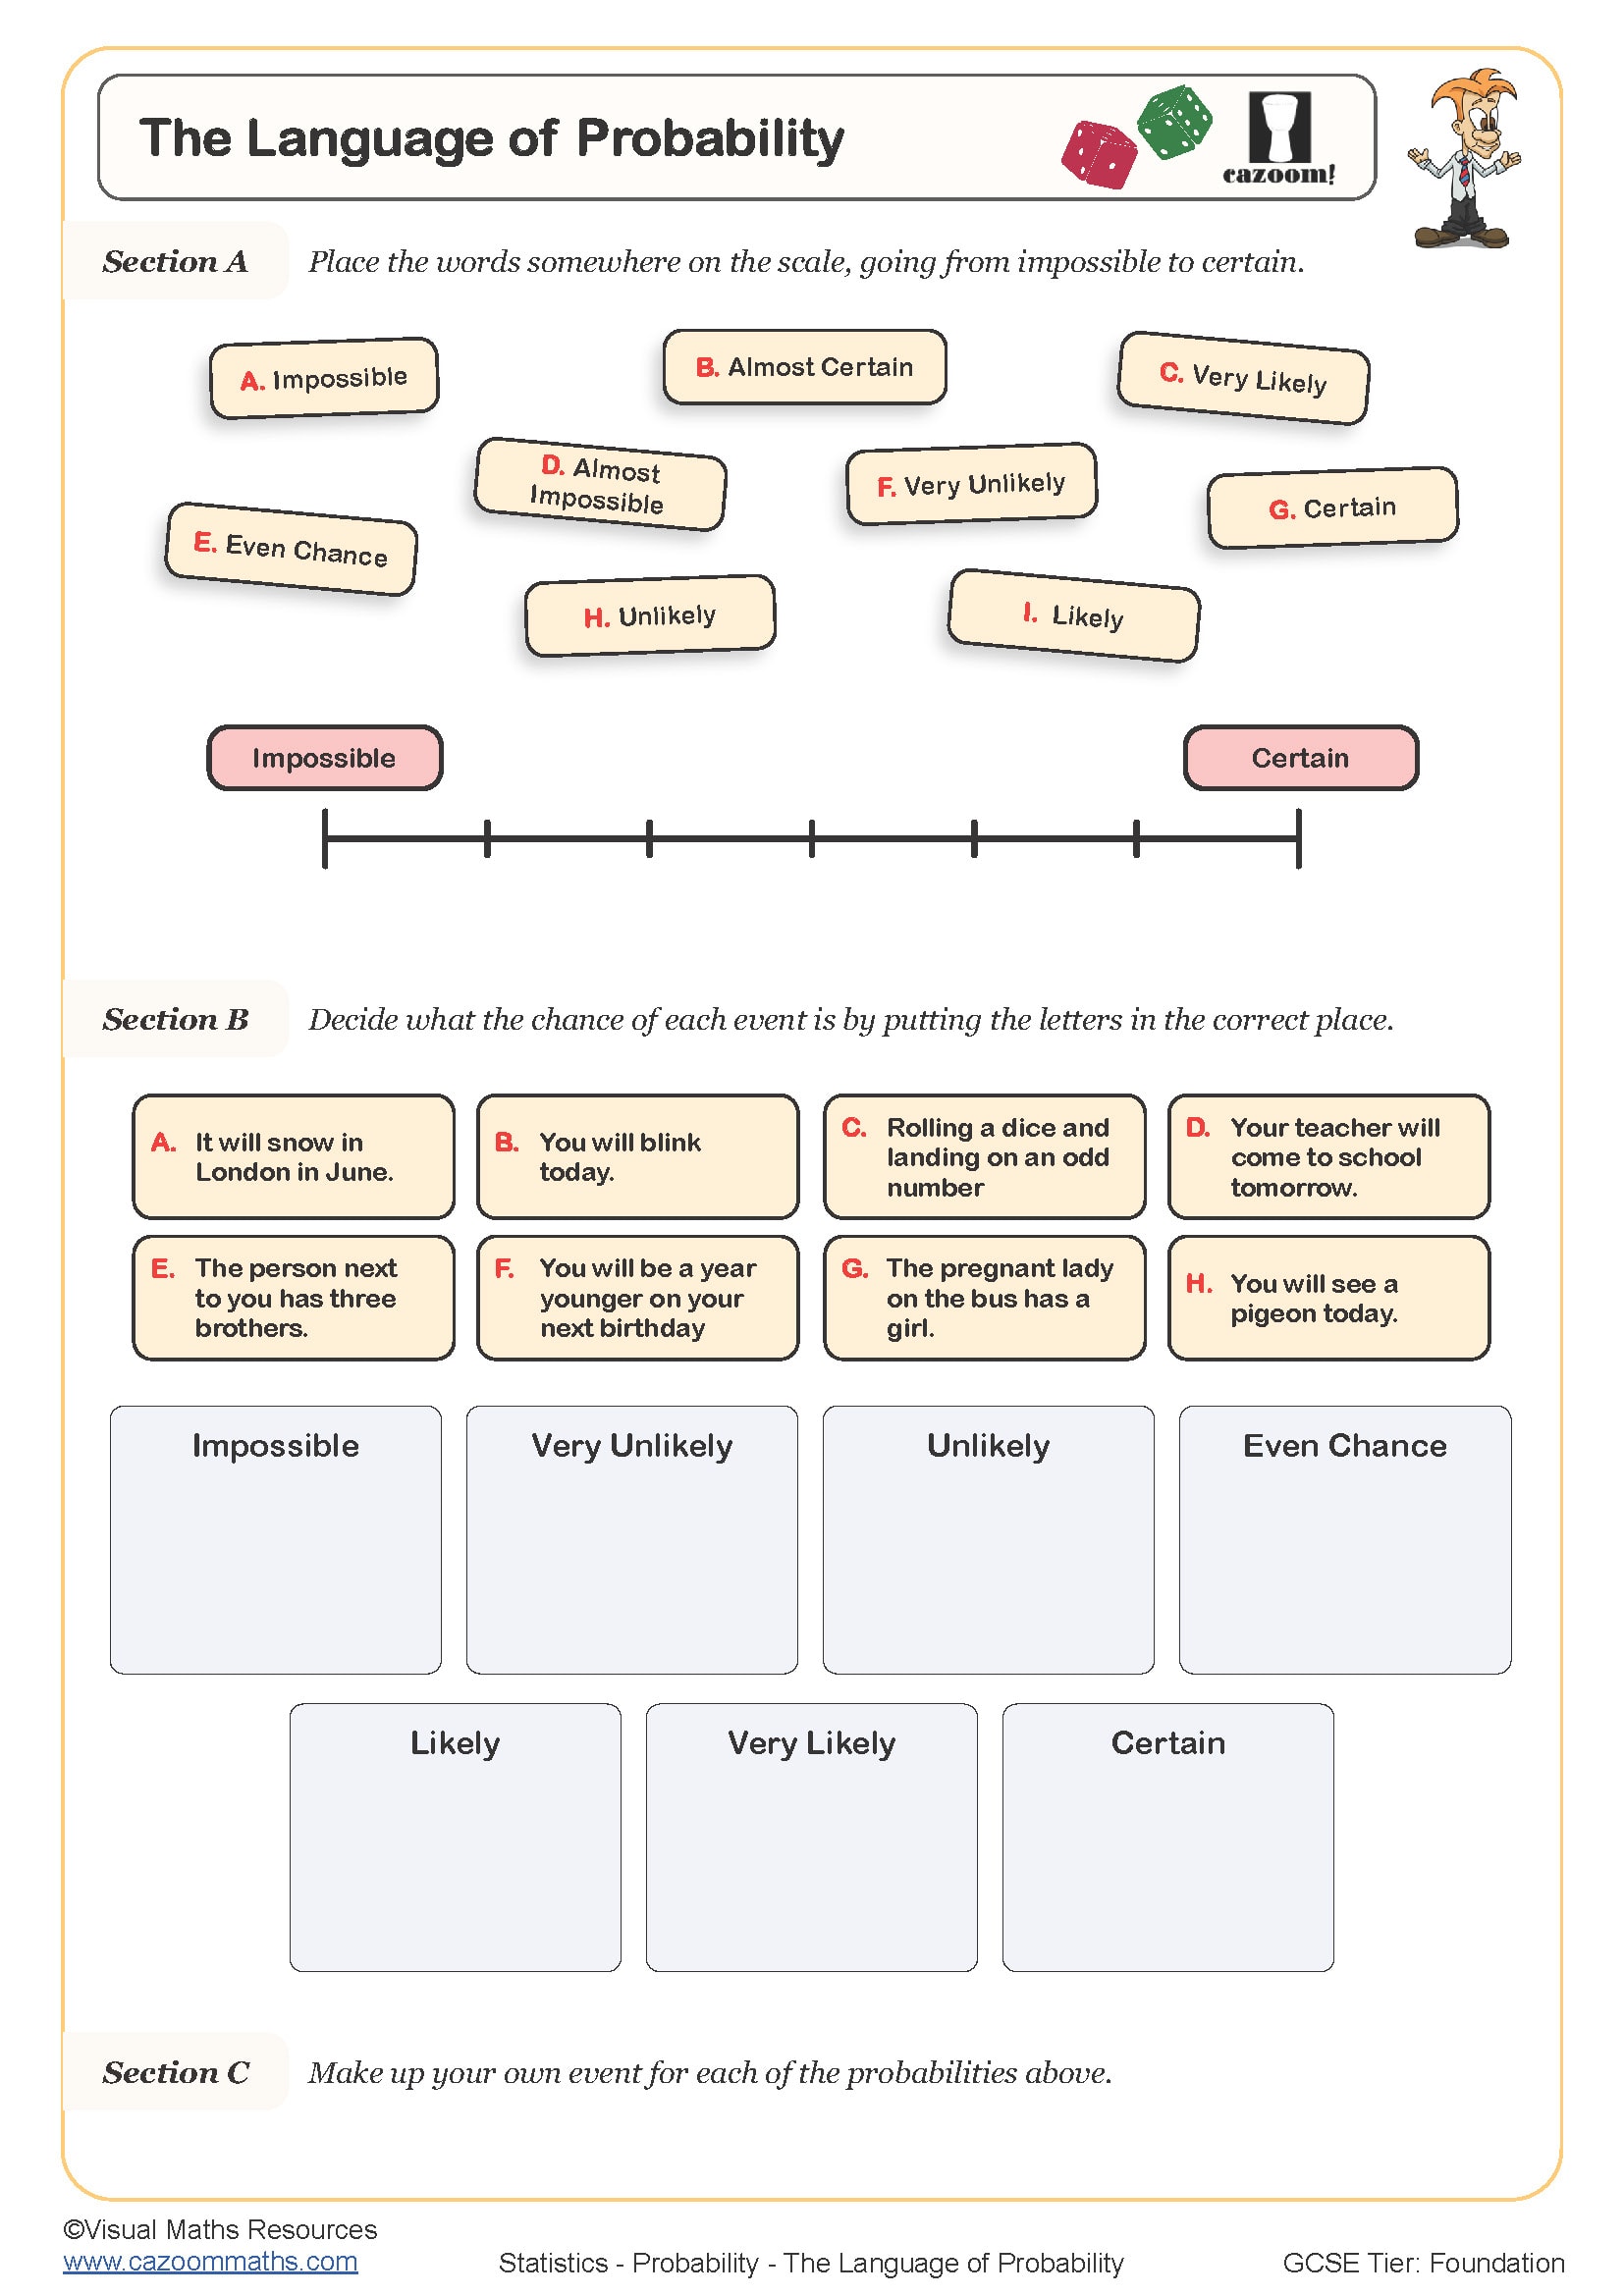
The Language of Probability
Year groups: 7
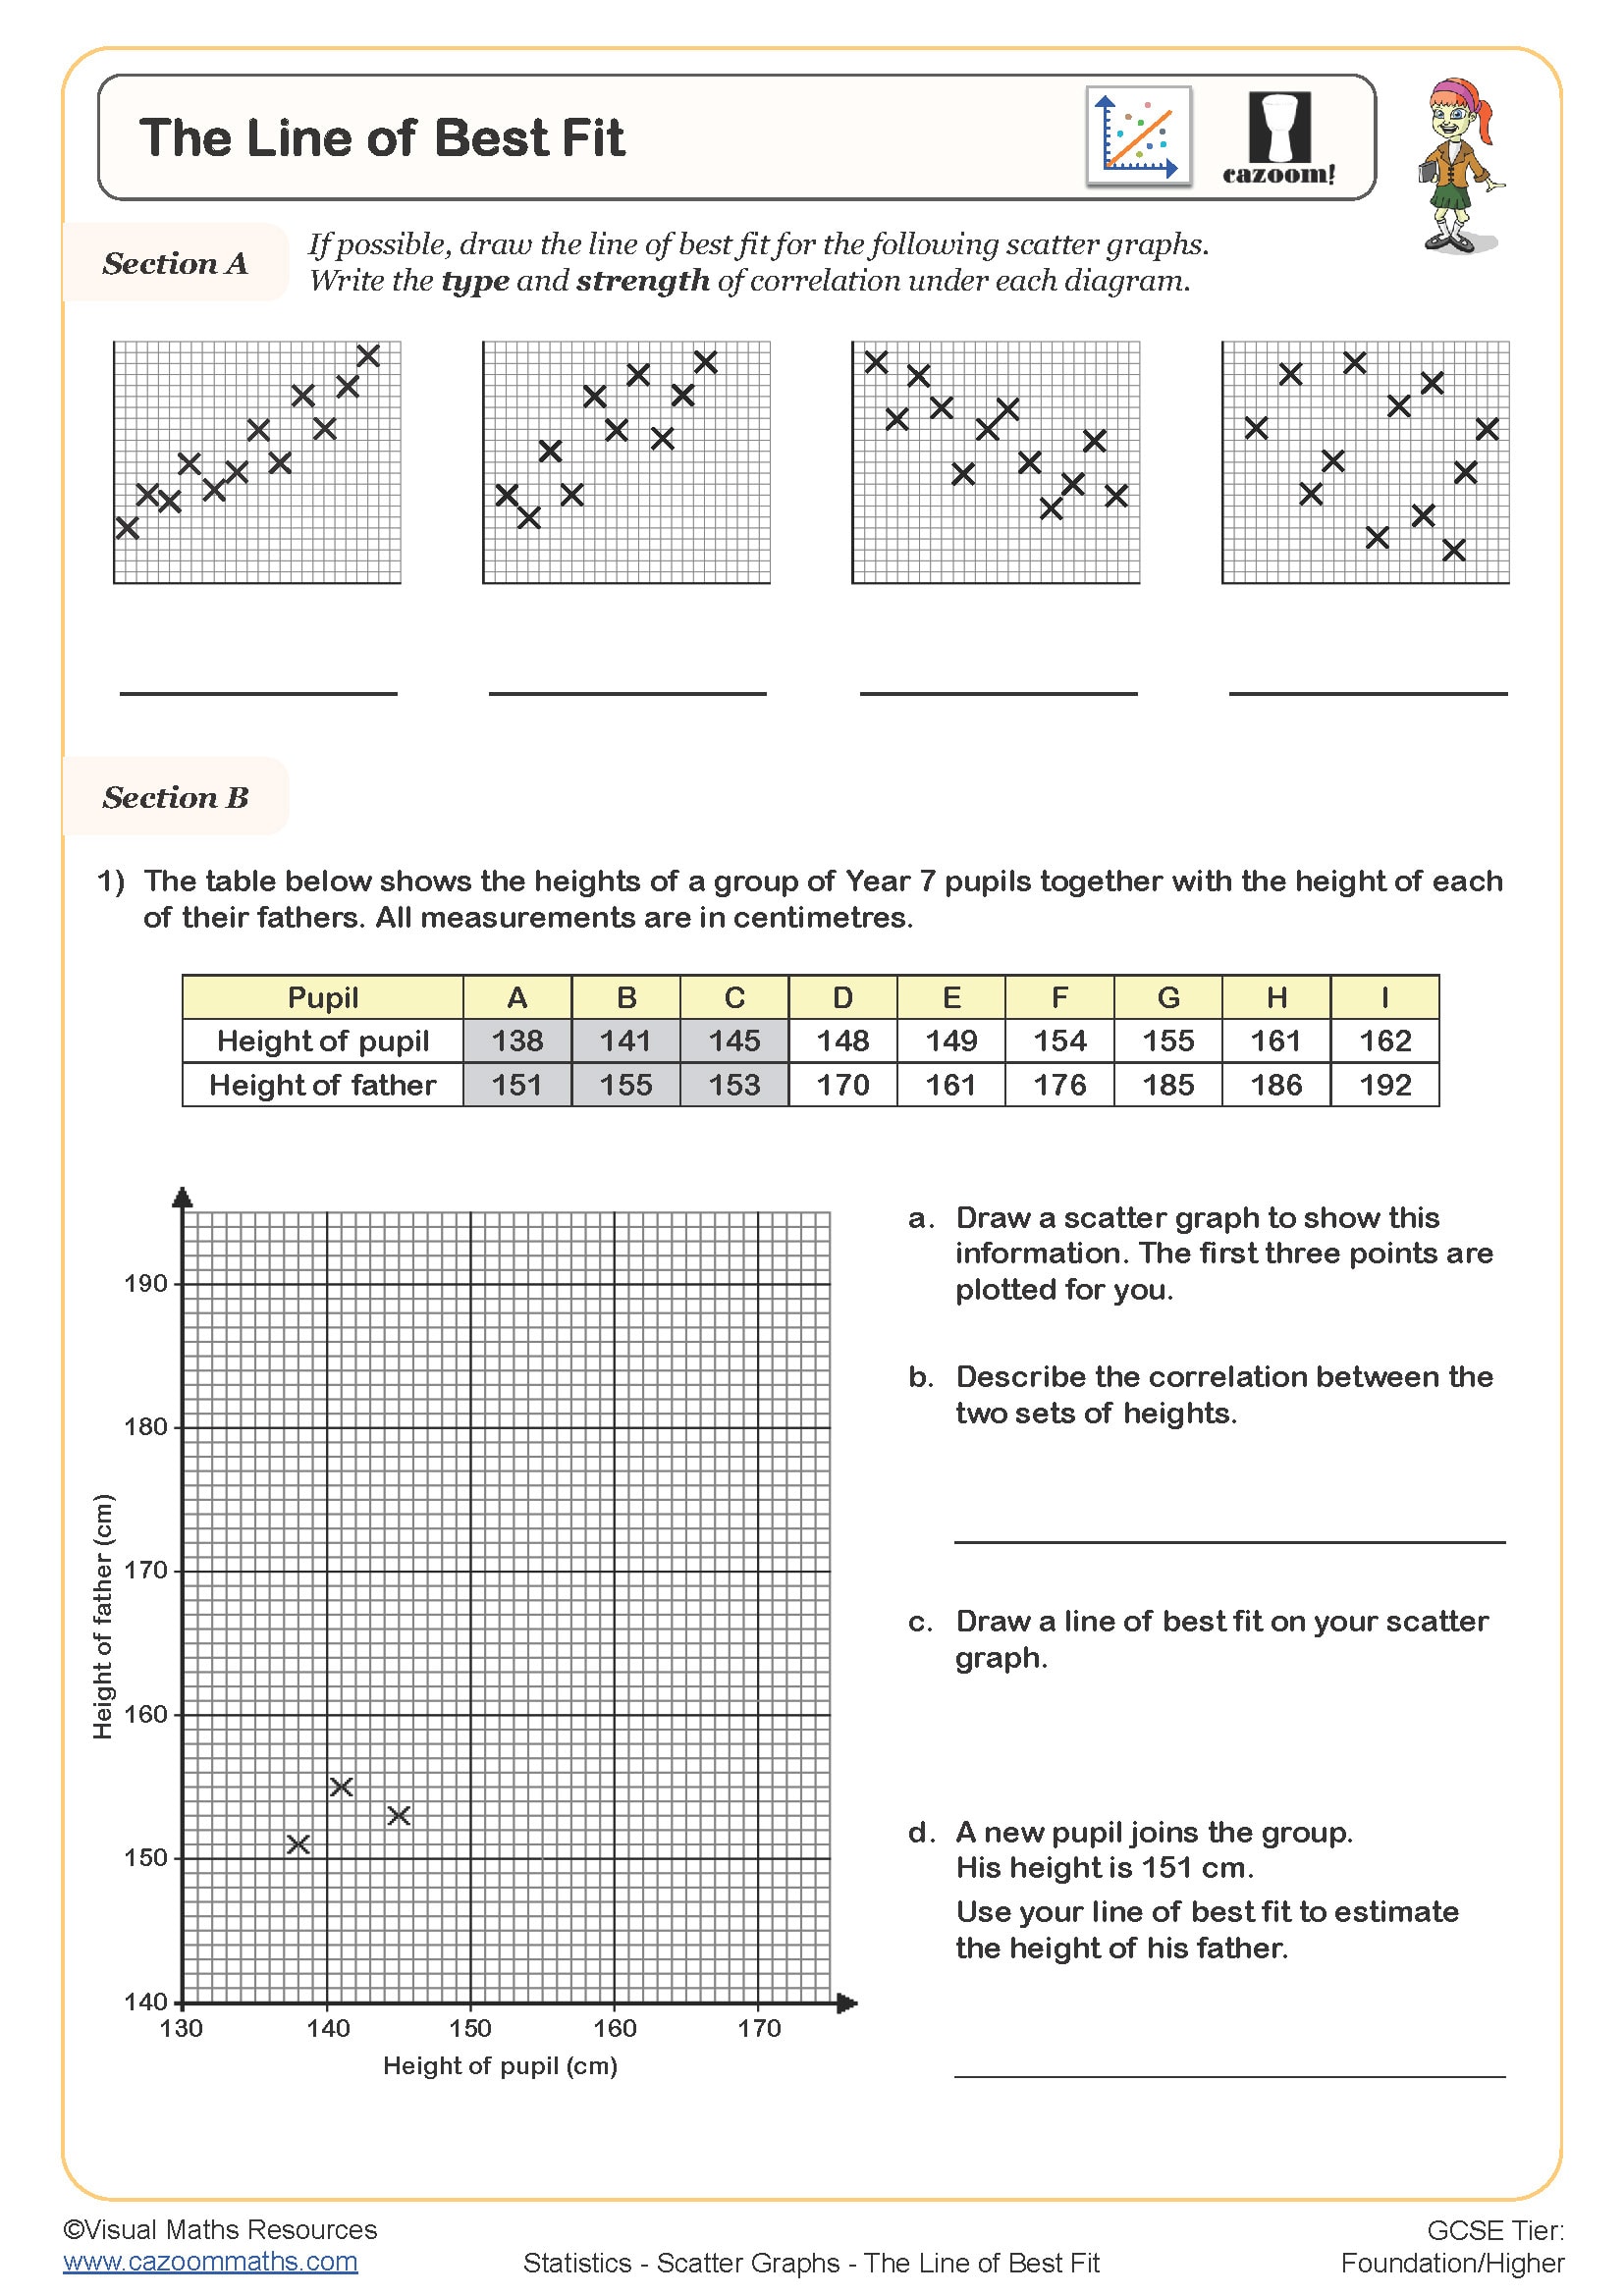
The Line of Best Fit
Year groups: 7, 8
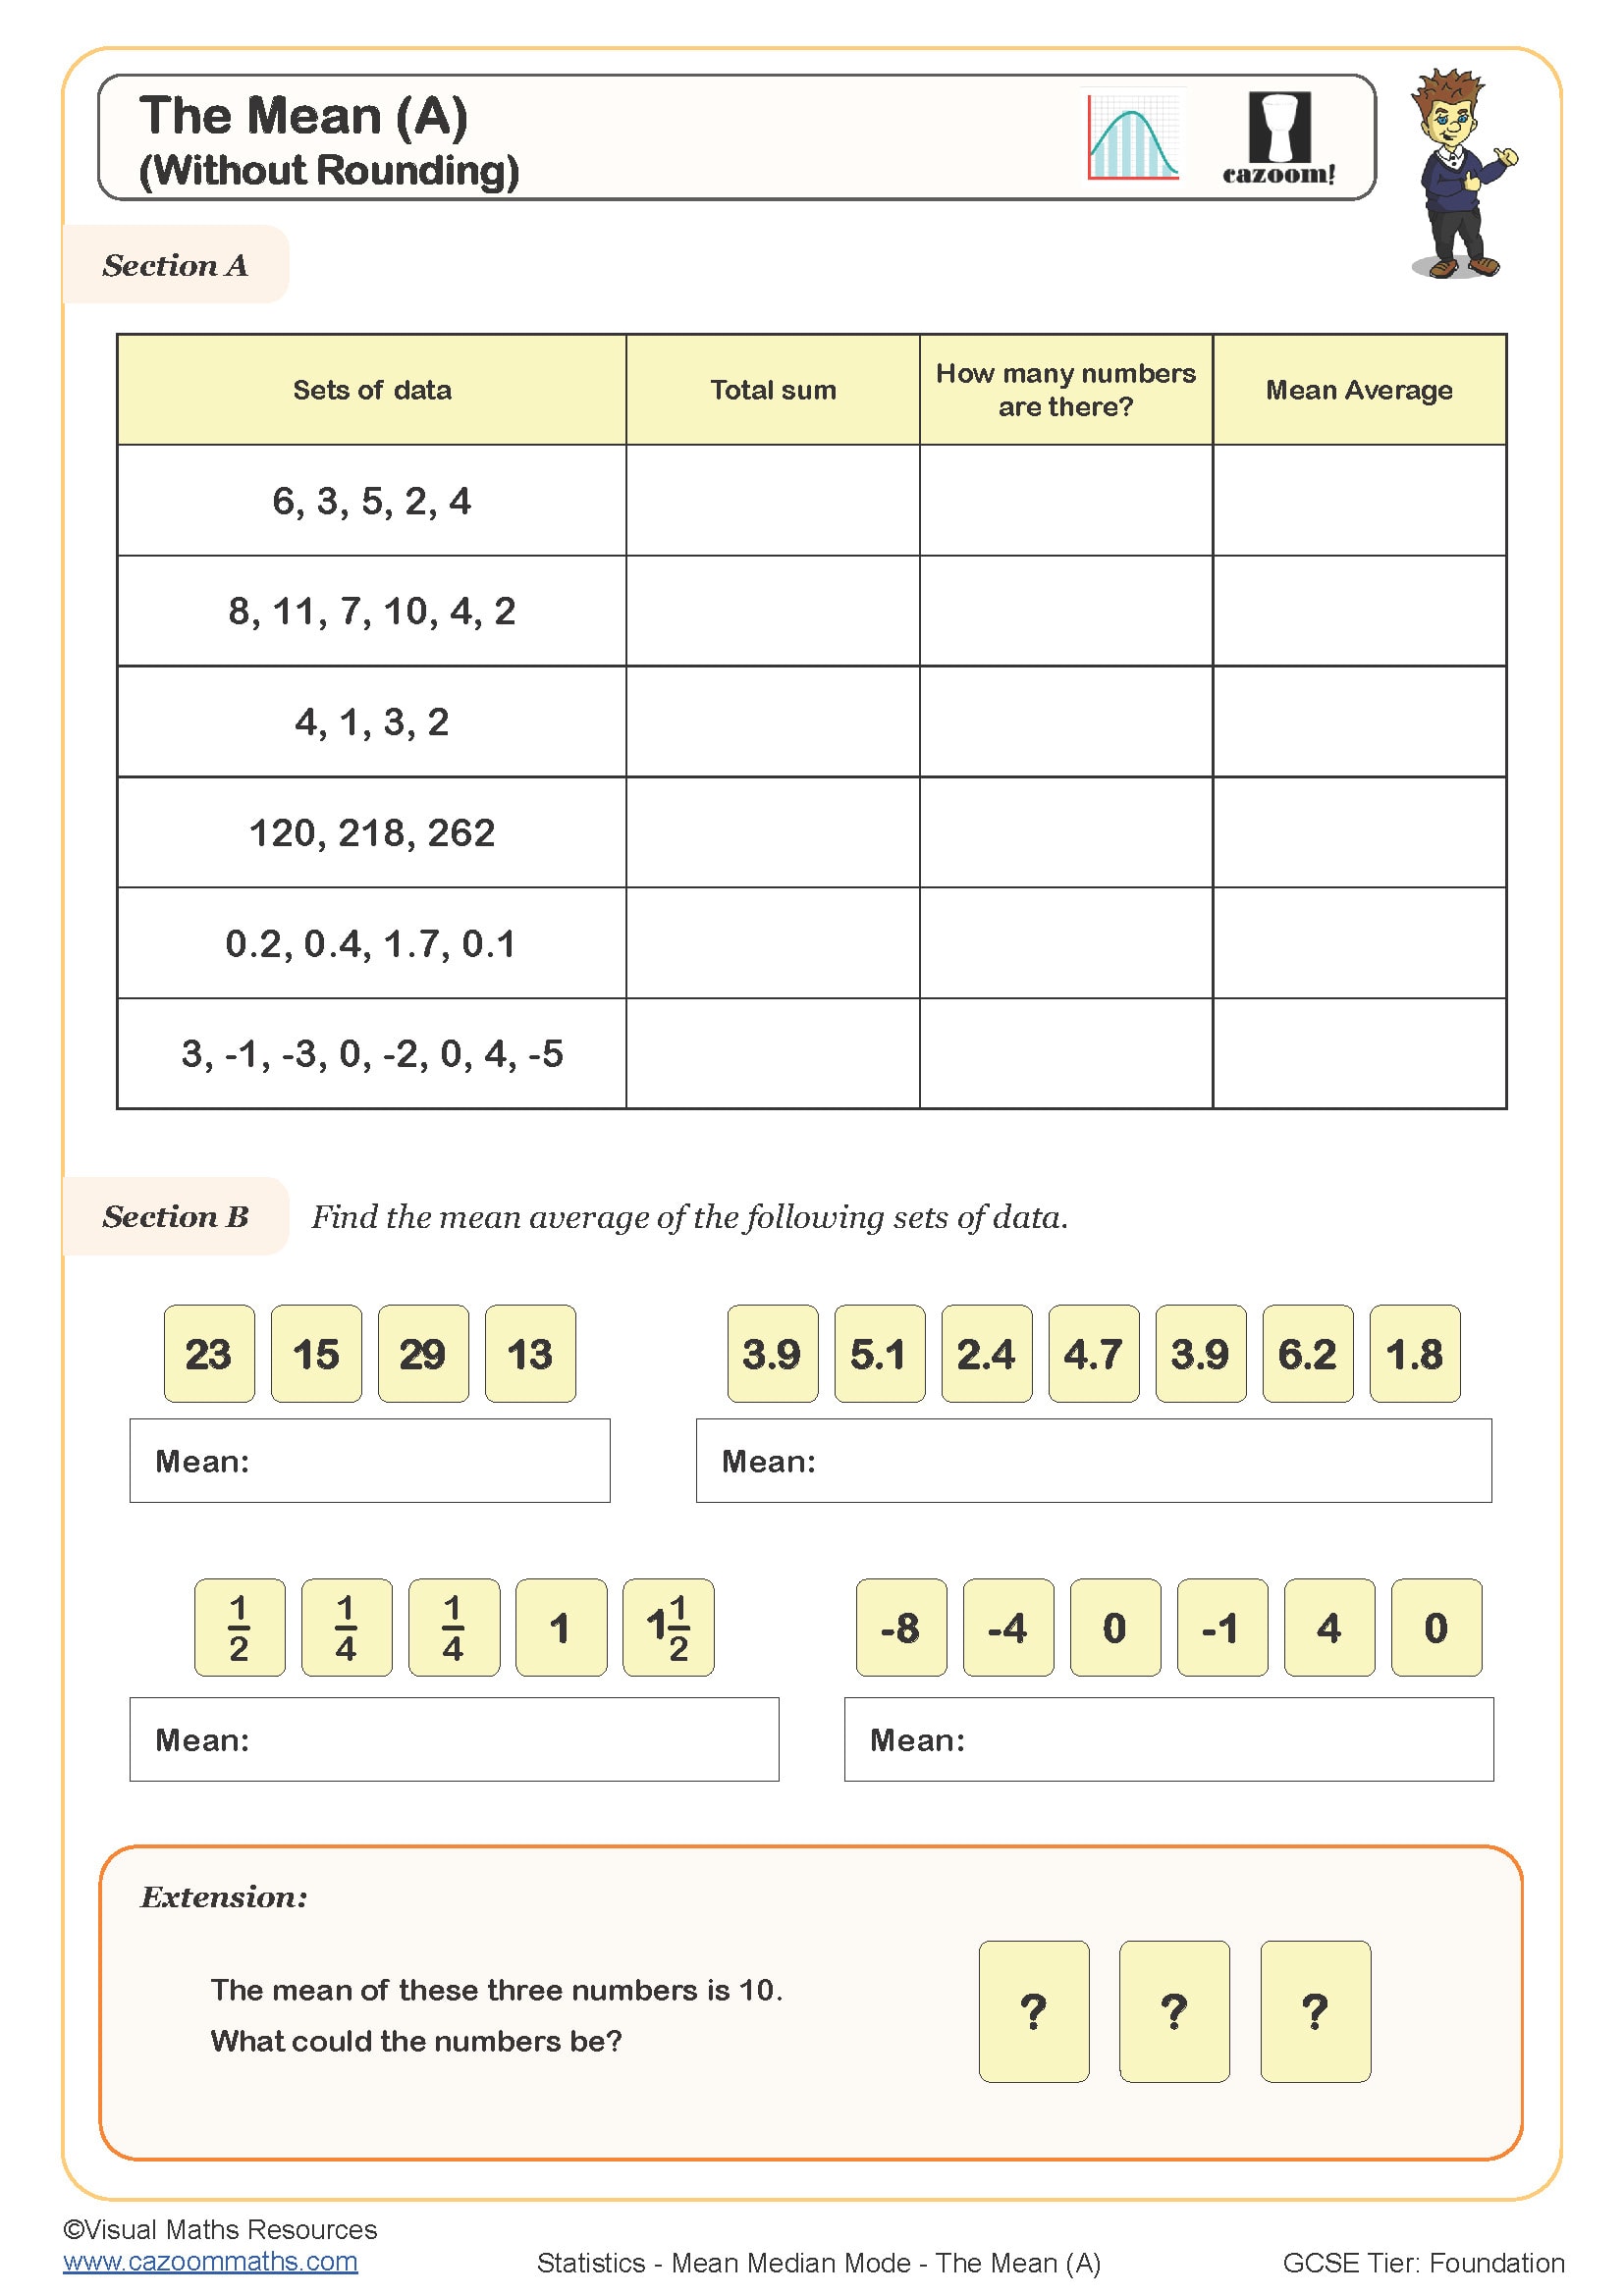
The Mean (A)
Year groups: 7, 8
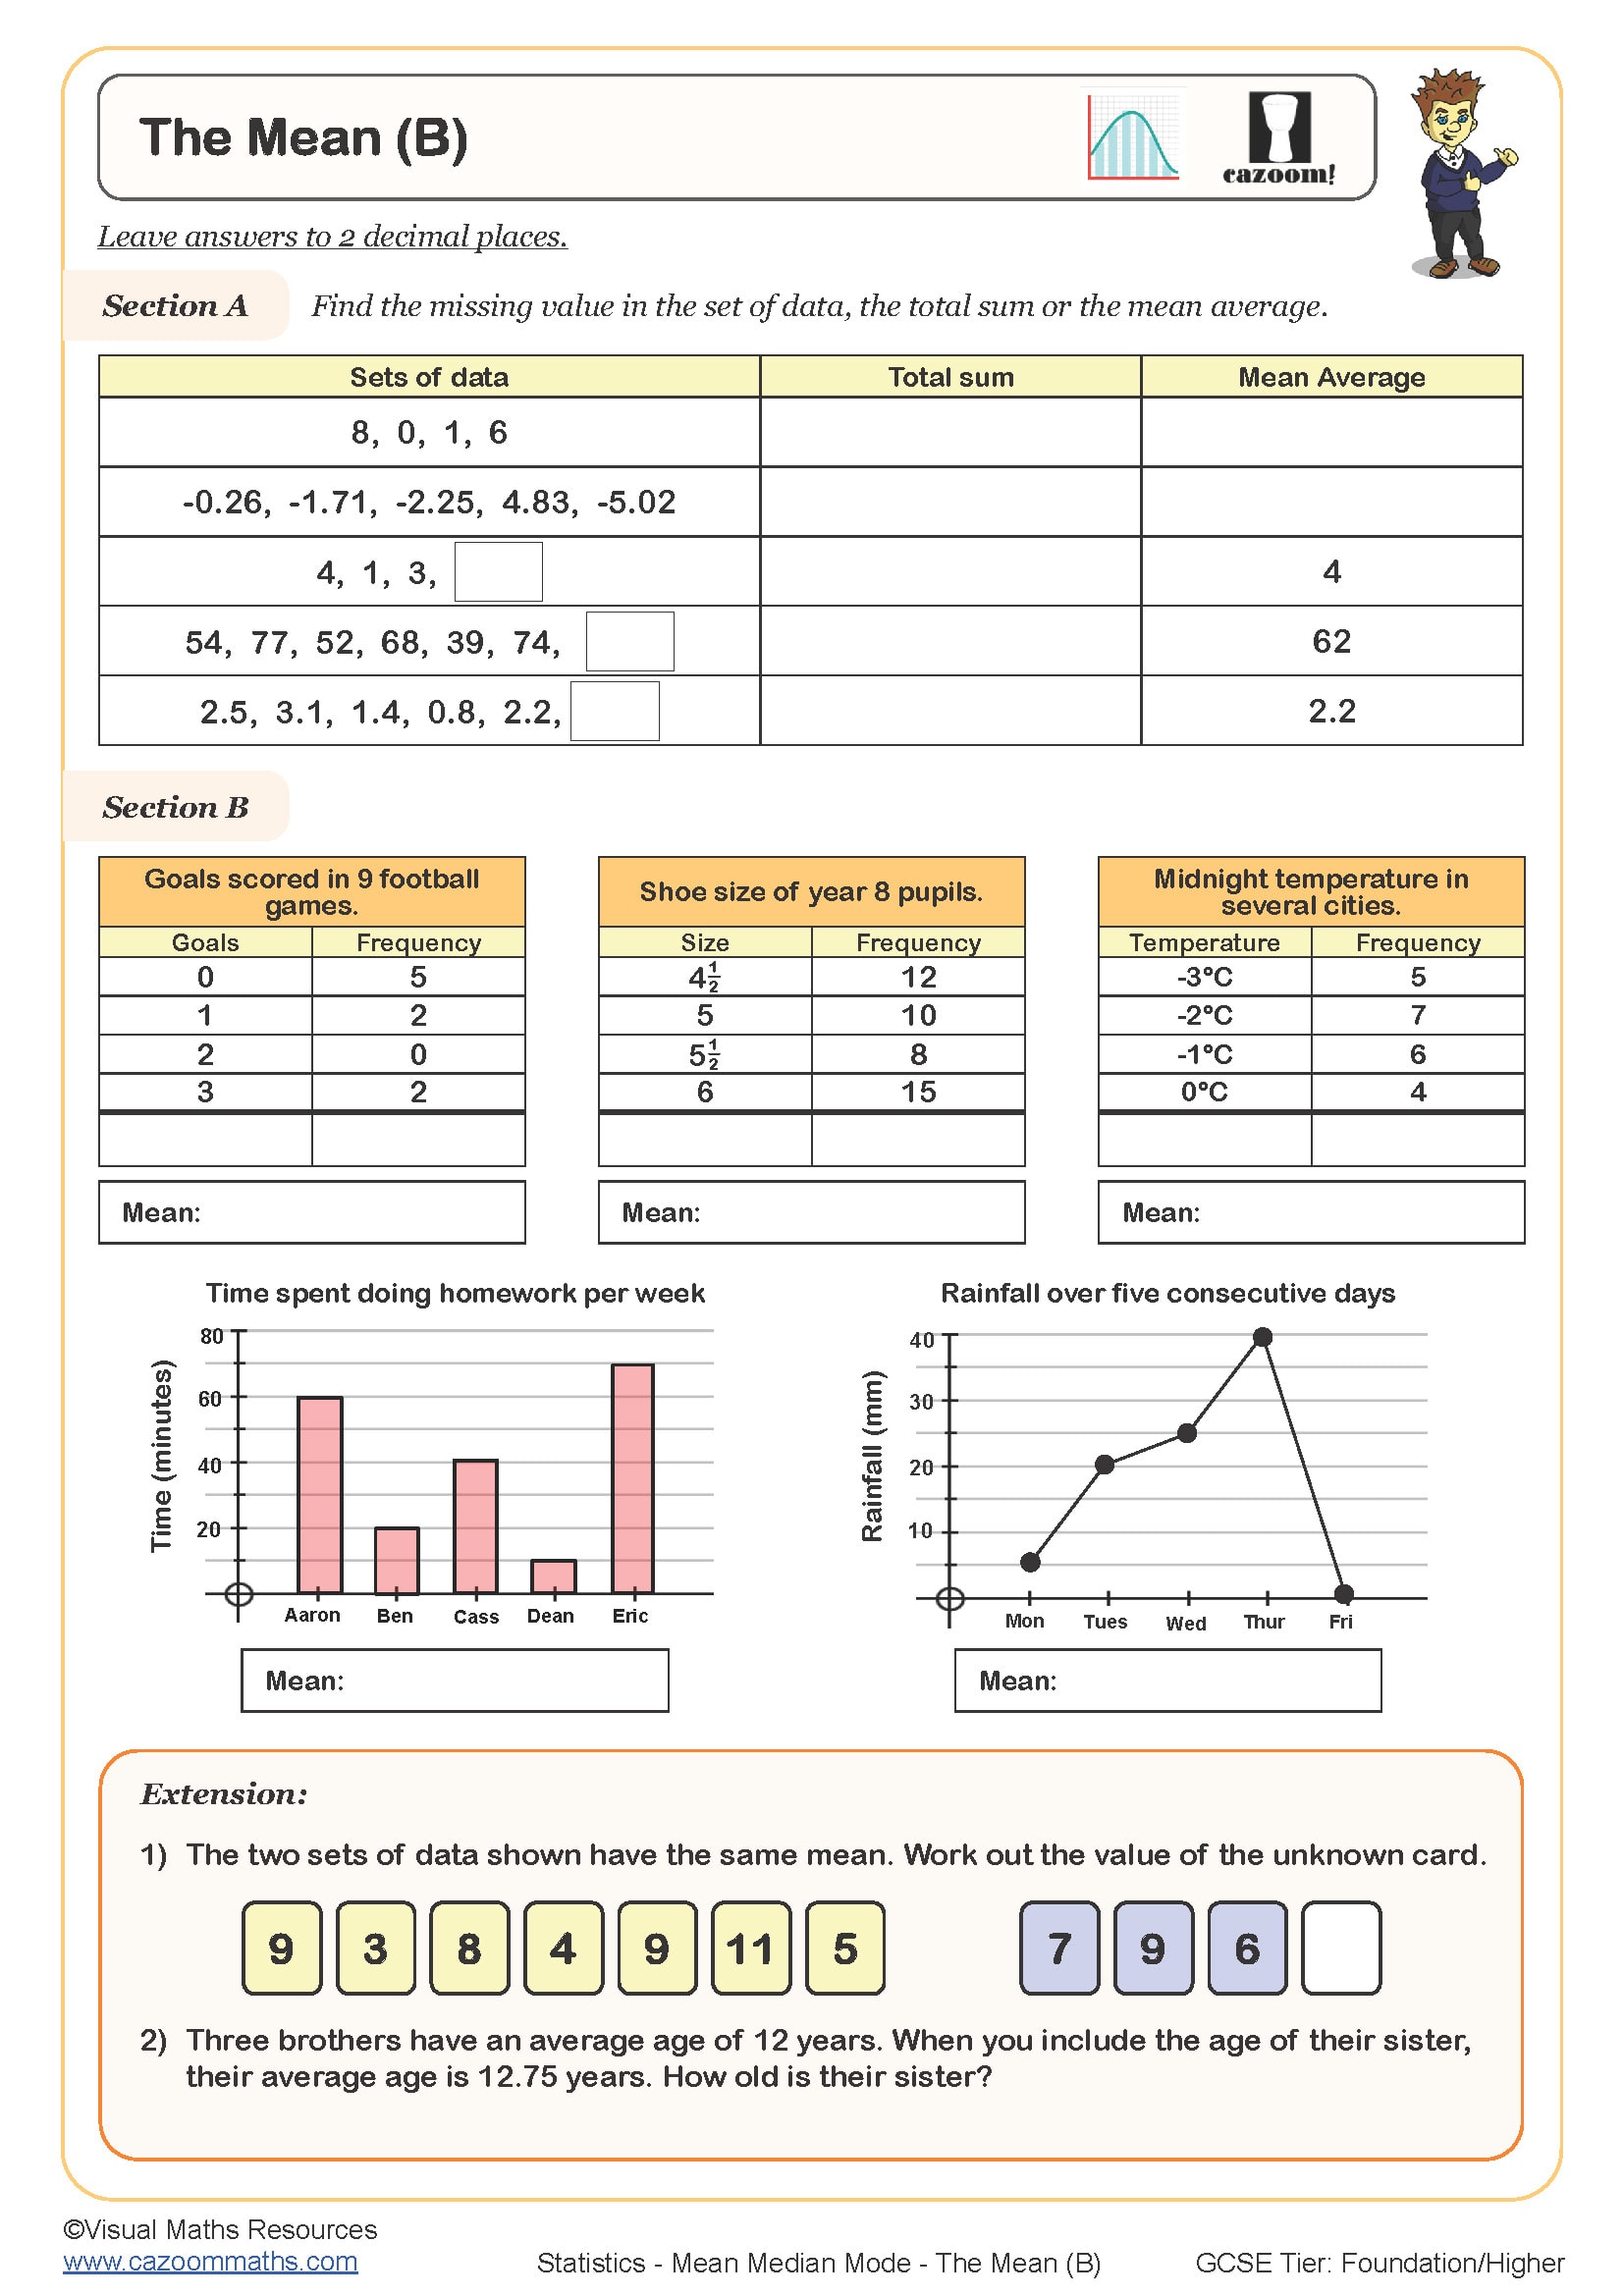
The Mean (B)
Year groups: 7, 8
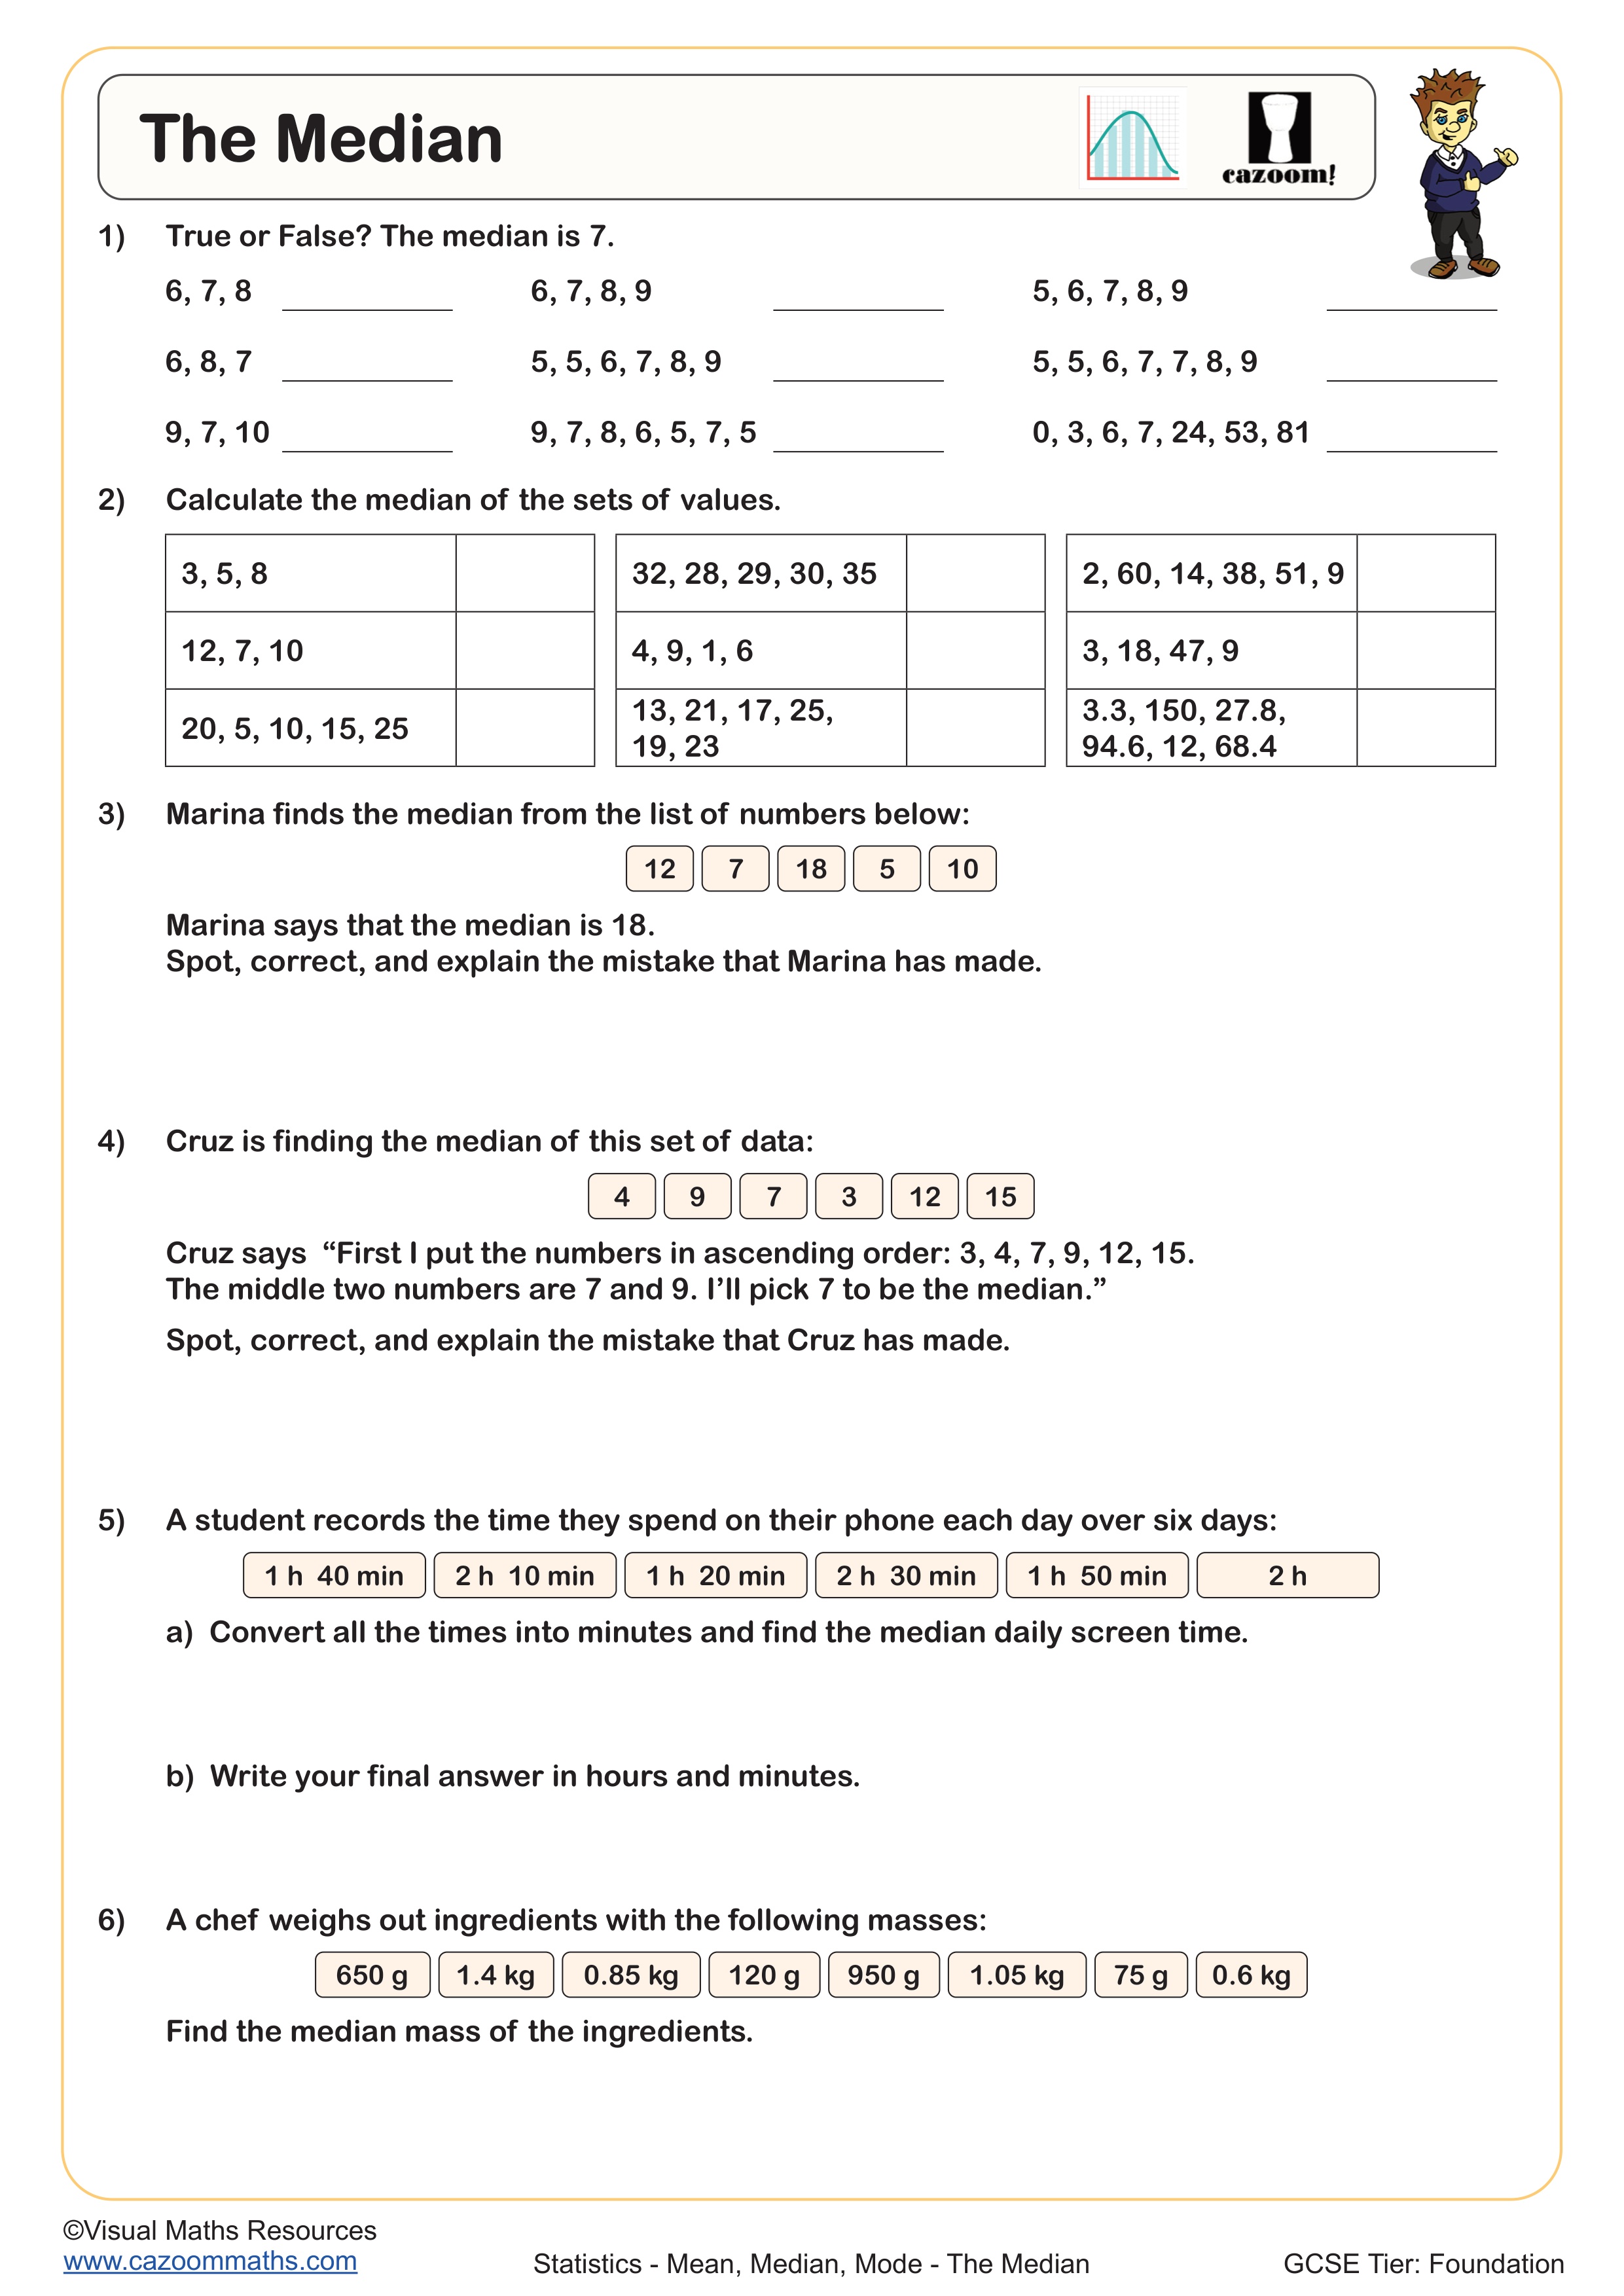
The Median
Year groups: 7, 8
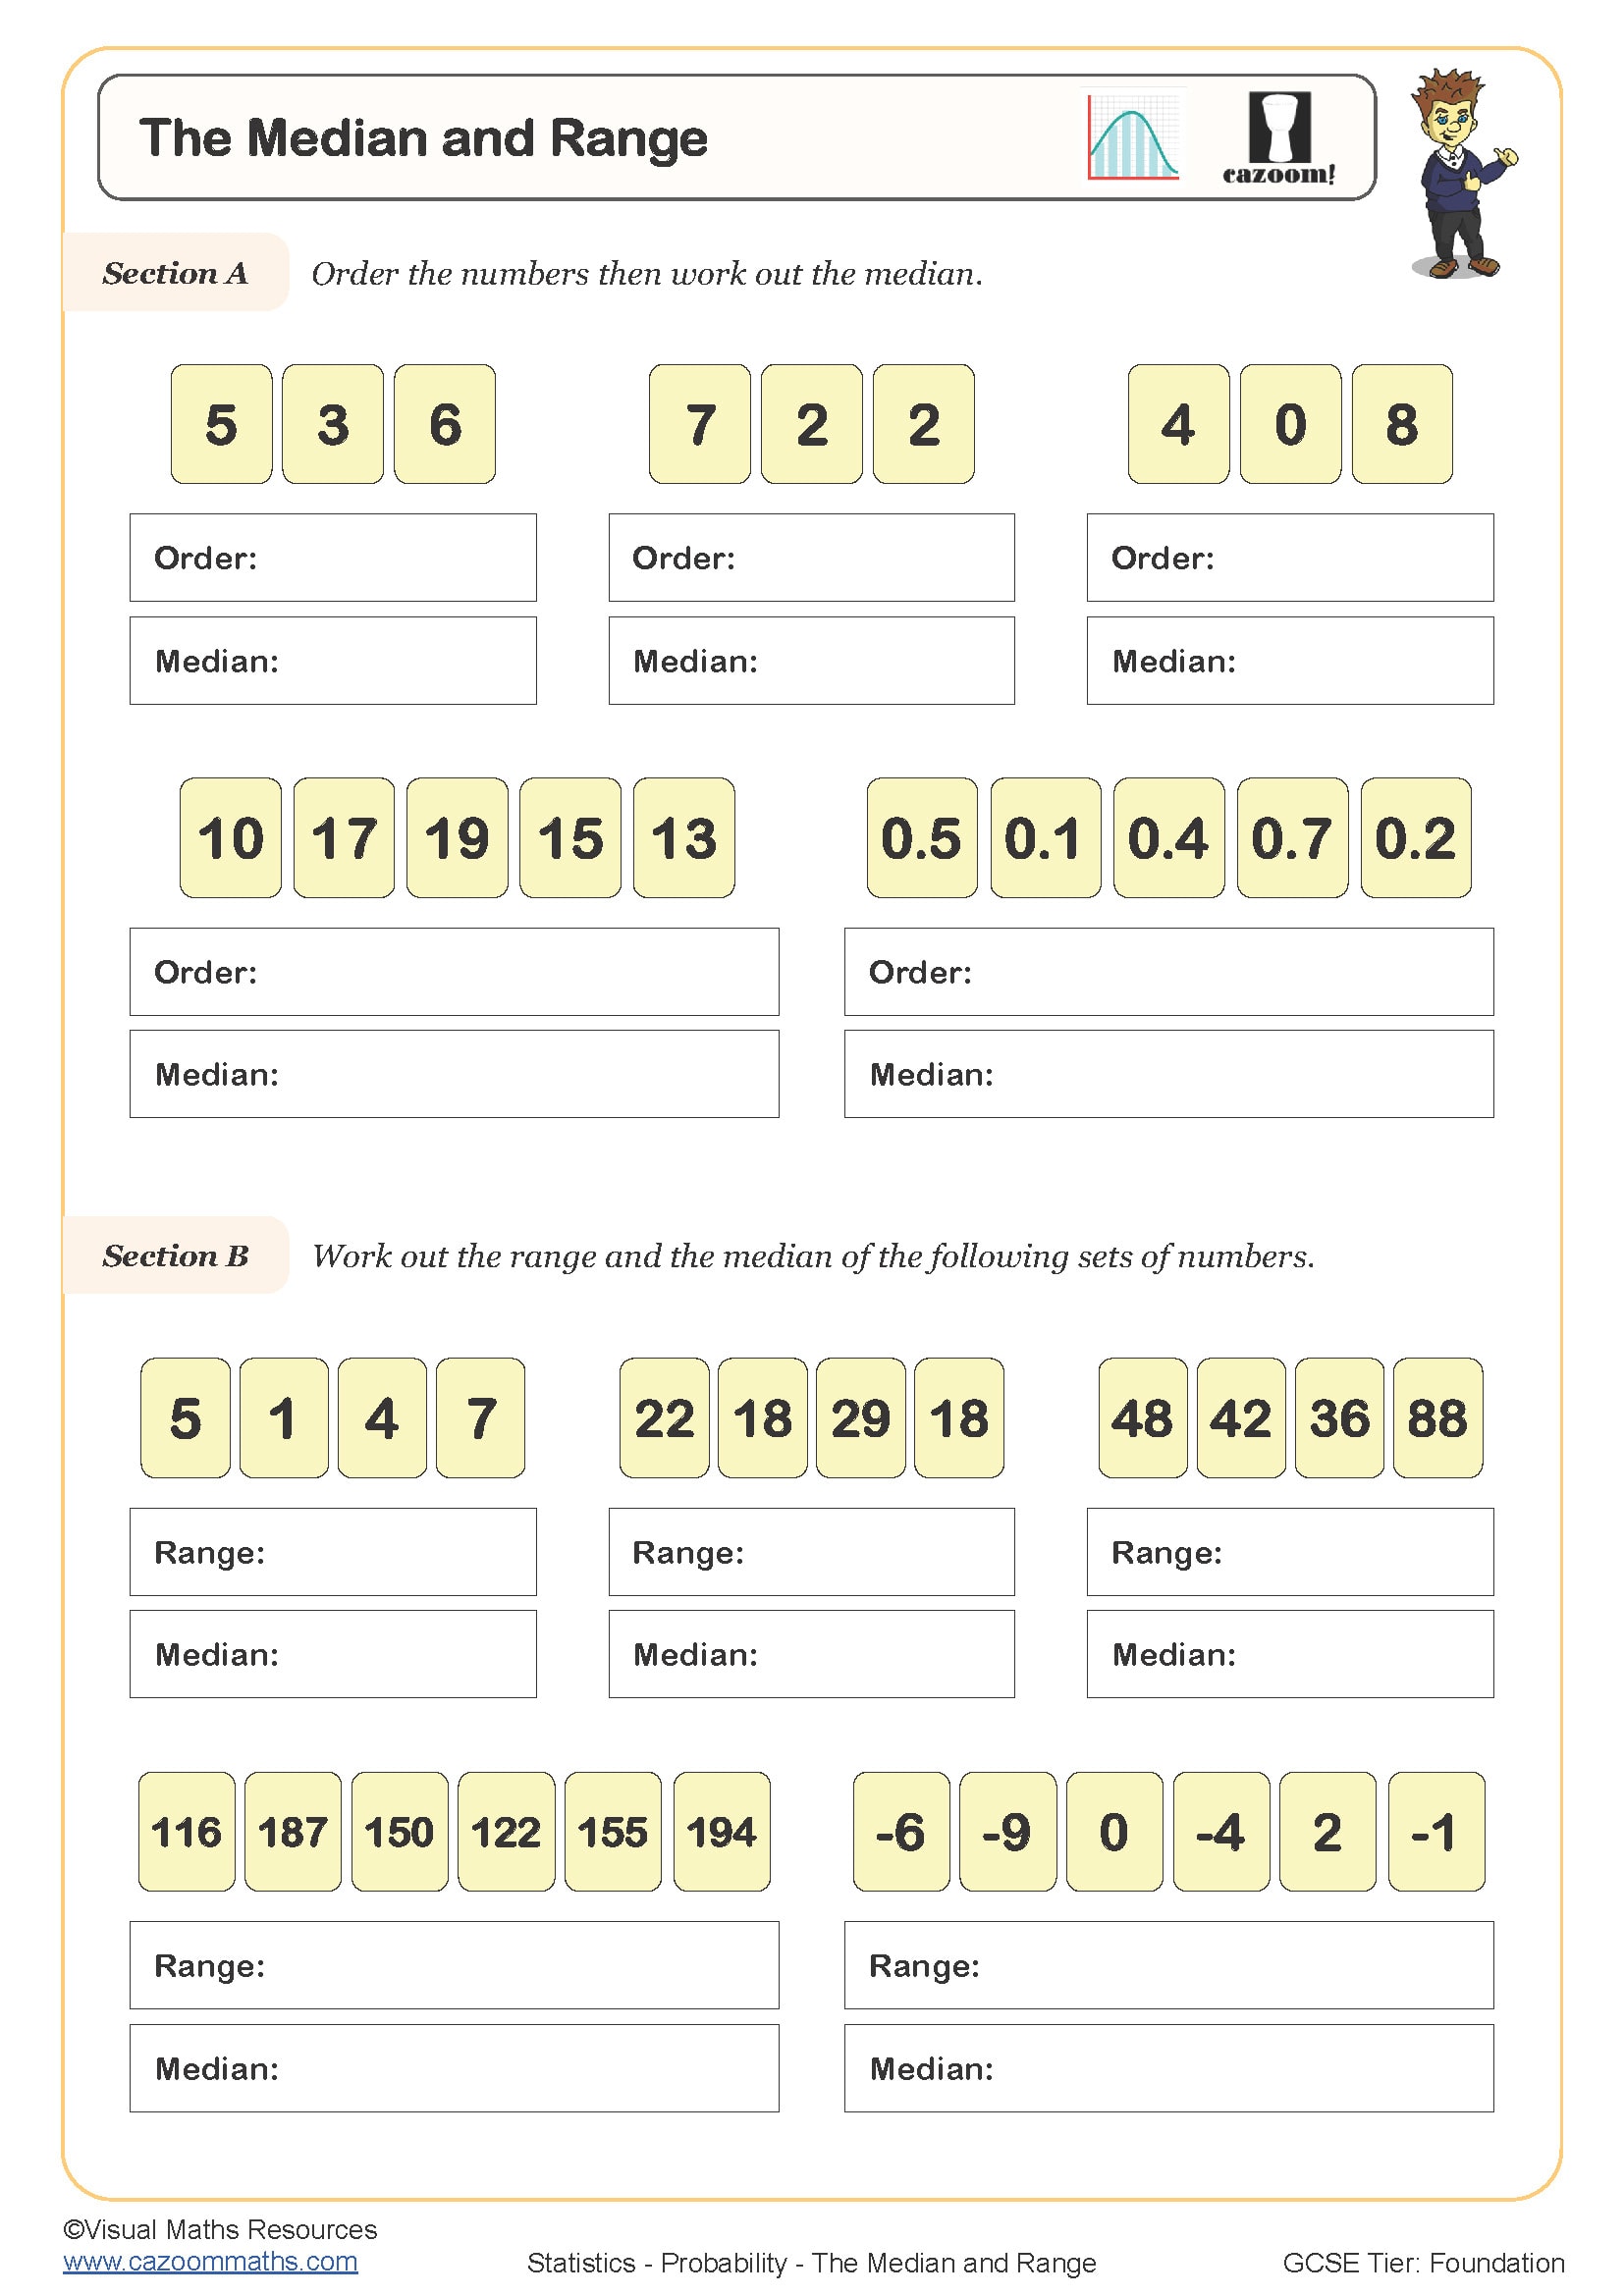
The Median and Range
Year groups: 7, 8
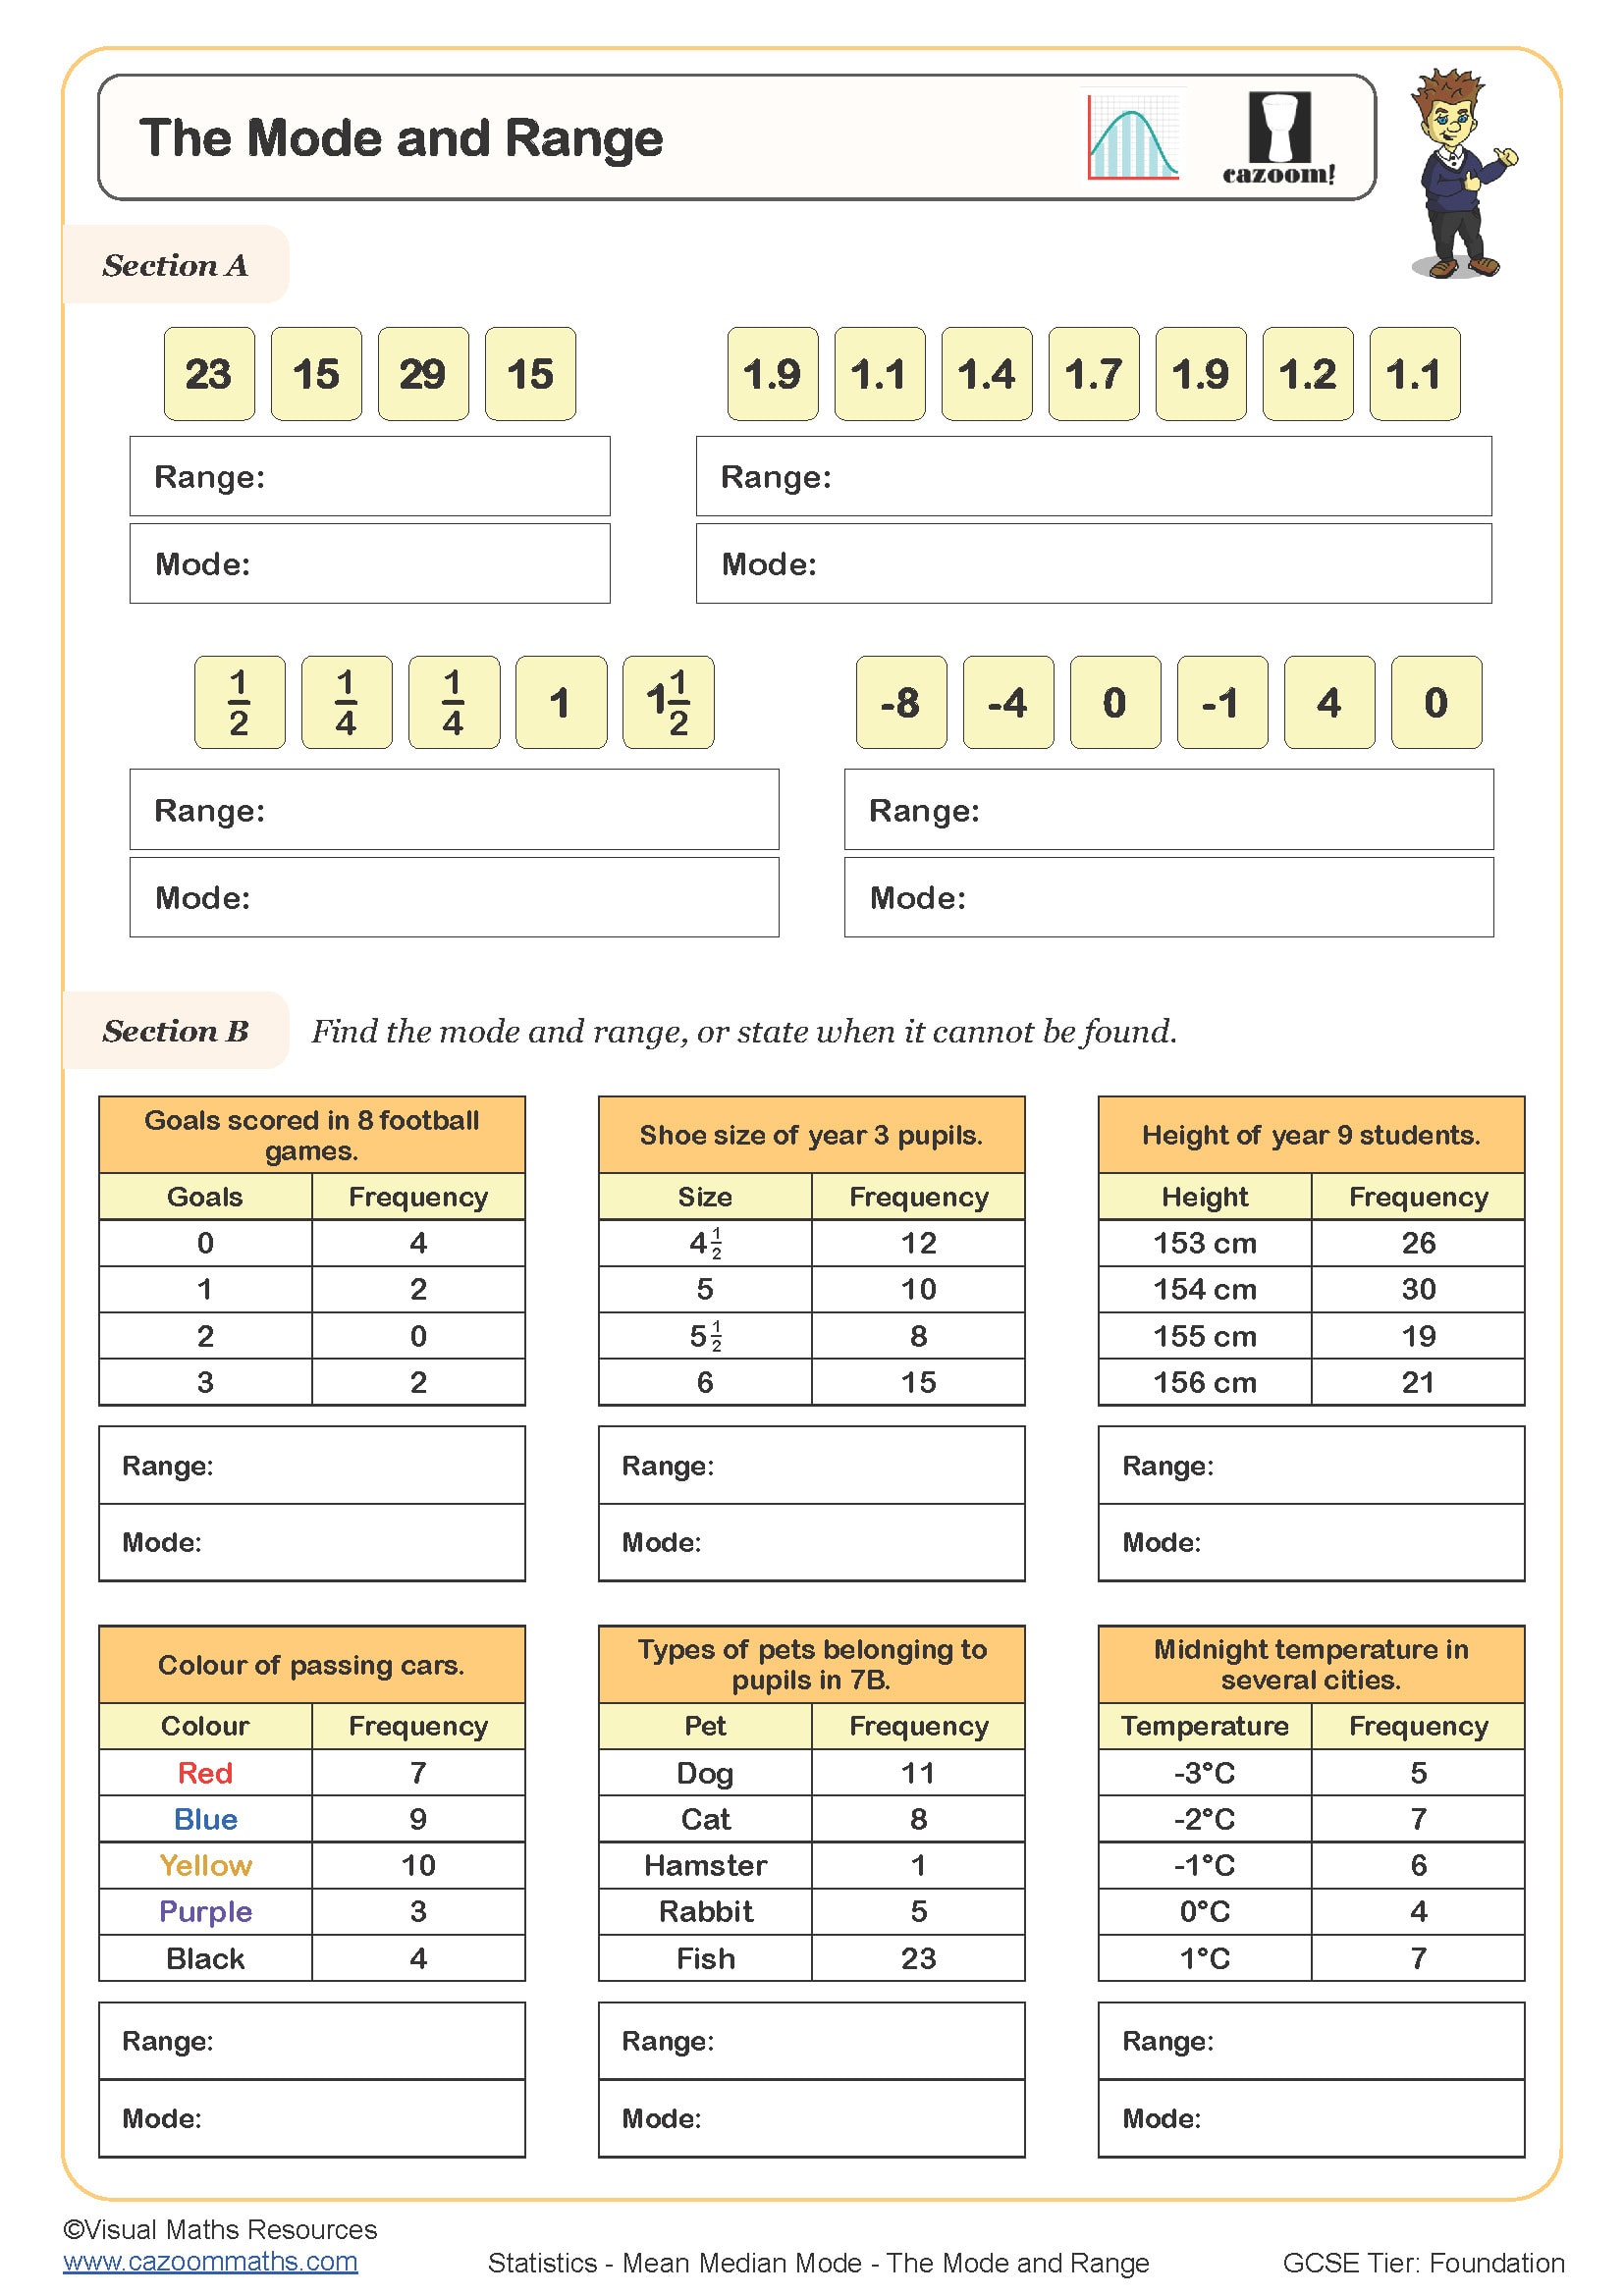
The Mode and Range
Year groups: 7, 8
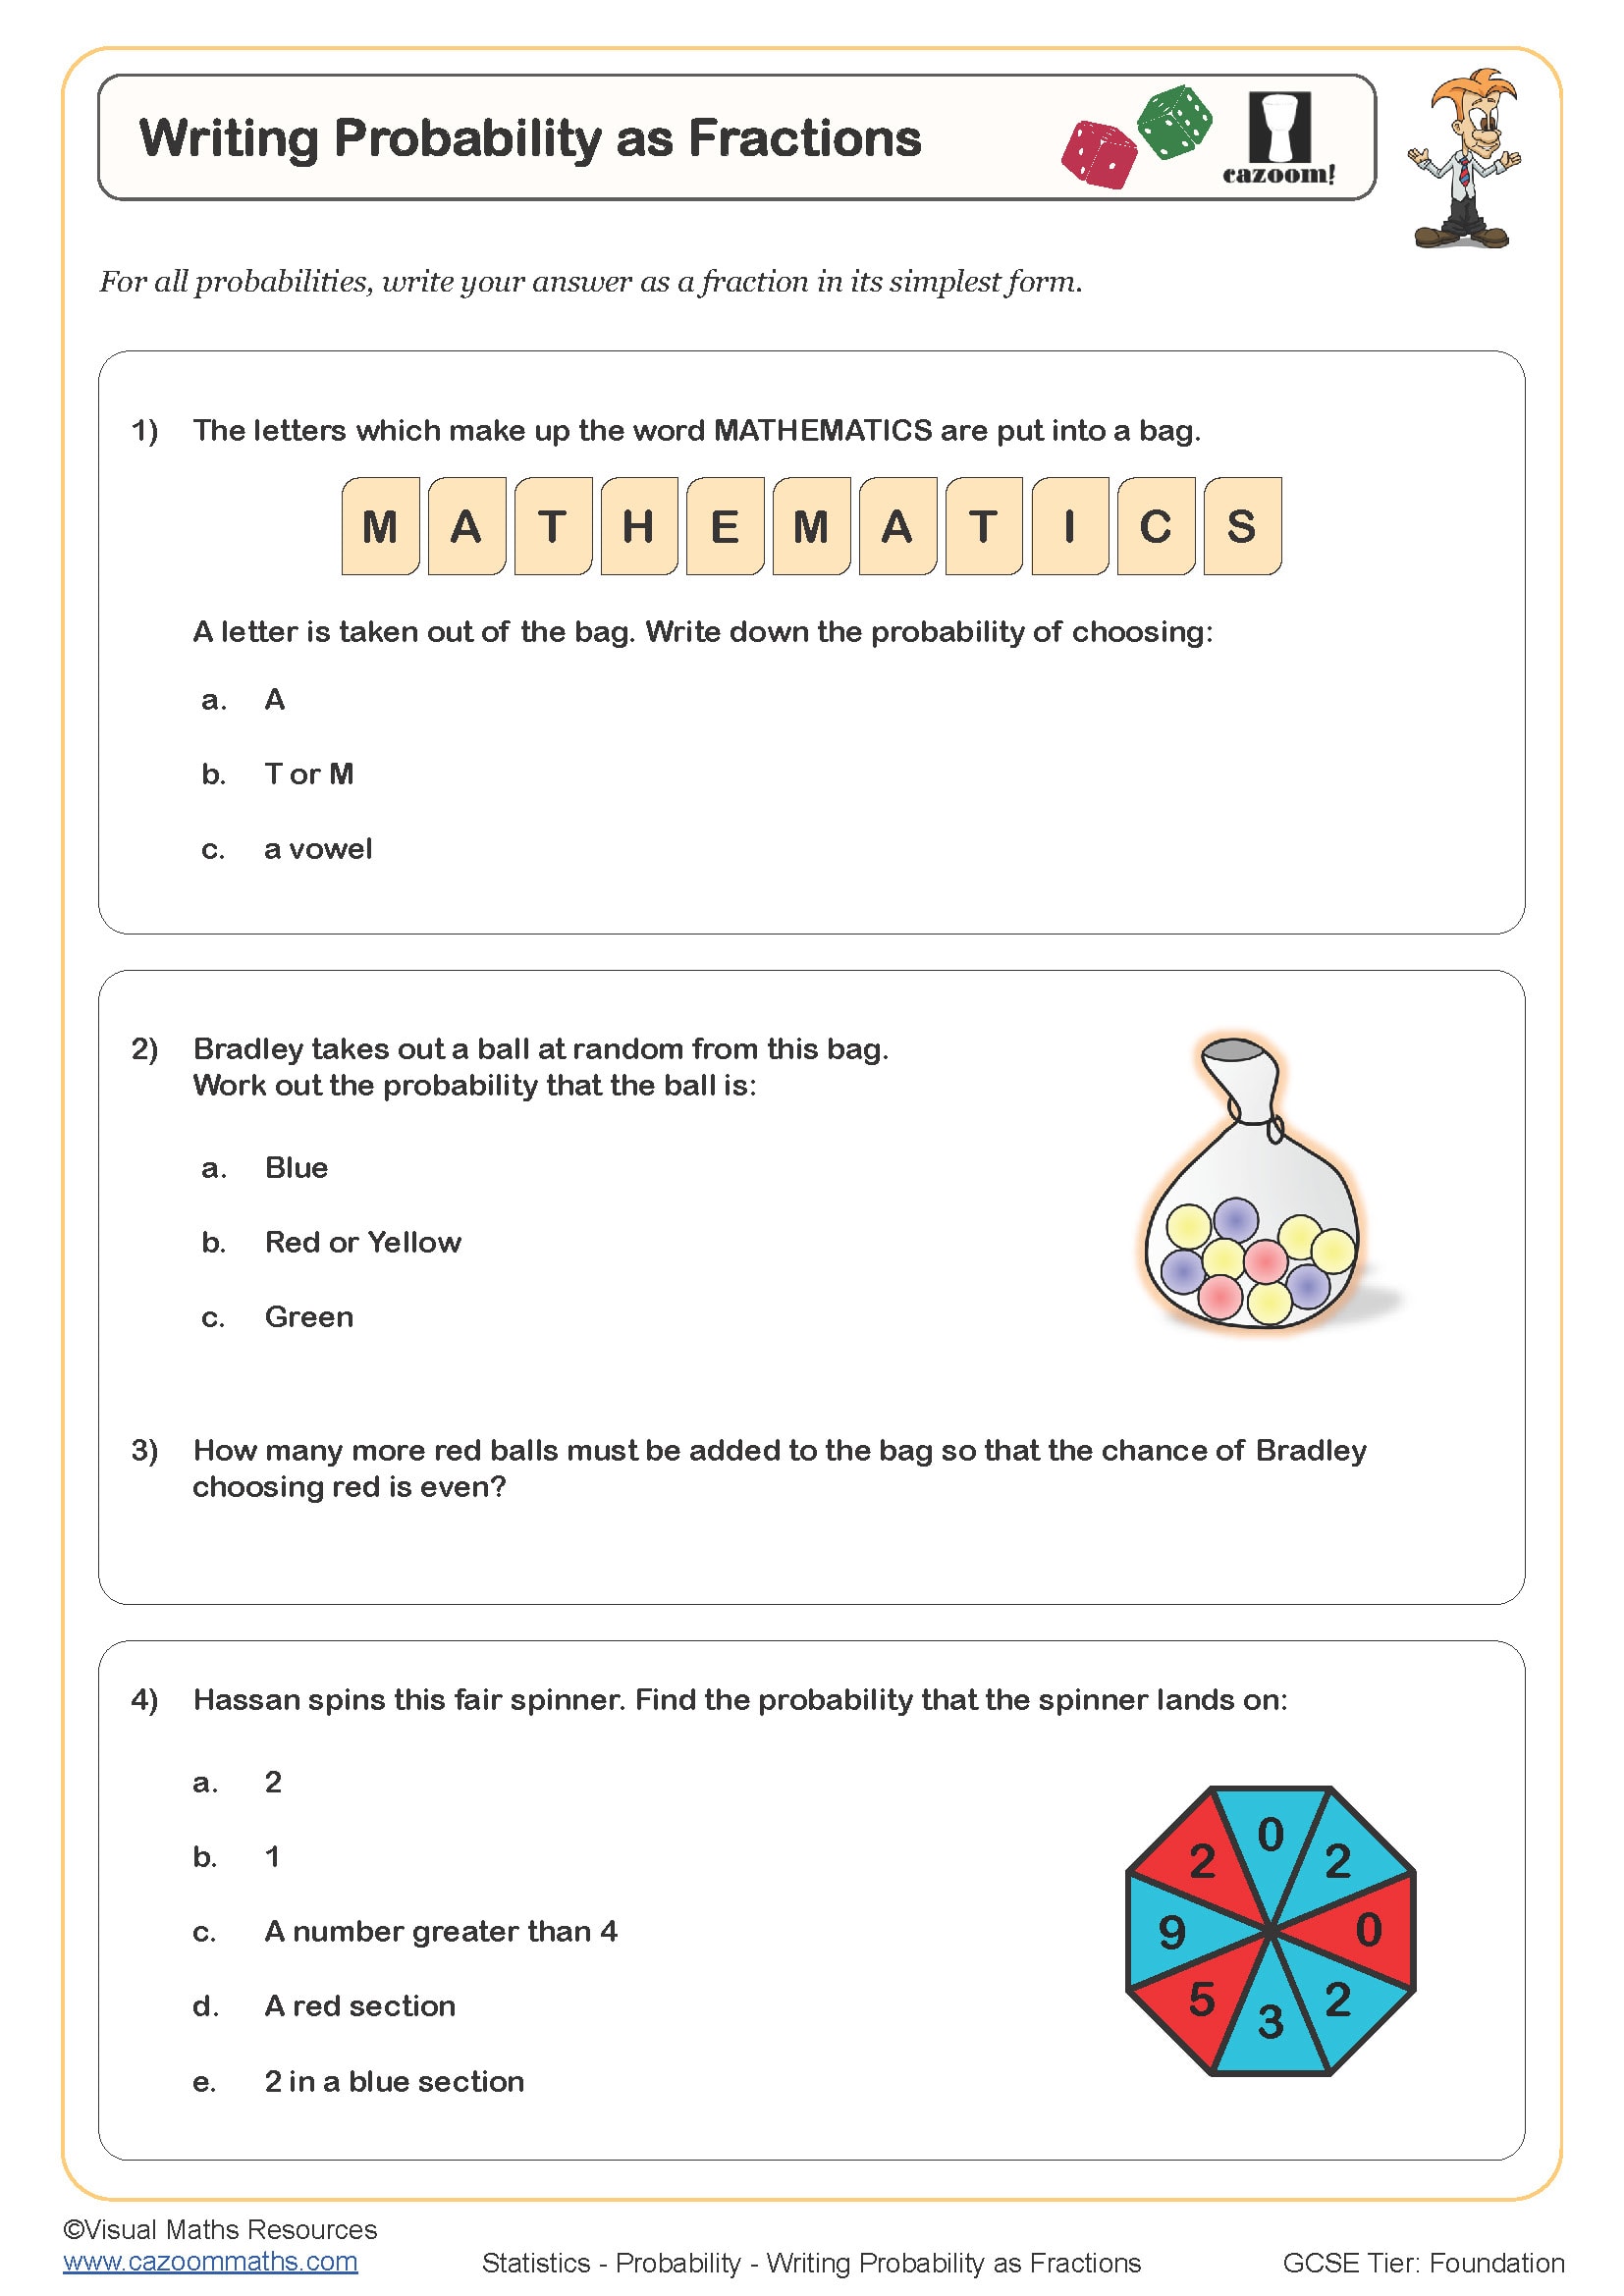
Writing Probabilty as Fractions
Year groups: 7, 8
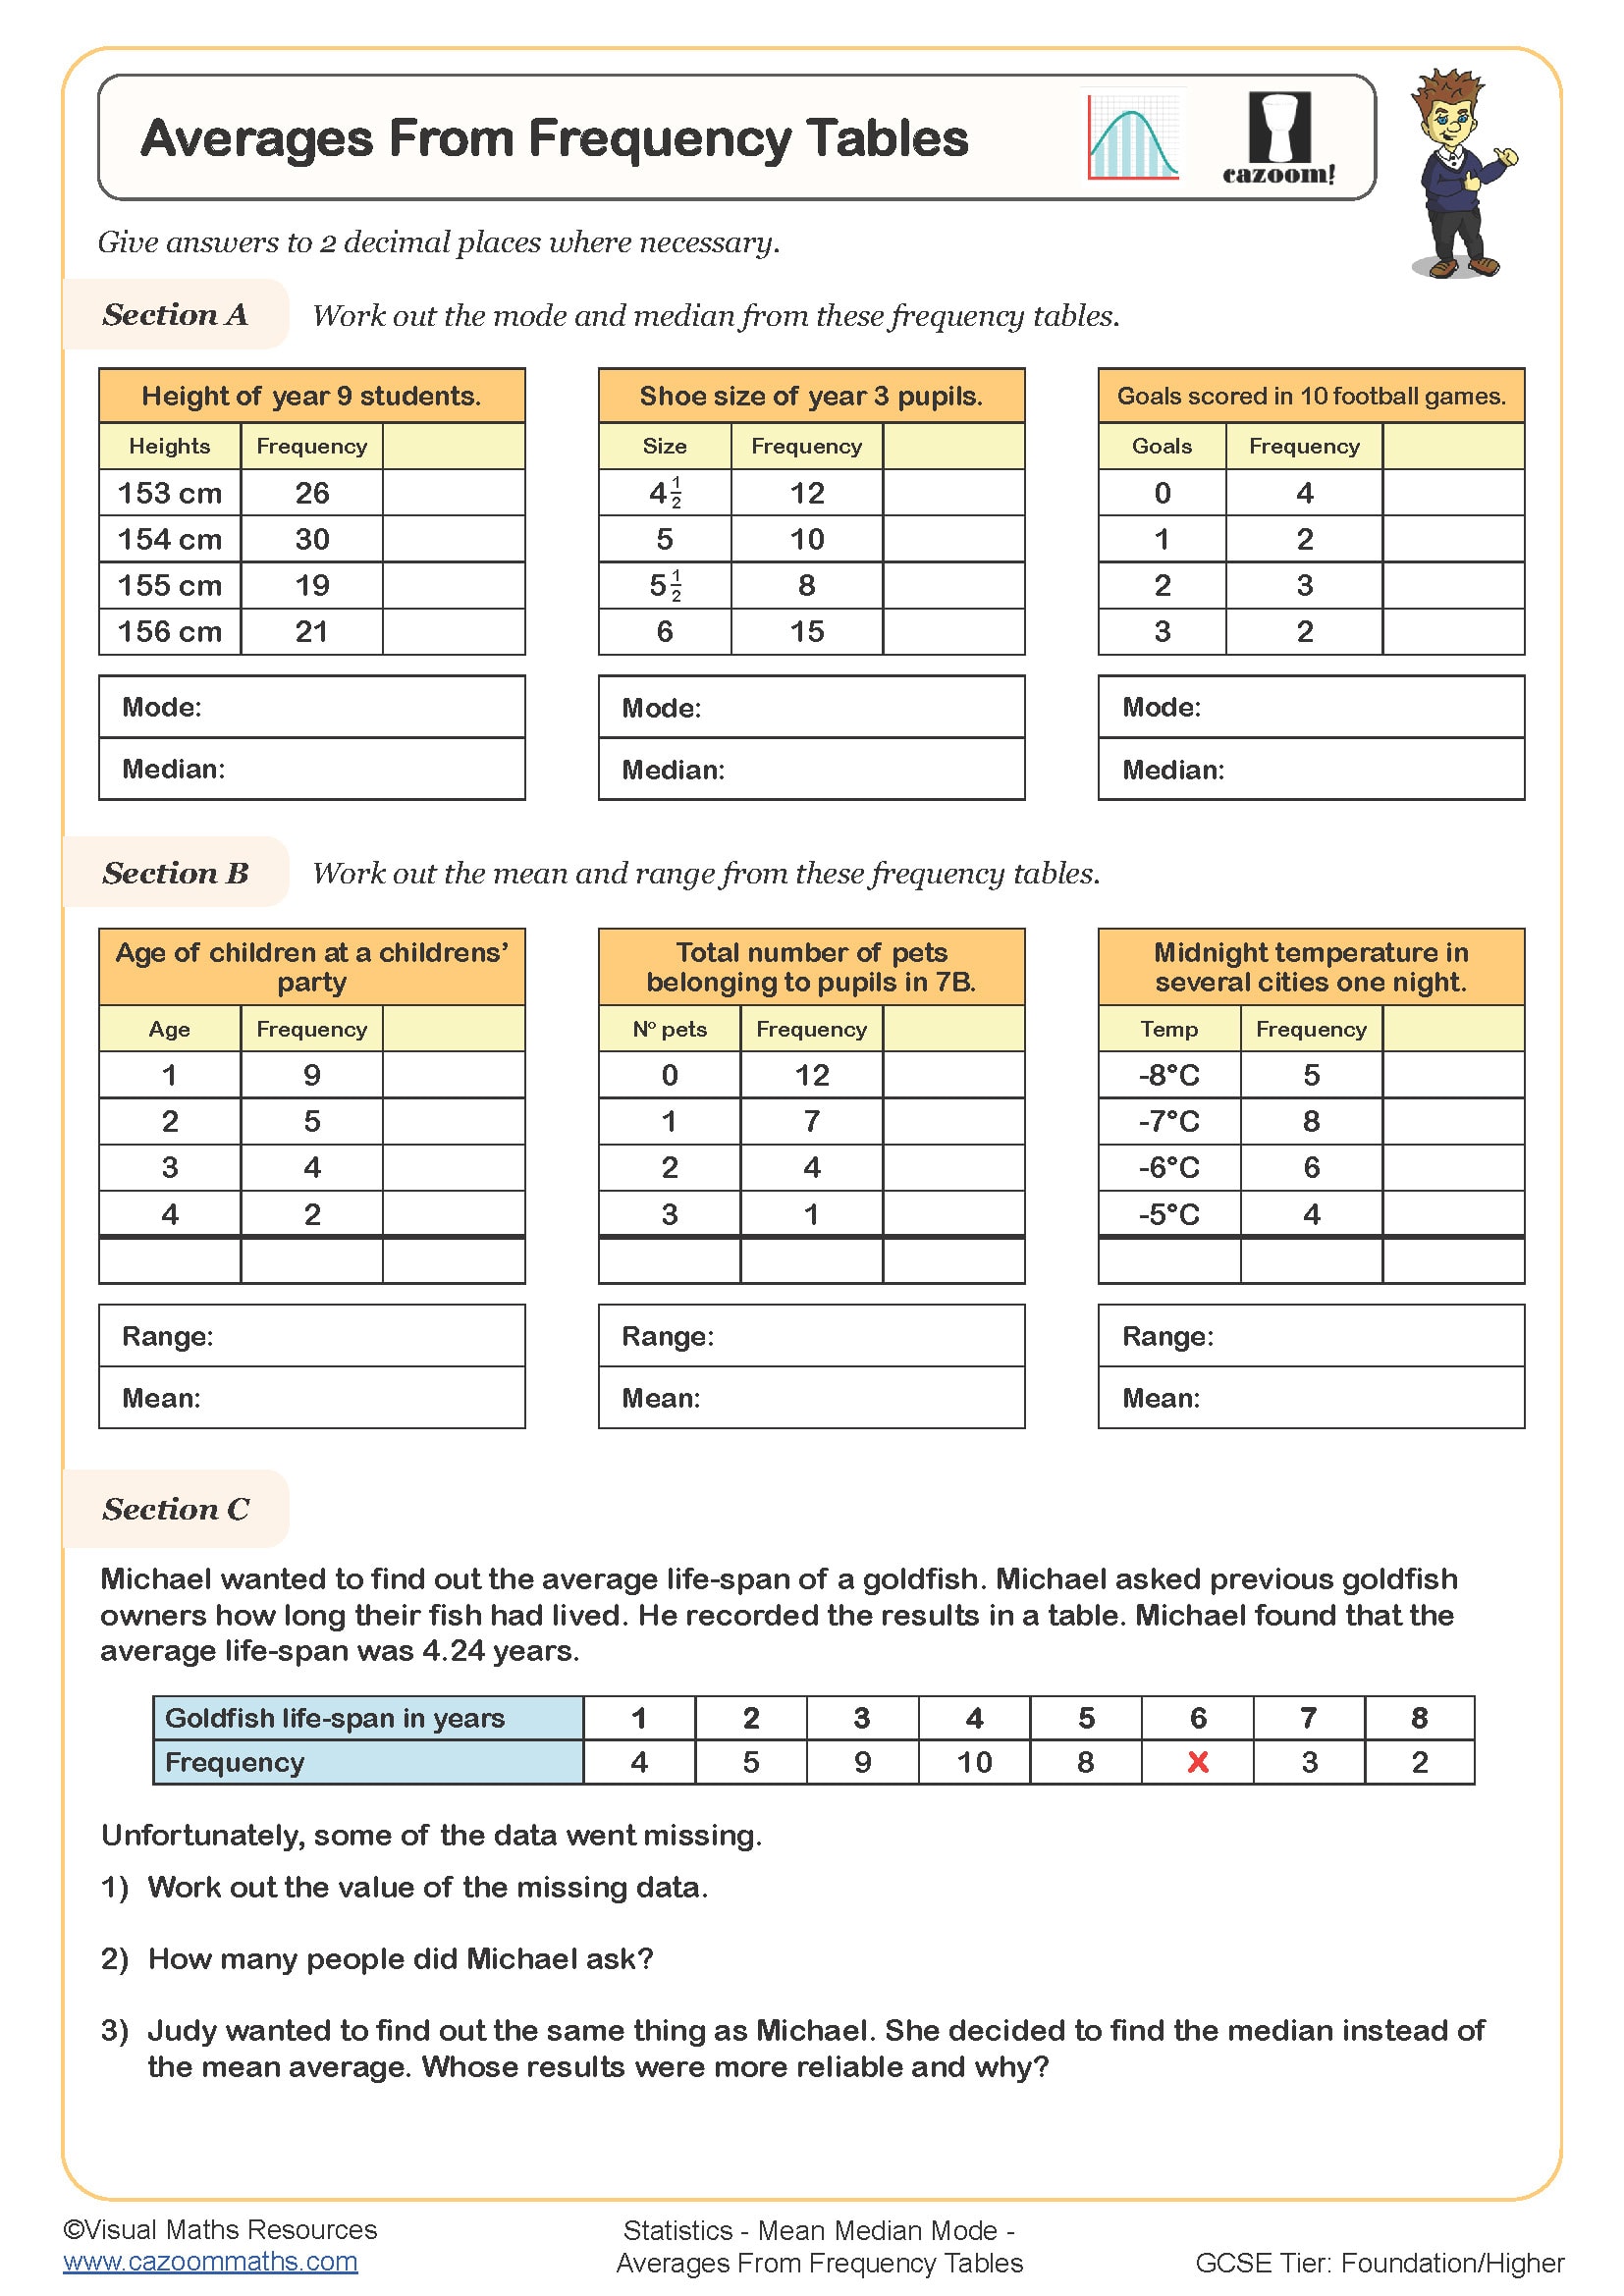
Averages from Frequency Tables
Year groups: 8, 9
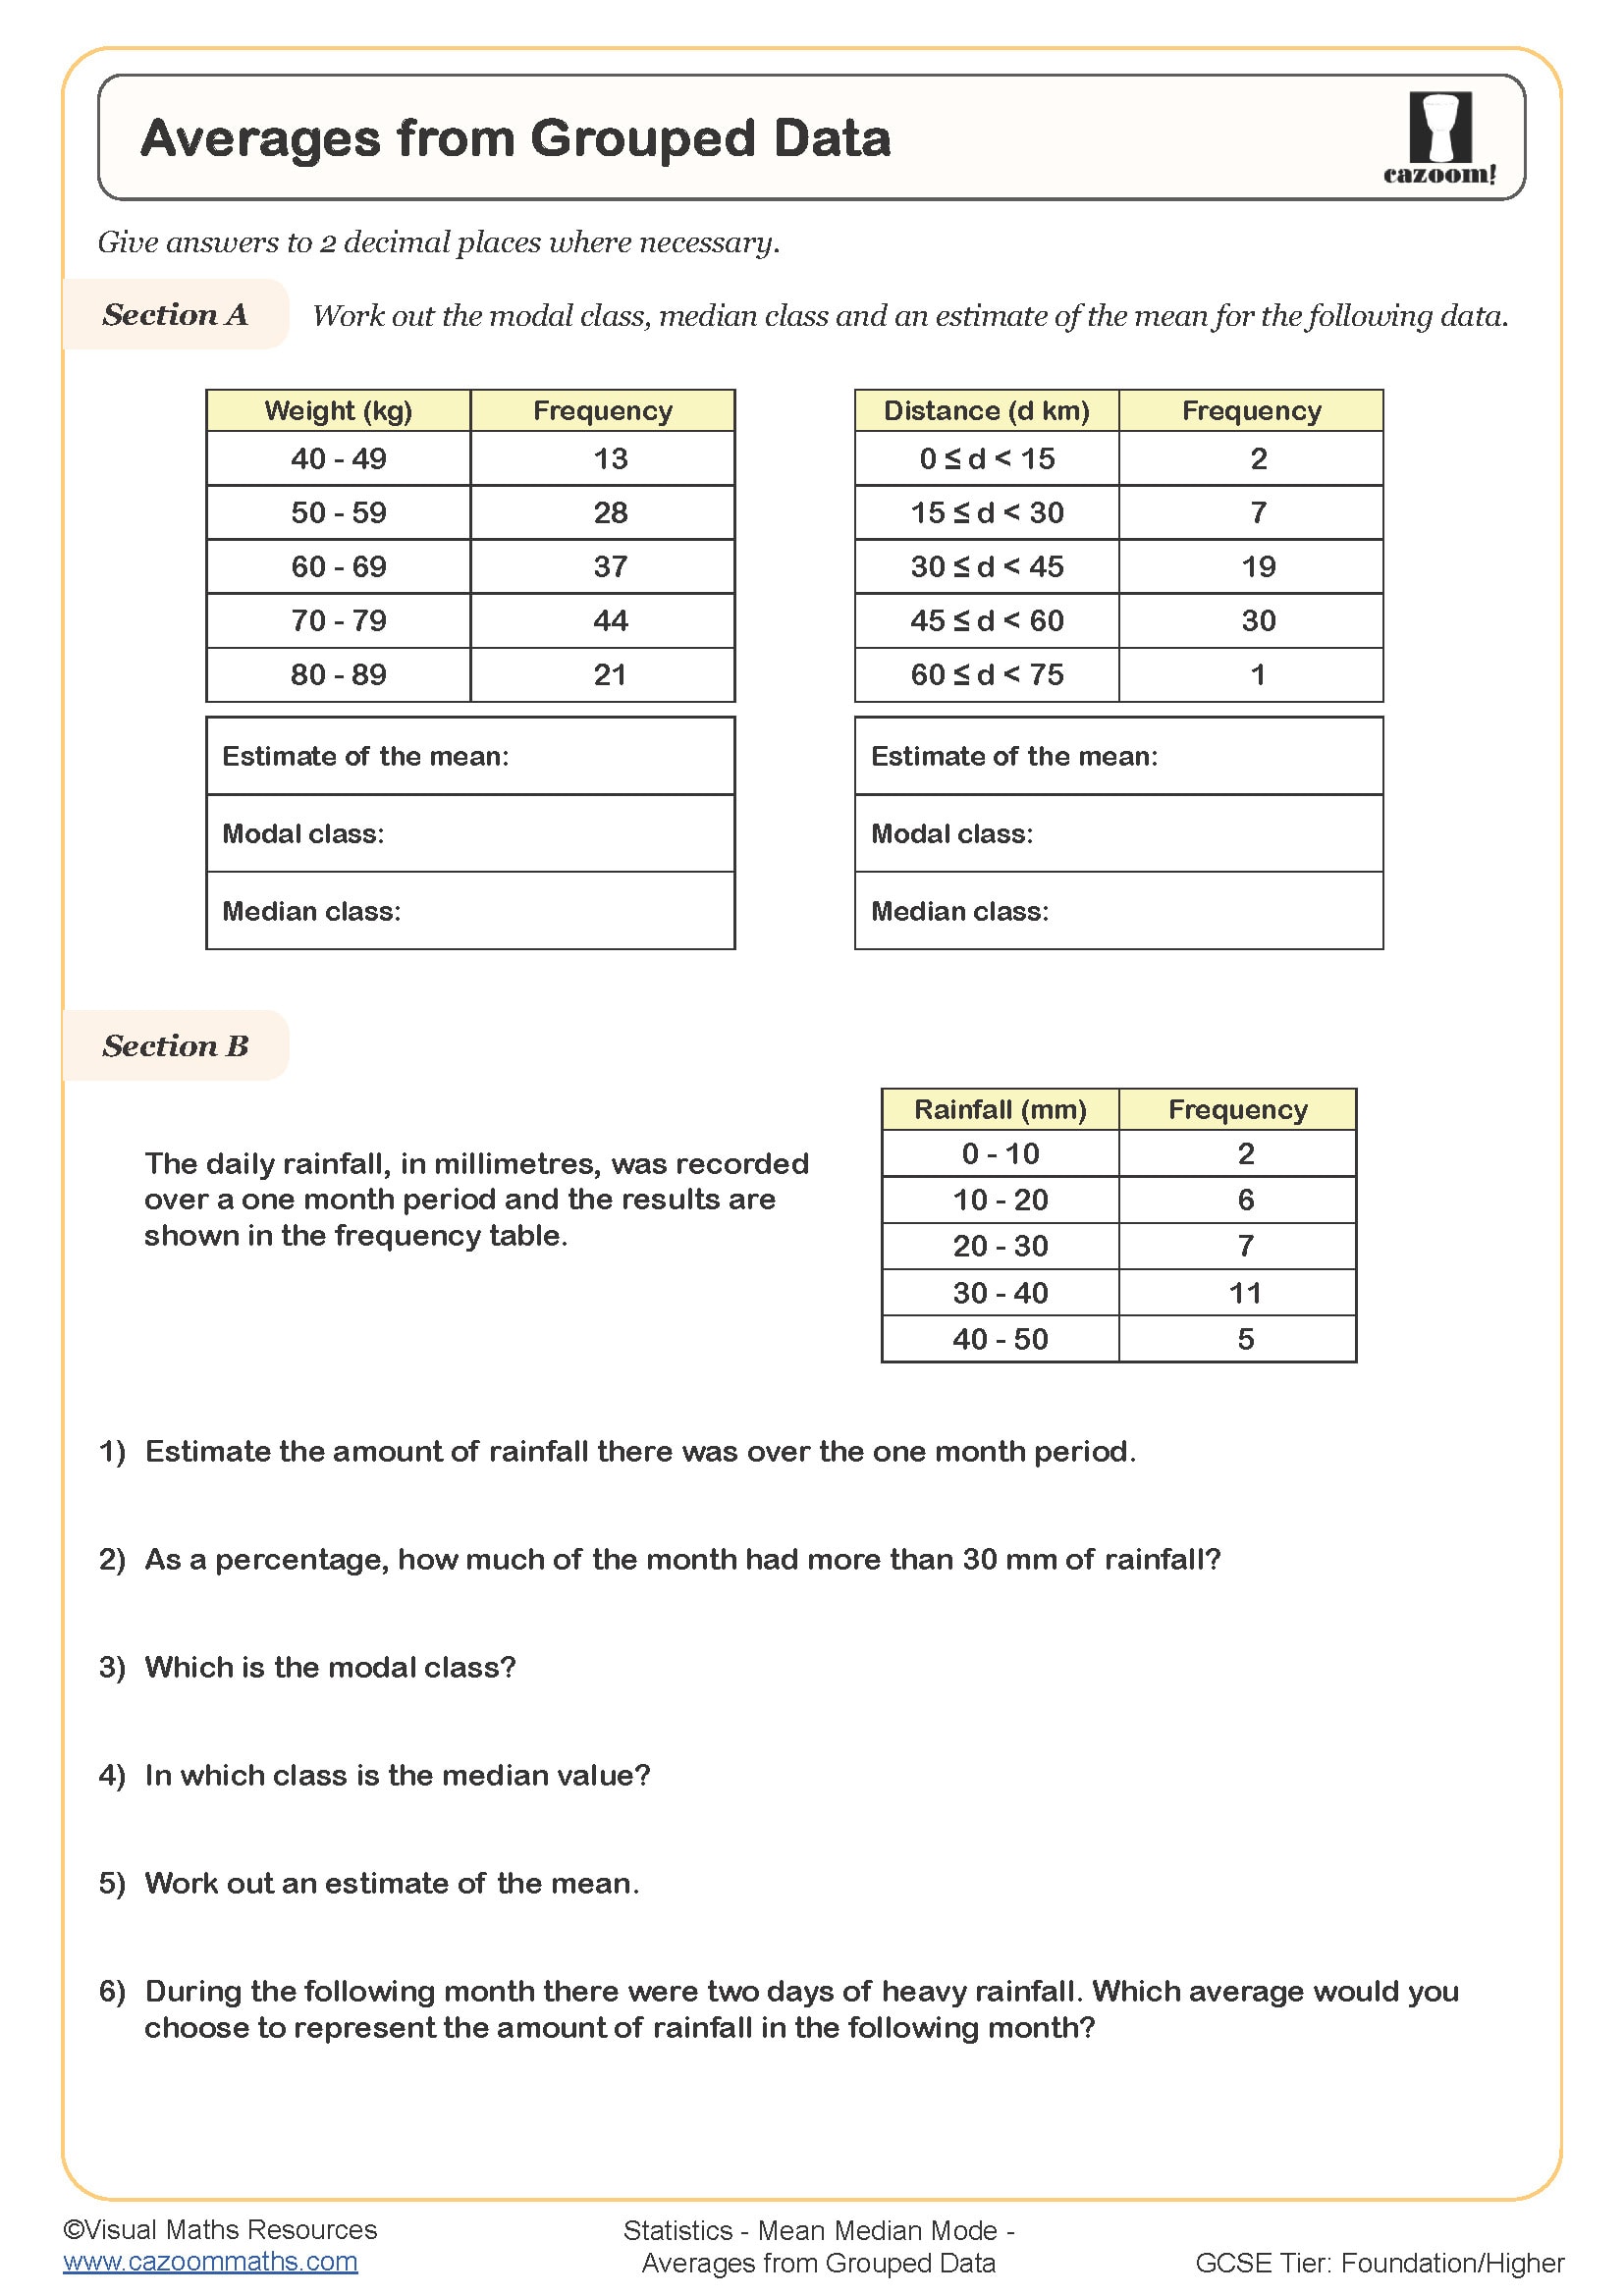
Averages from Grouped Data
Year groups: 8, 9
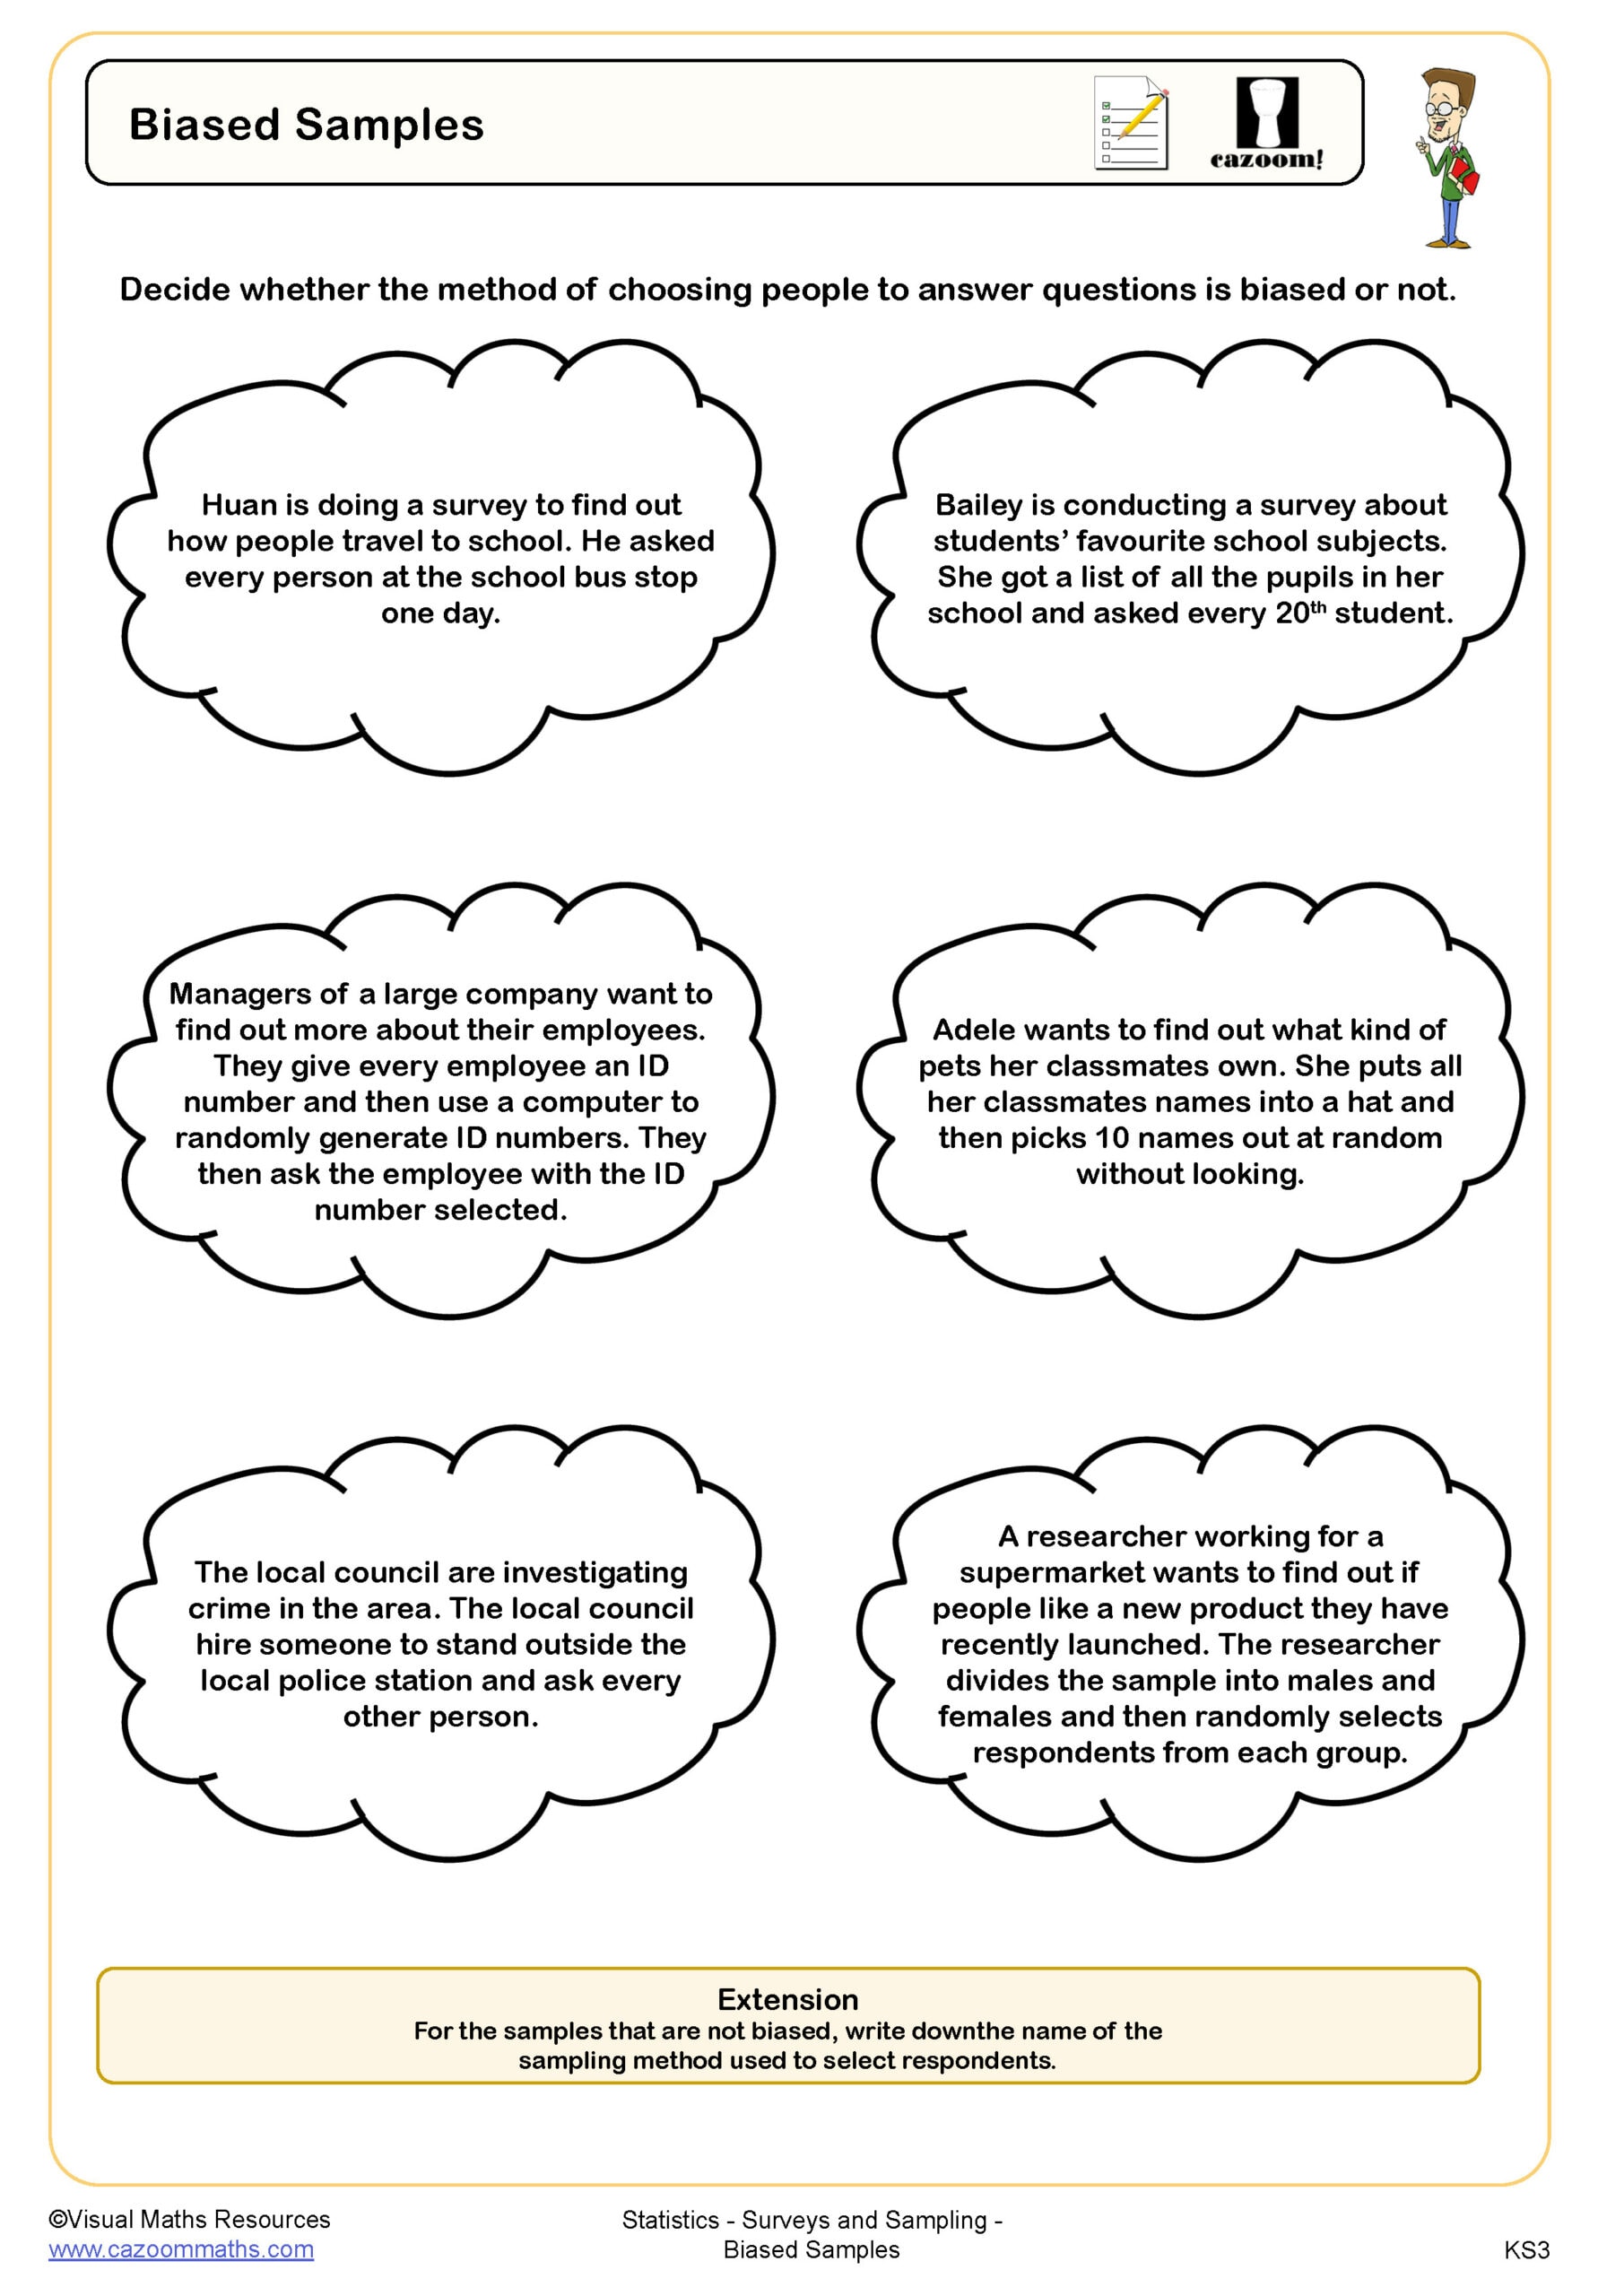
Biased Samples
Year groups: 8, 9
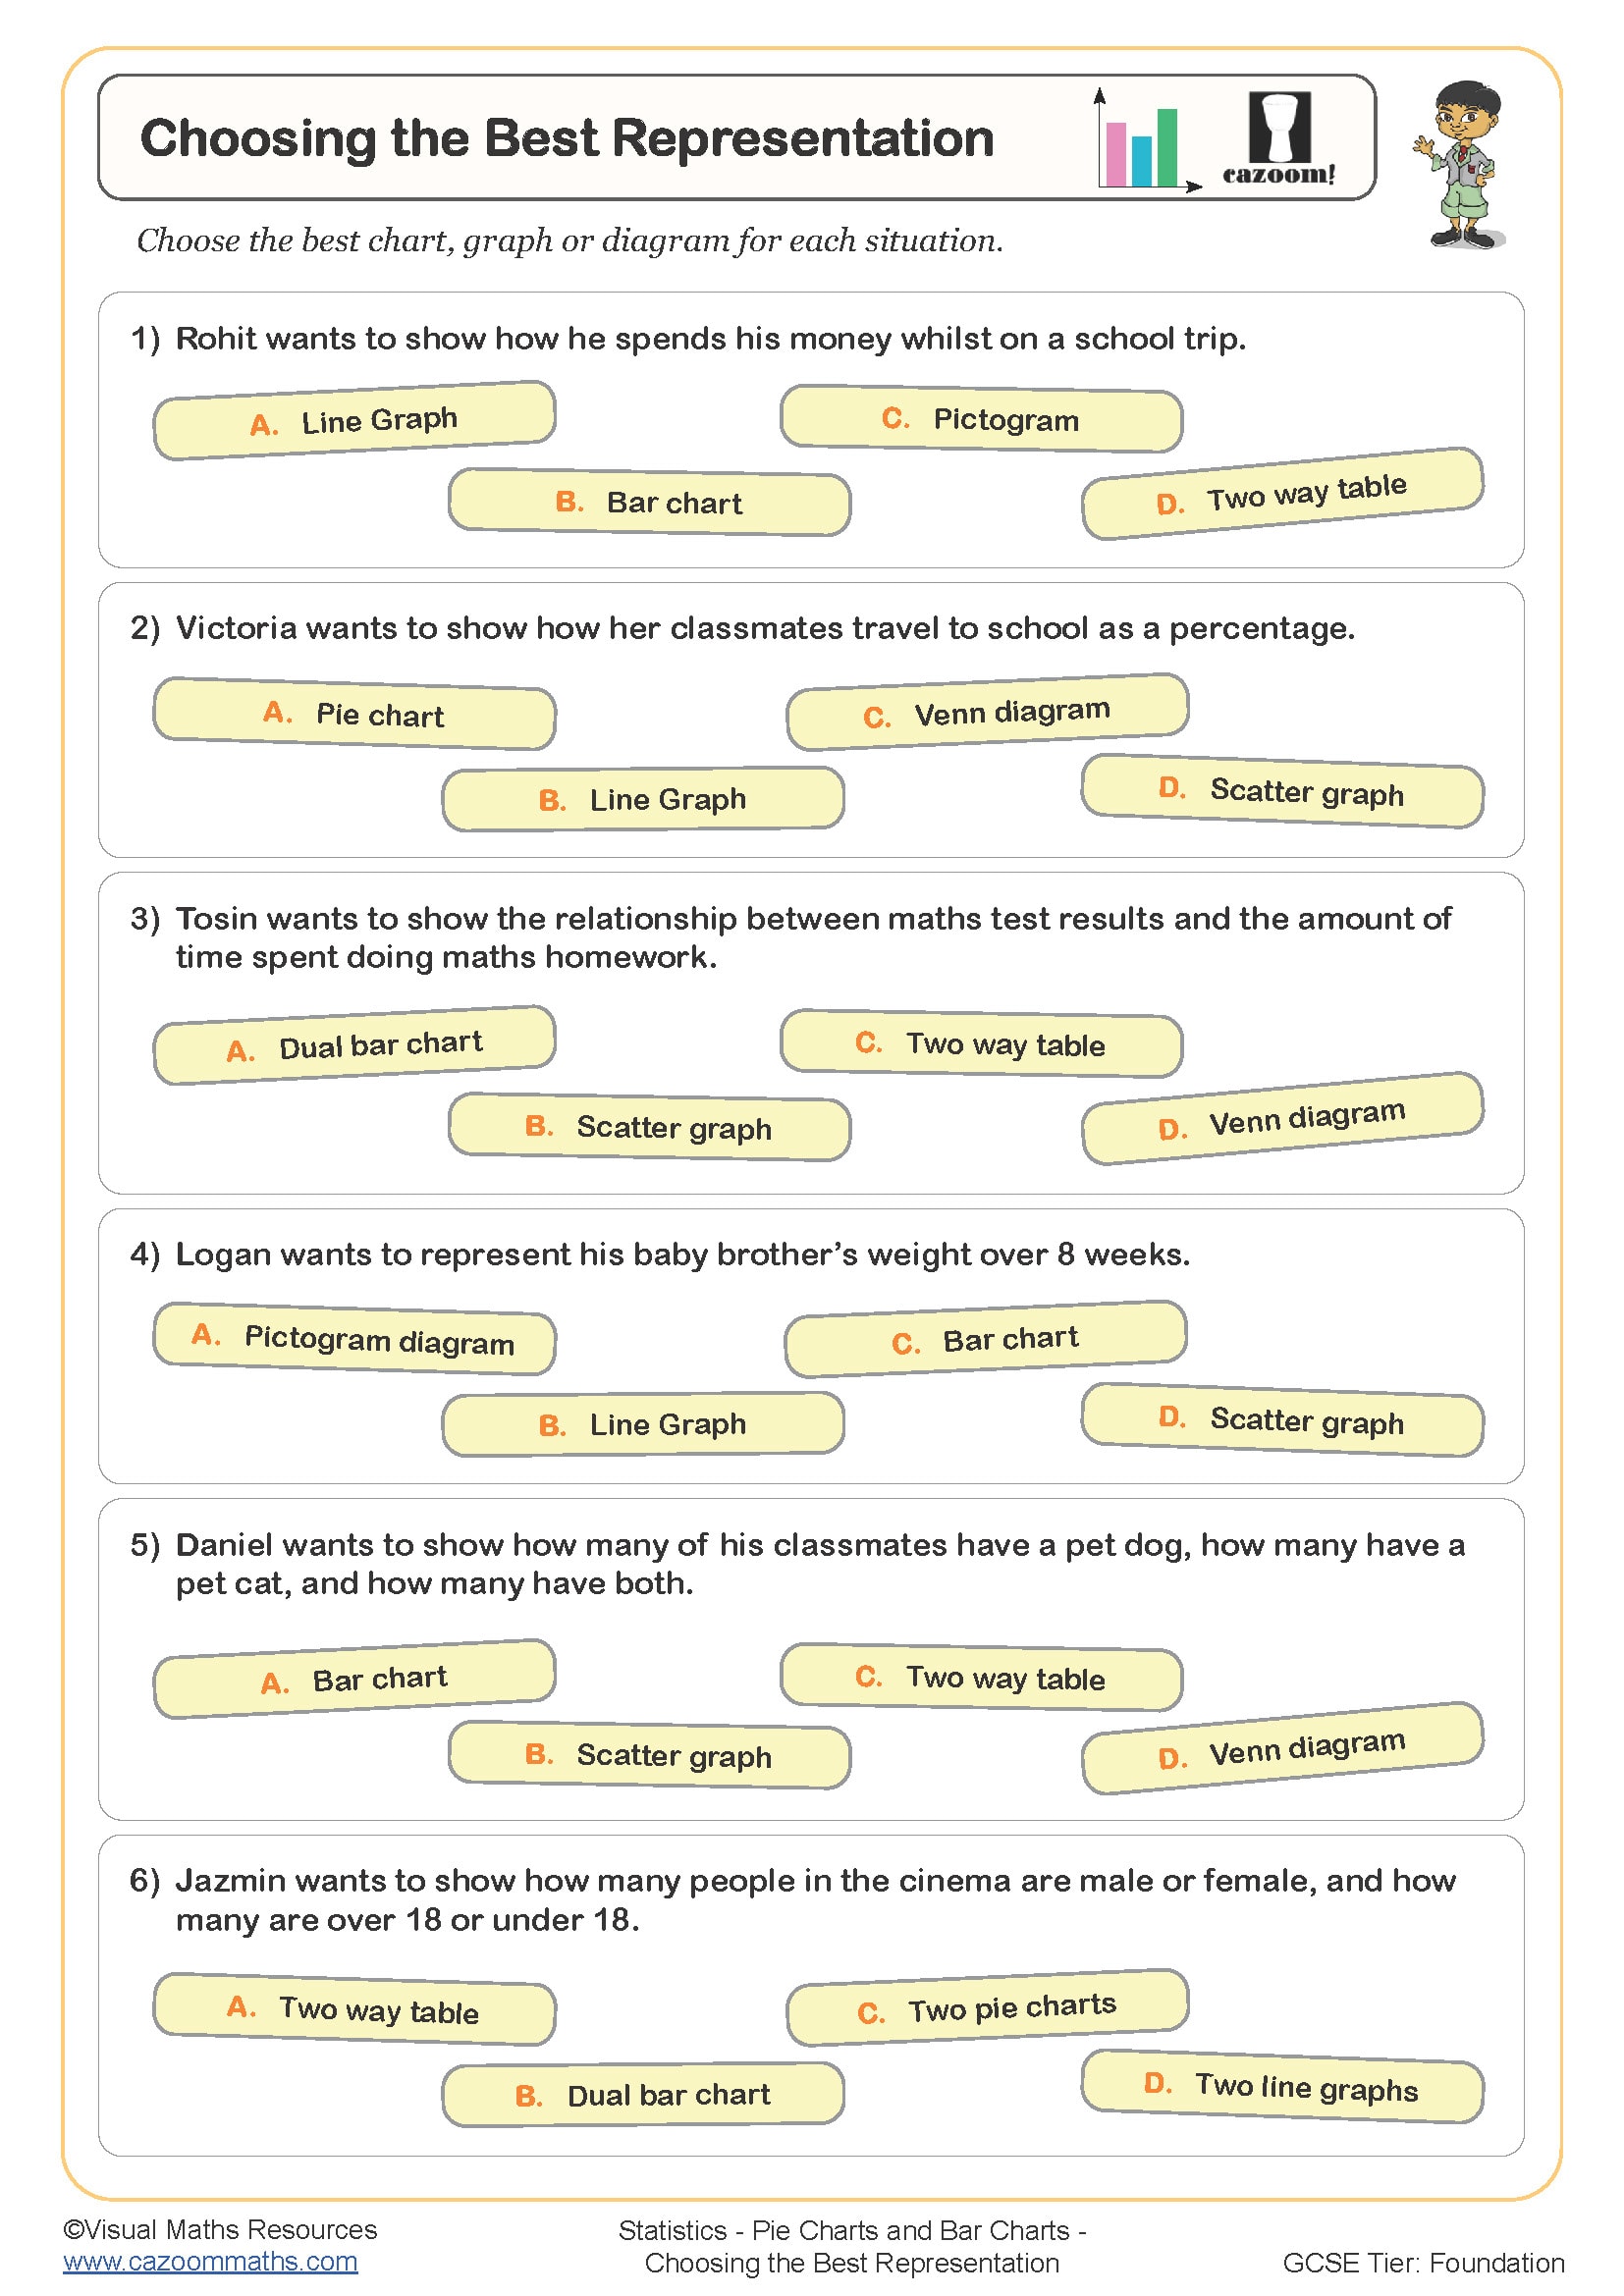
Choosing the Best Representation
Year groups: 8, 9
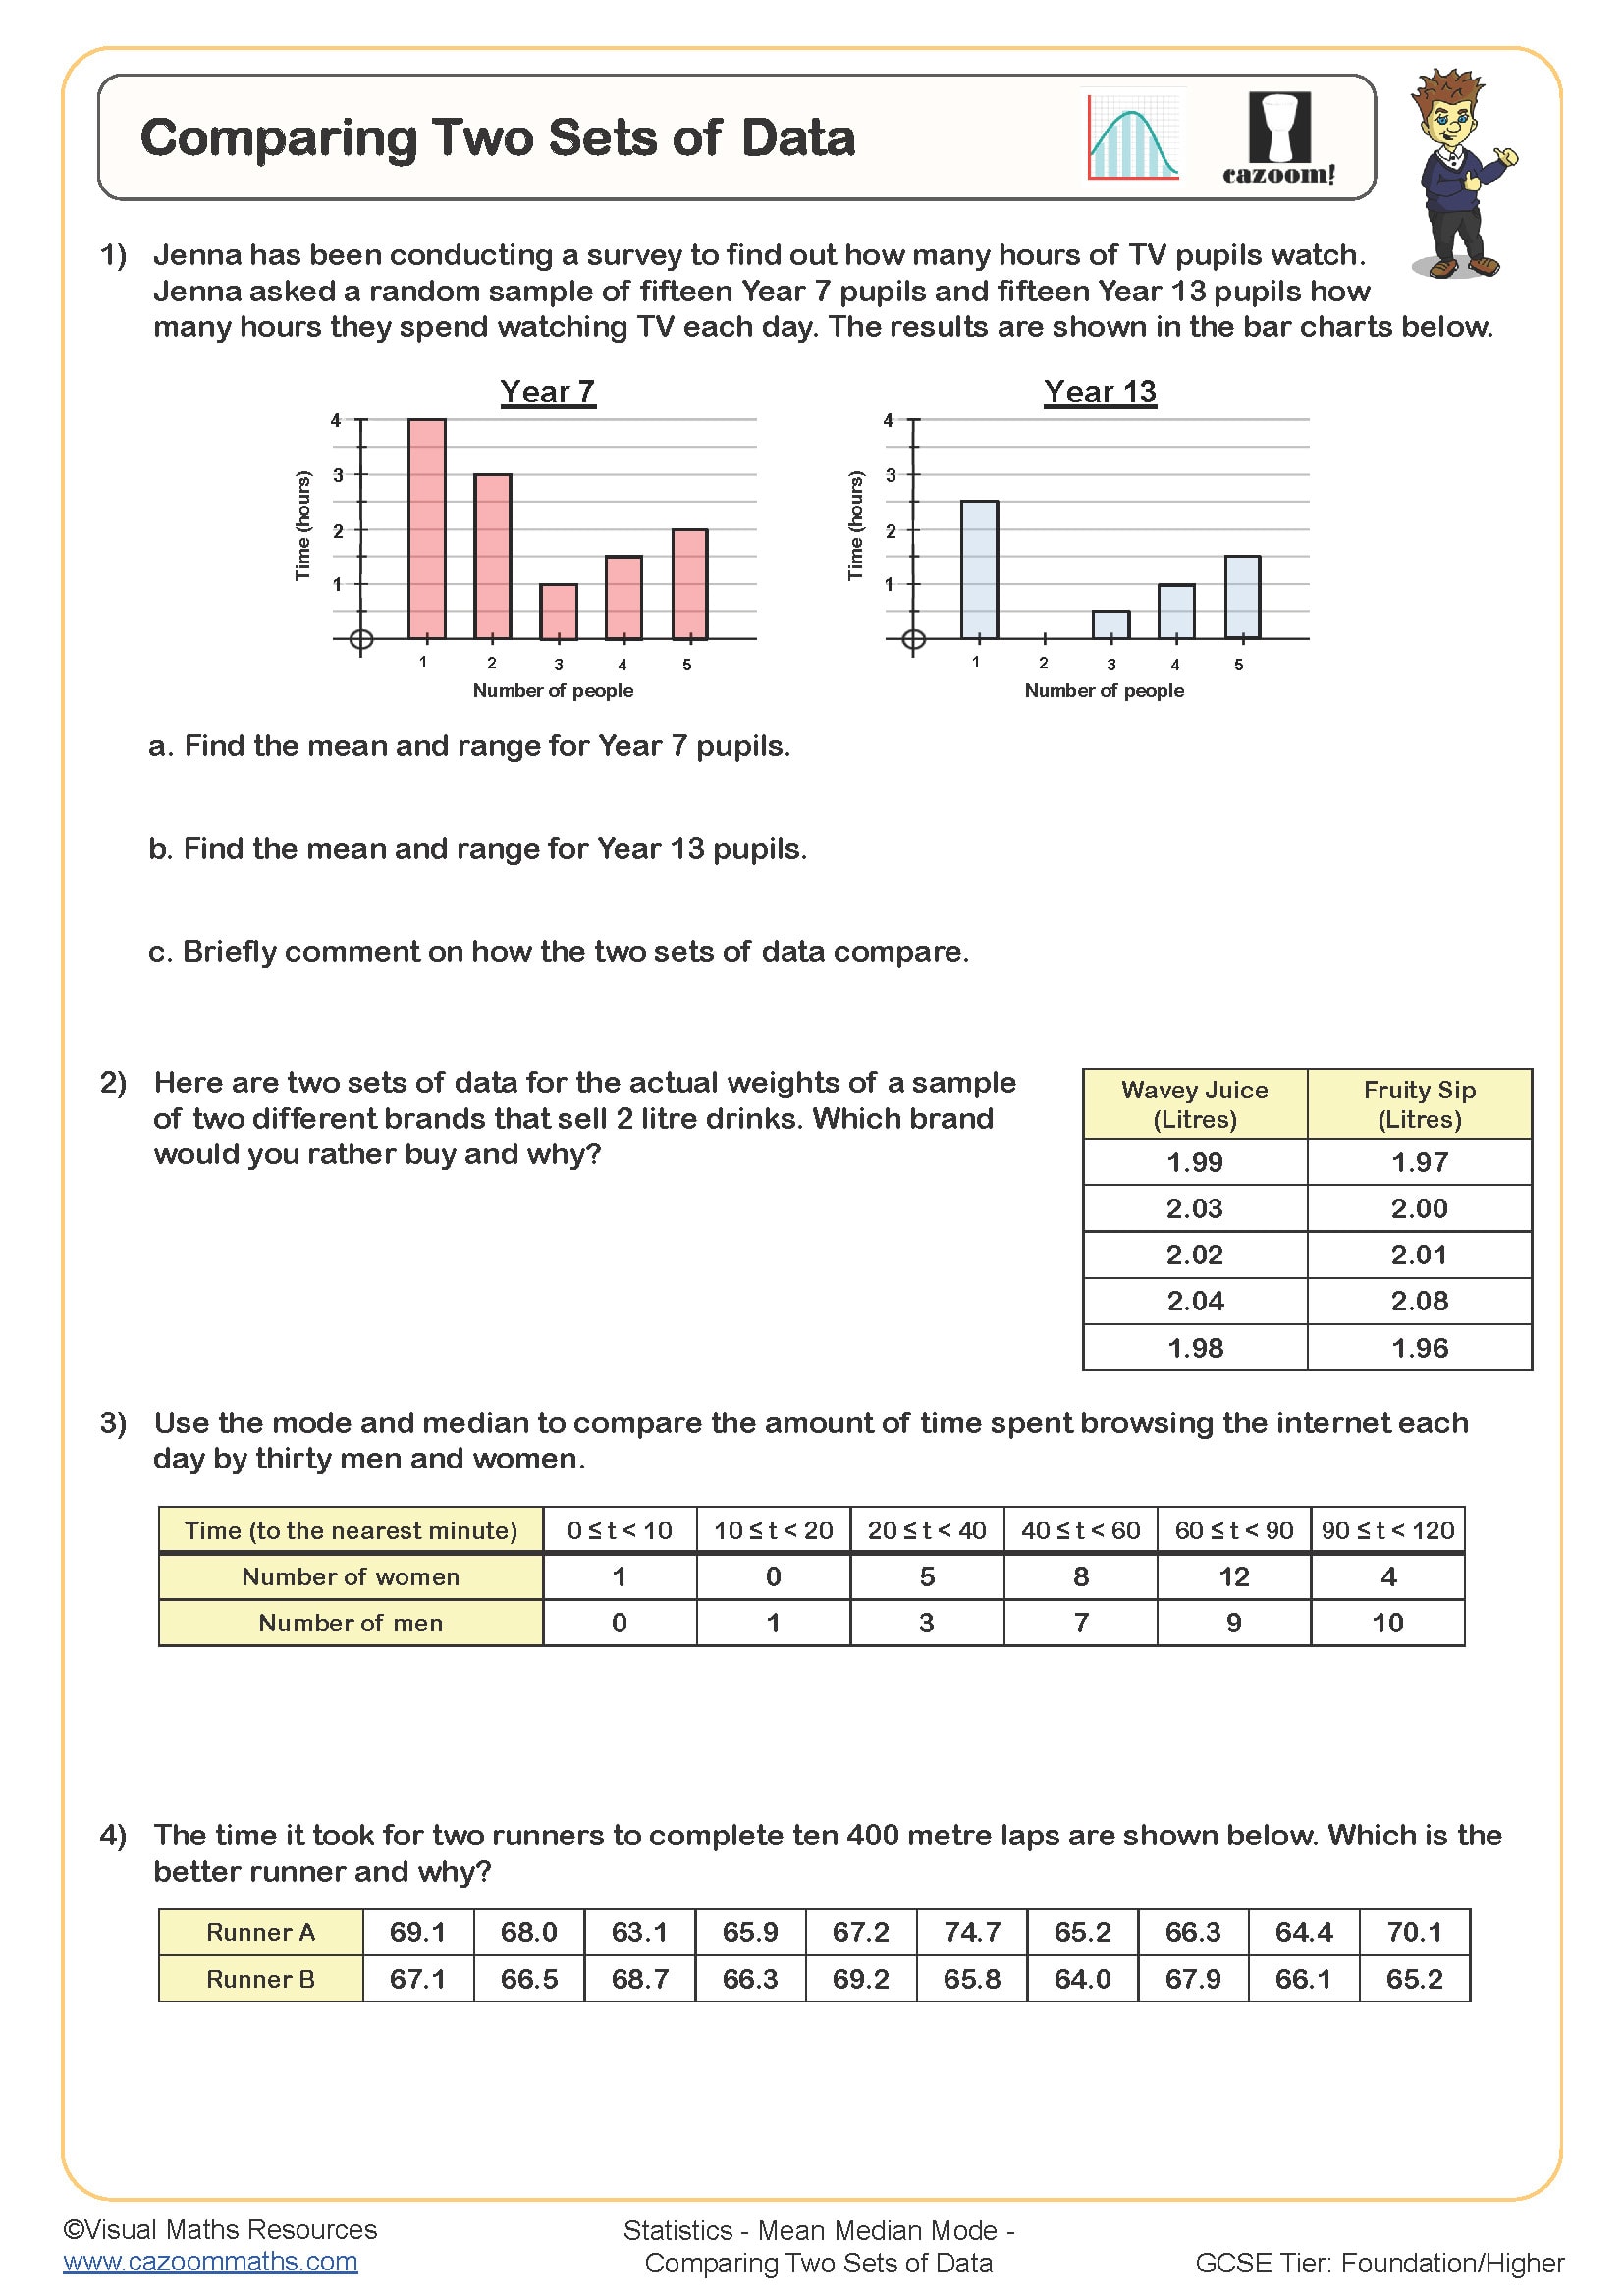
Comparing Two Sets of Data
Year groups: 8, 9
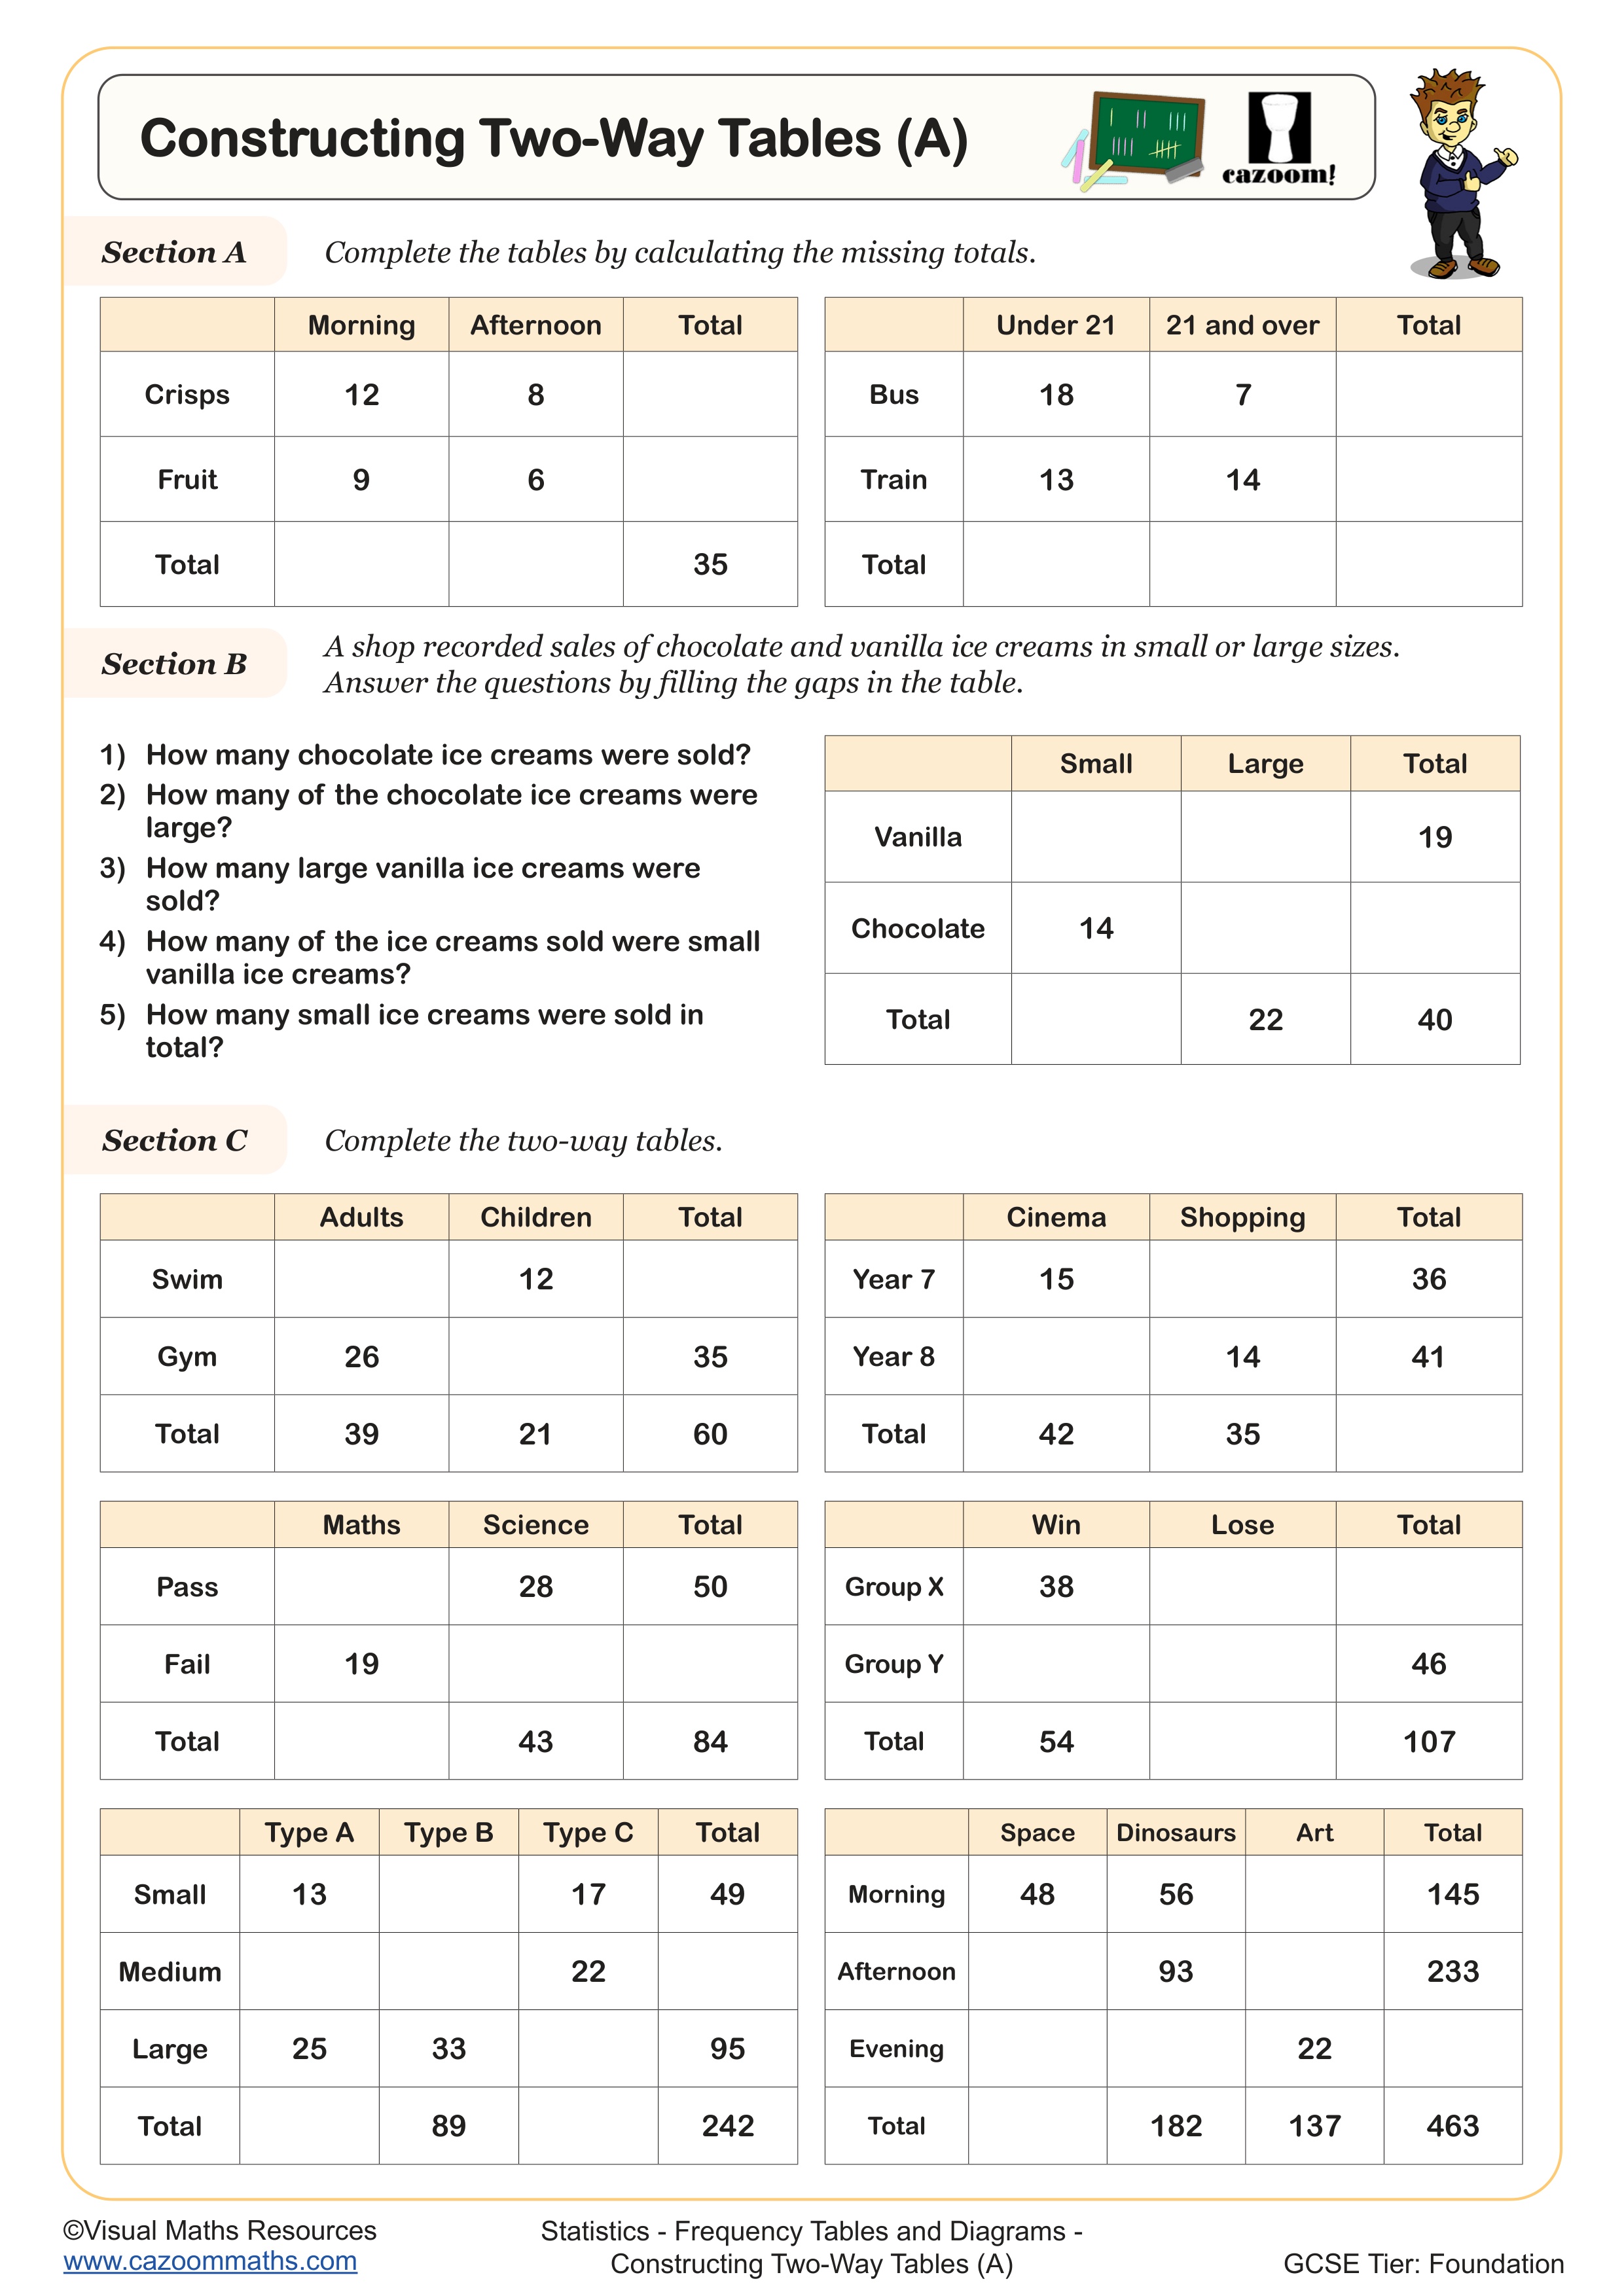
Constructing Two-Way Tables (A)
Year groups: 8, 9
Constructing Two-Way Tables (B)
Year groups: 8, 9
-Questions-Worksheet.jpg?w=3840)
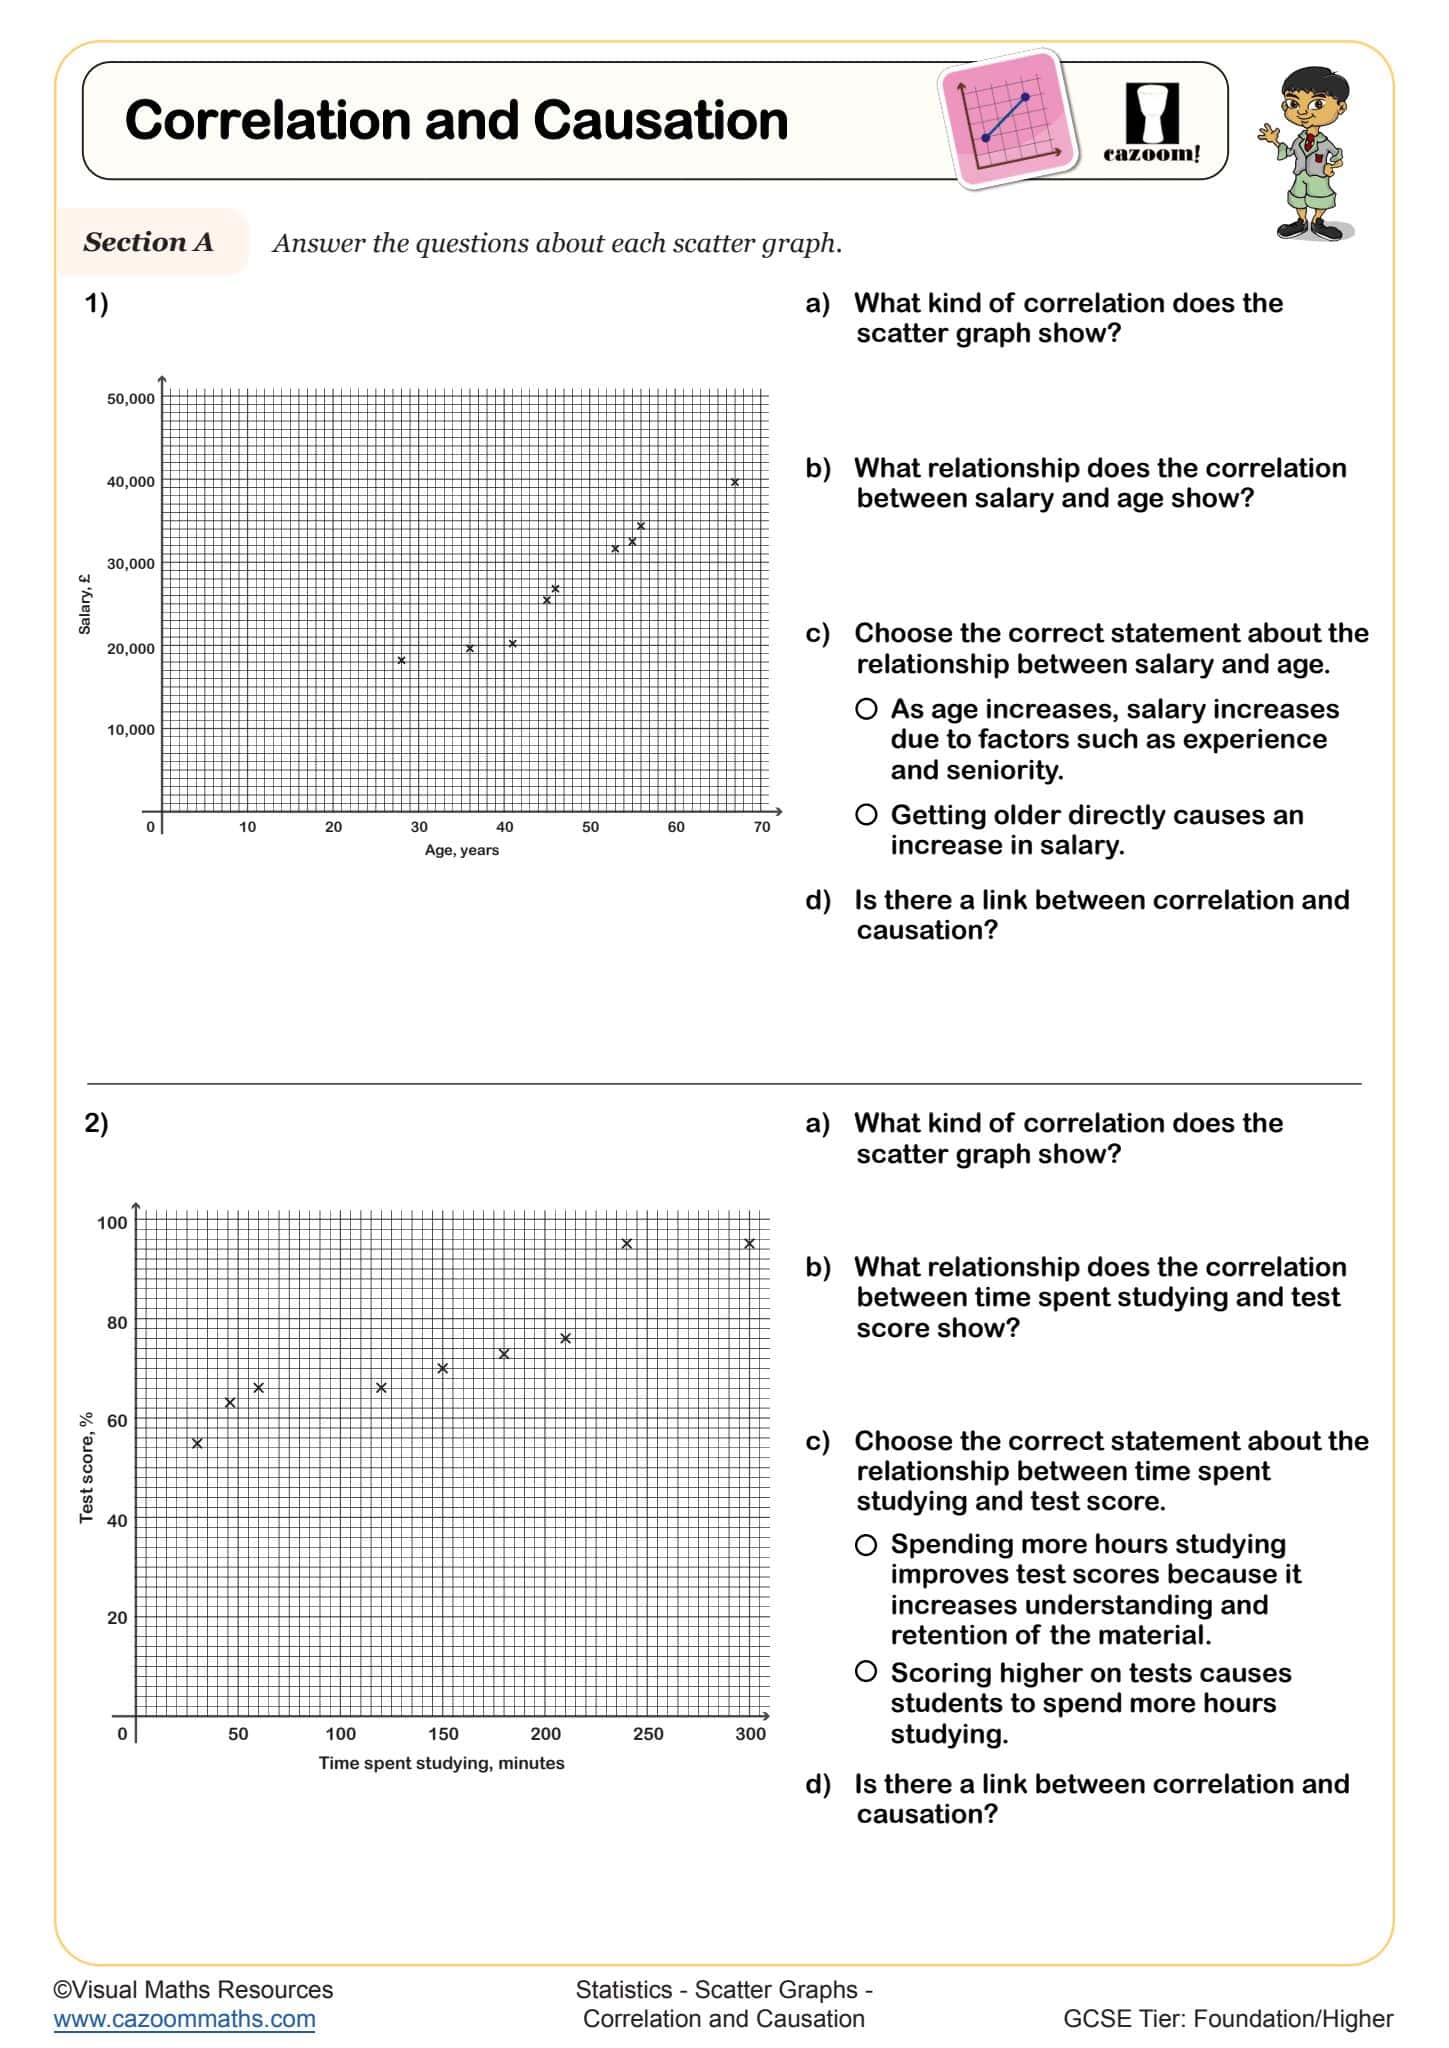
Correlation and Causation
Year groups: 8, 9
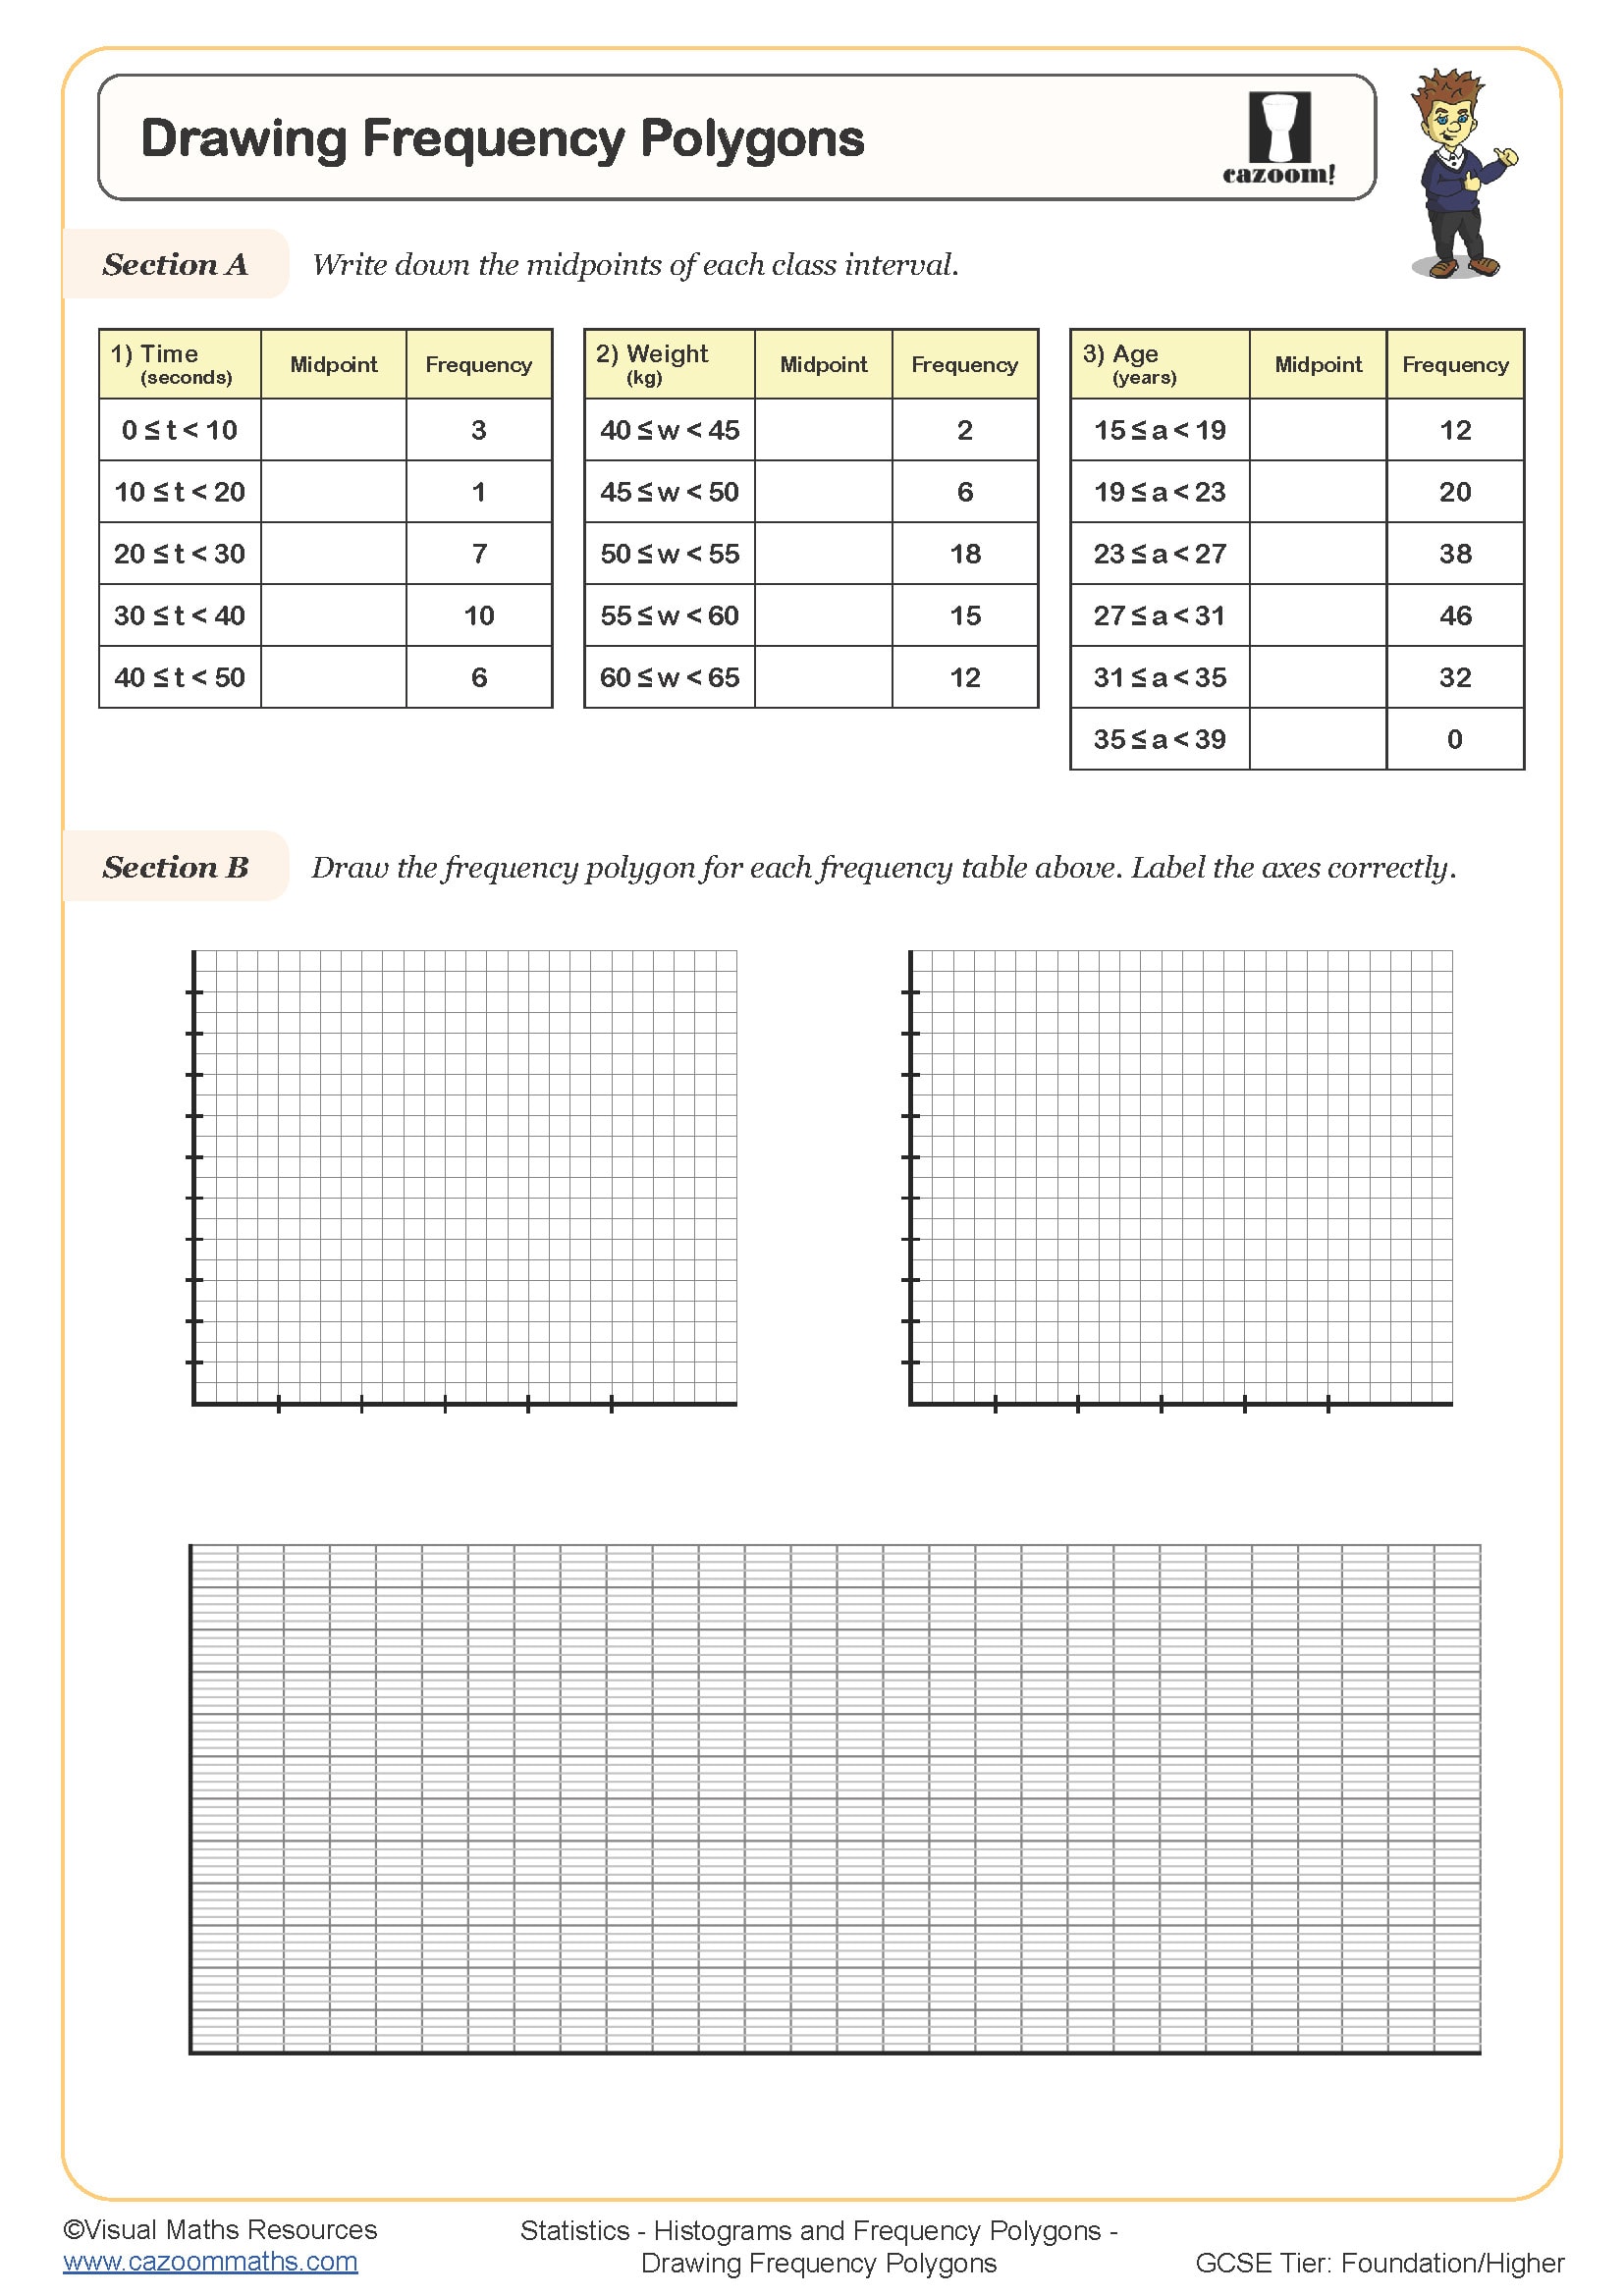
Drawing Frequency Polygons
Year groups: 8, 9
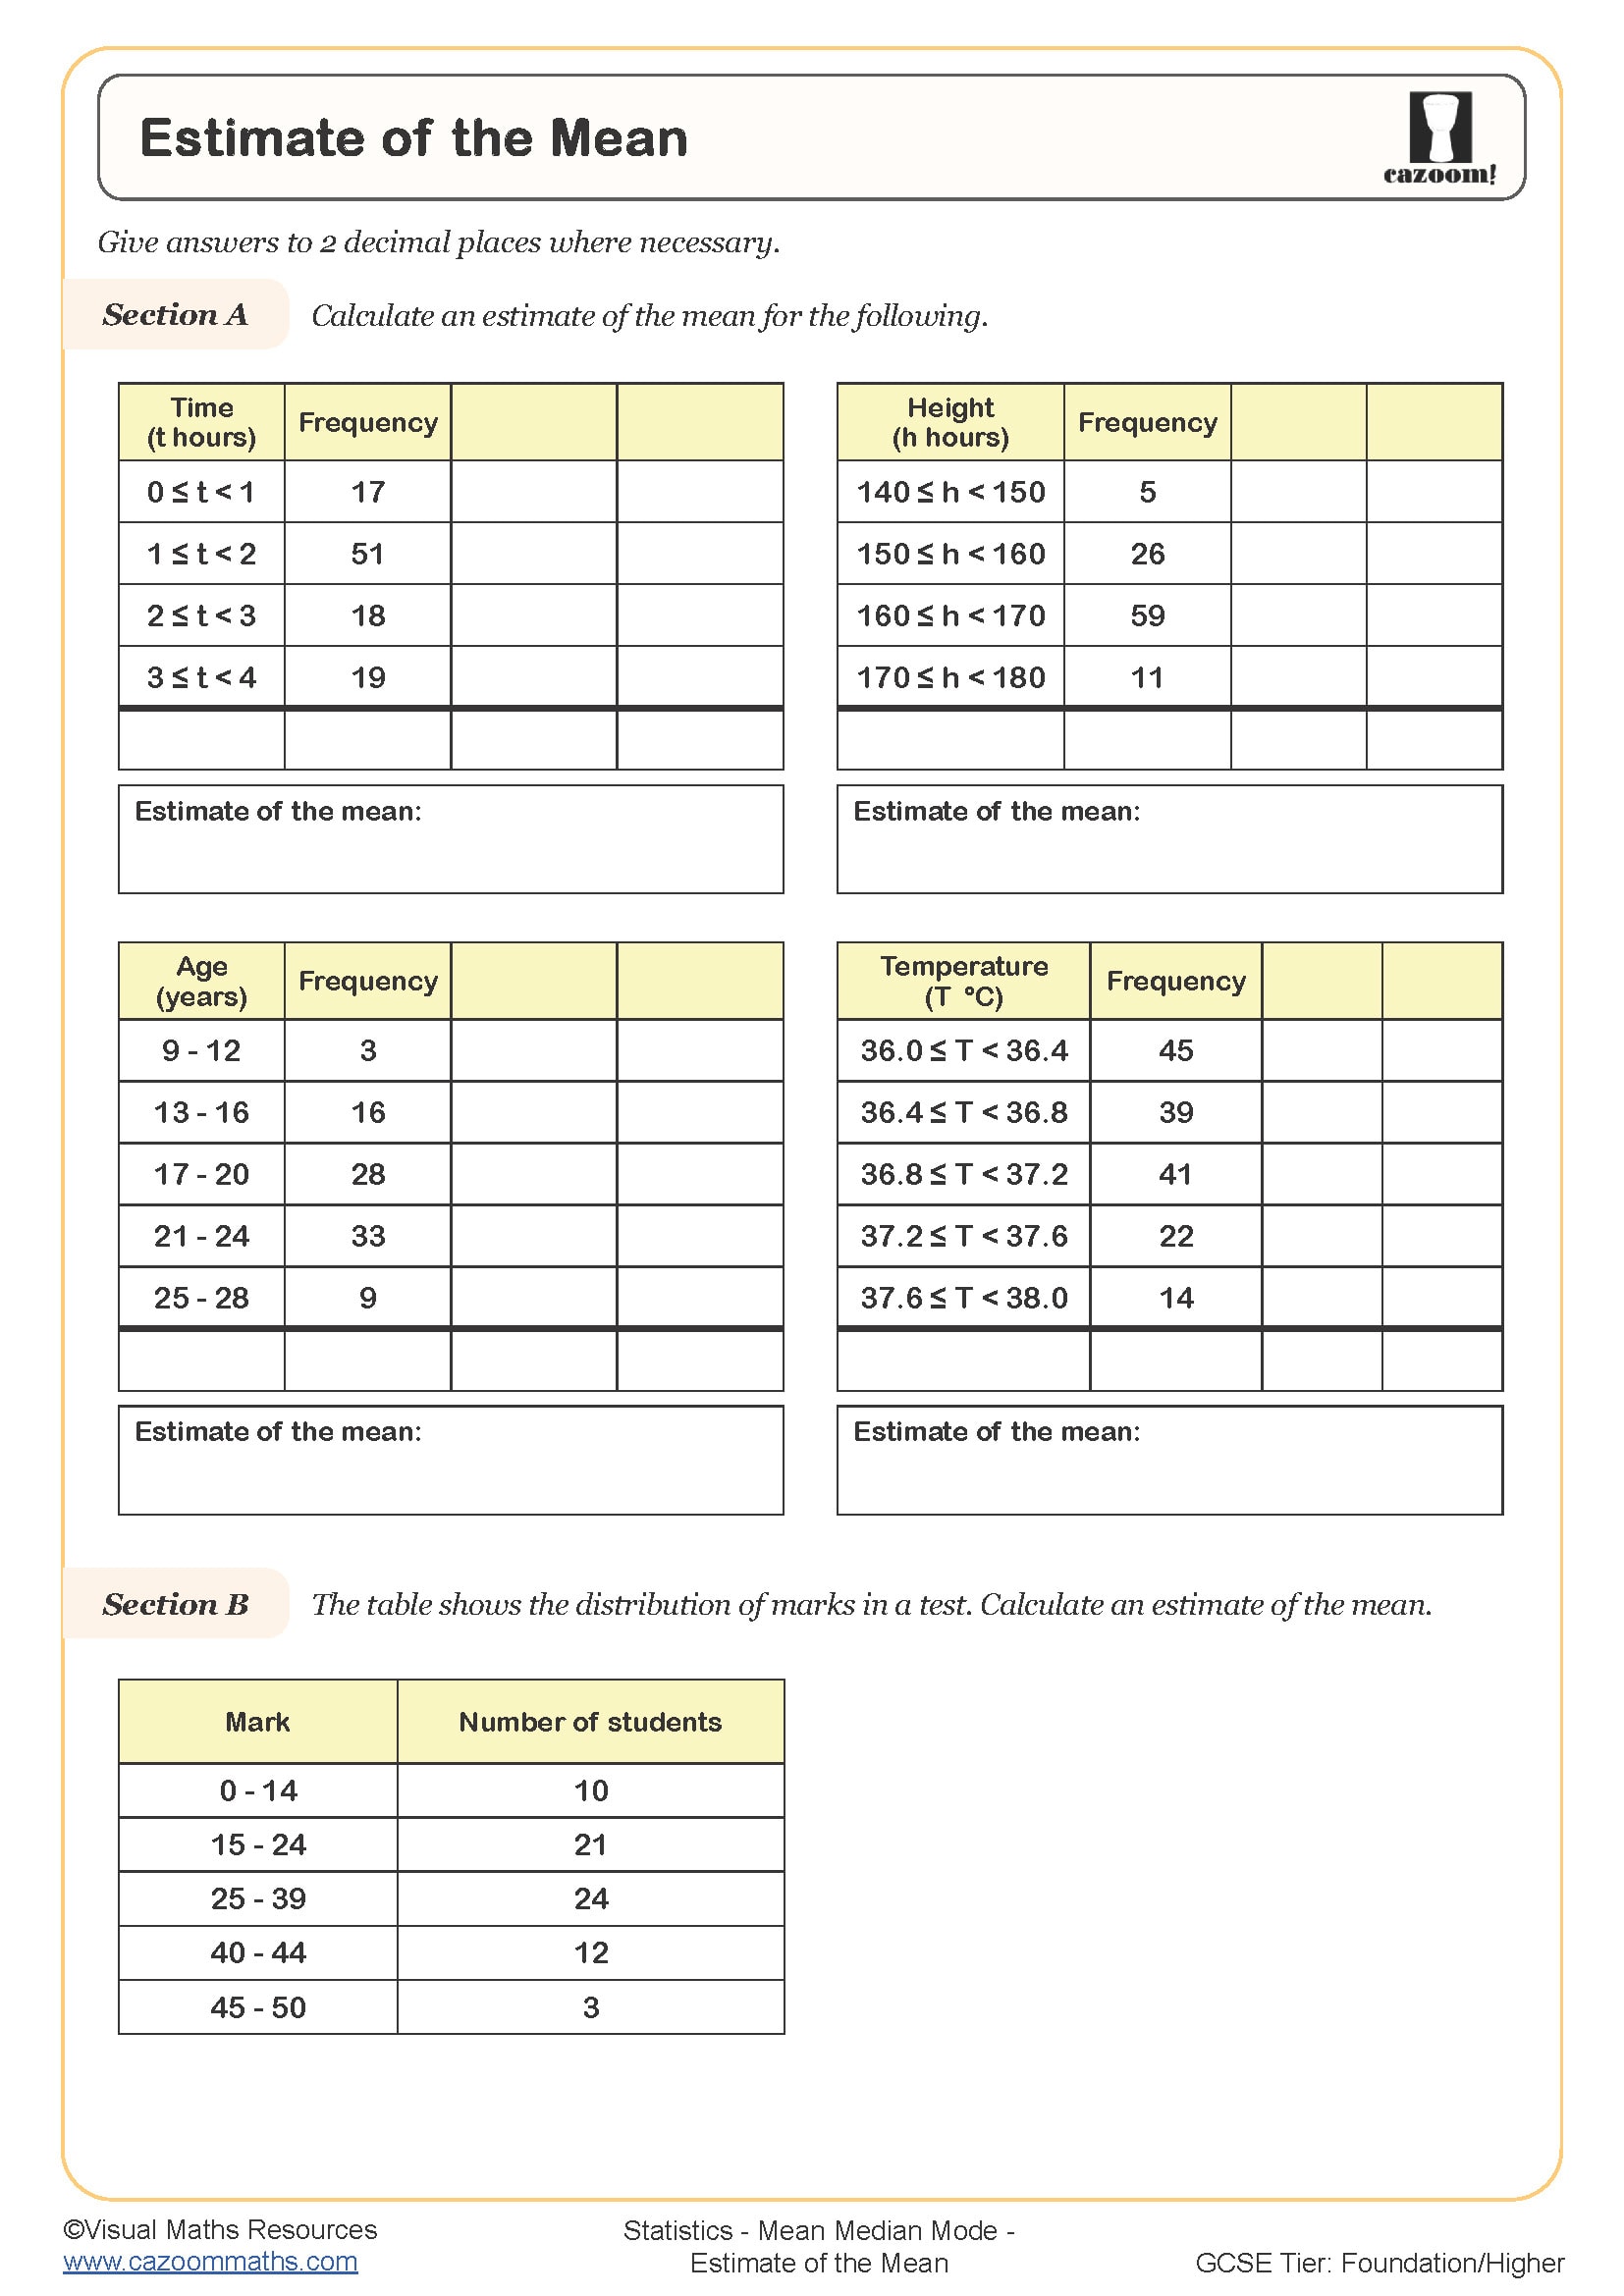
Estimate of the Mean
Year groups: 8, 9
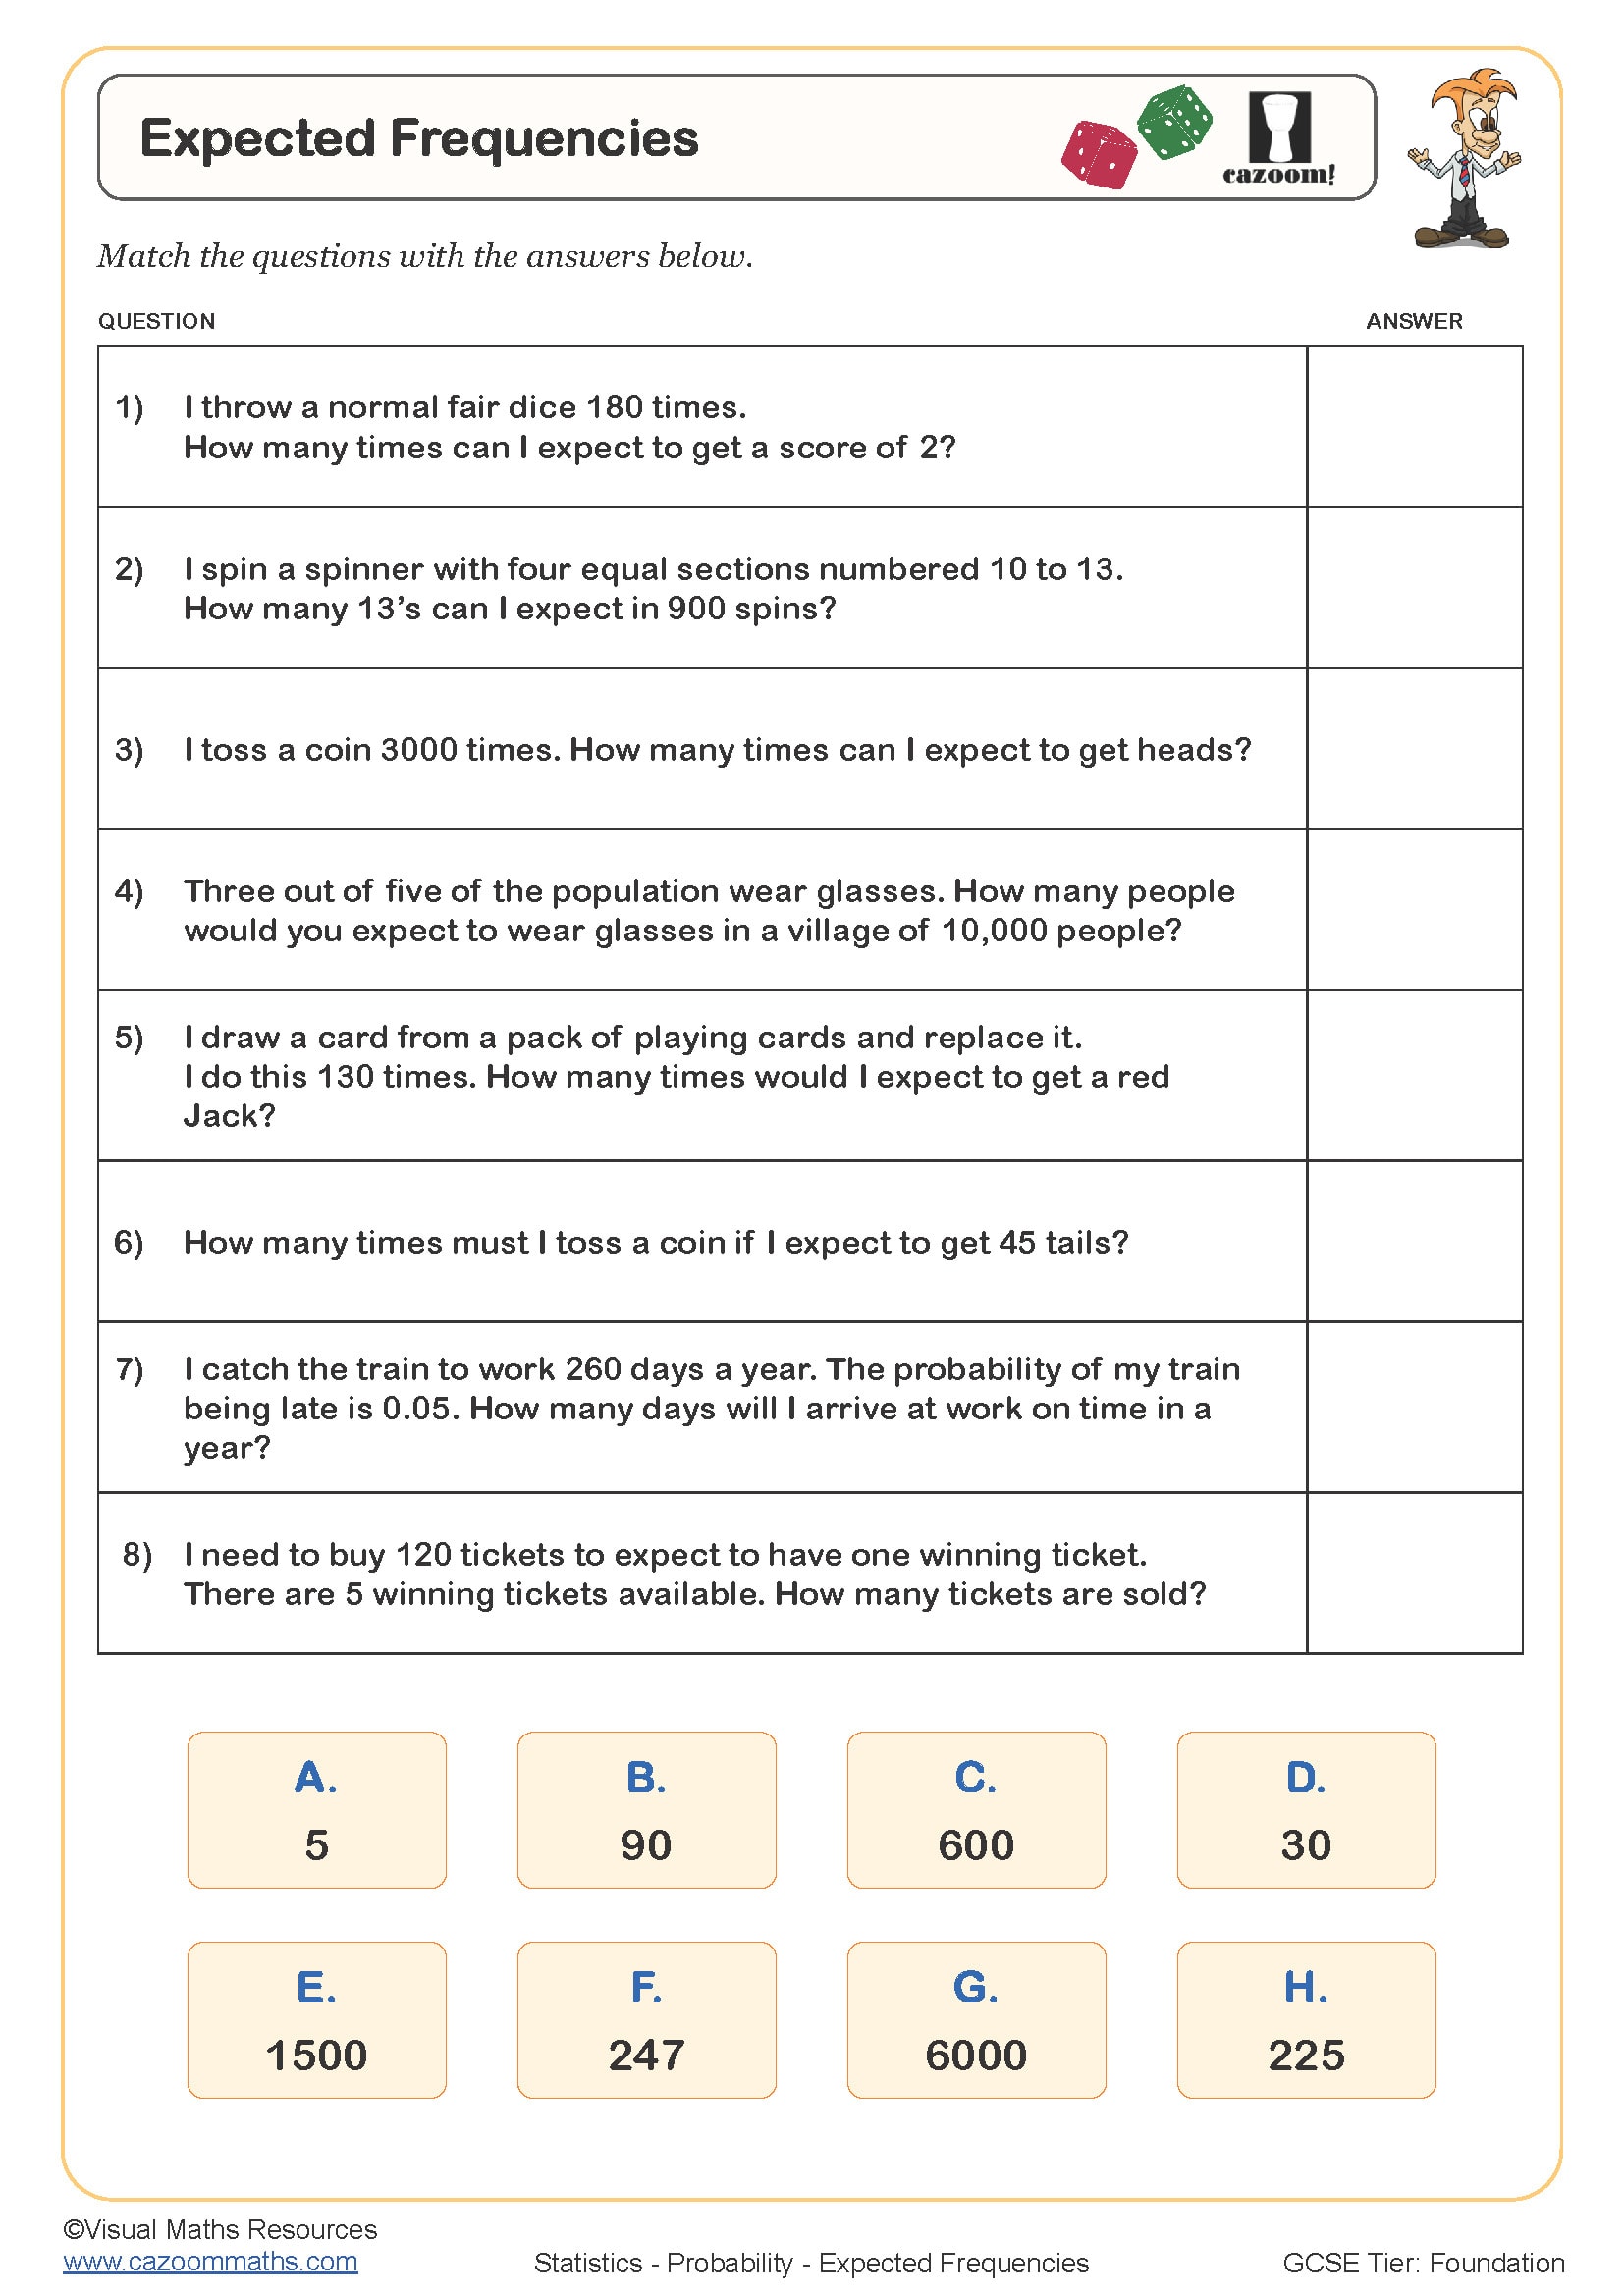
Expected Frequencies
Year groups: 8, 9, 10
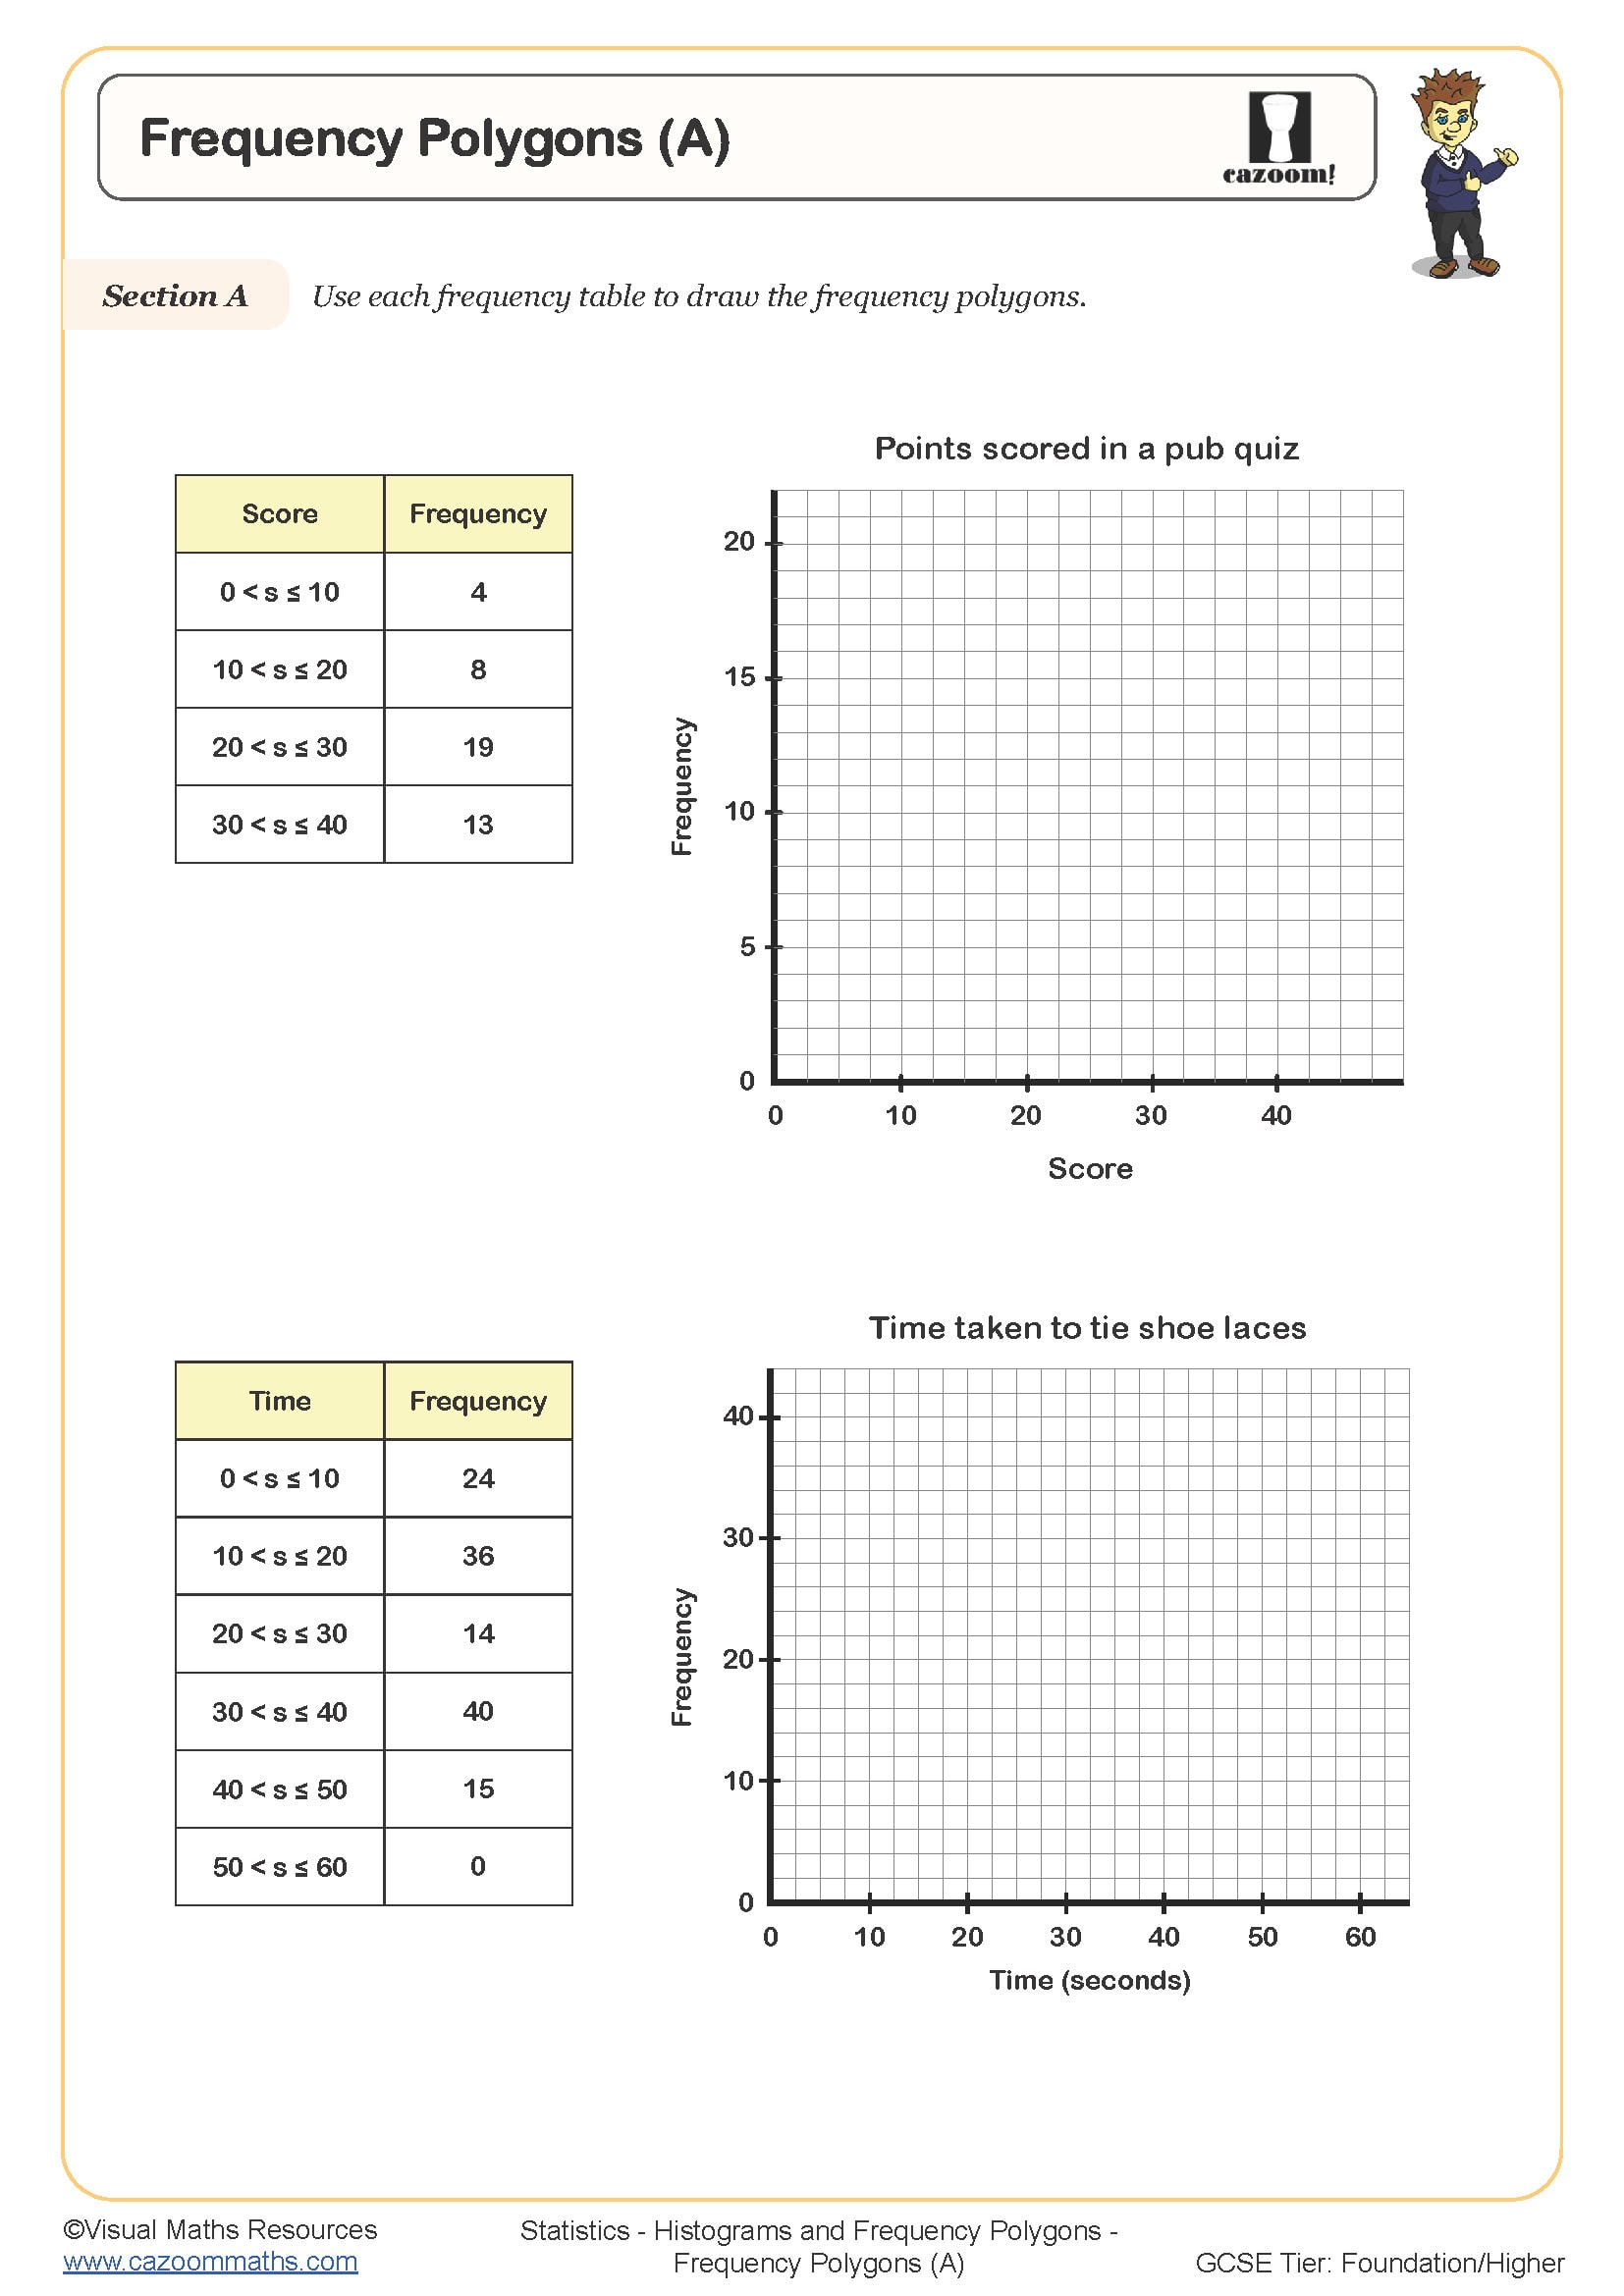
Frequency Polygons (A)
Year groups: 8, 9
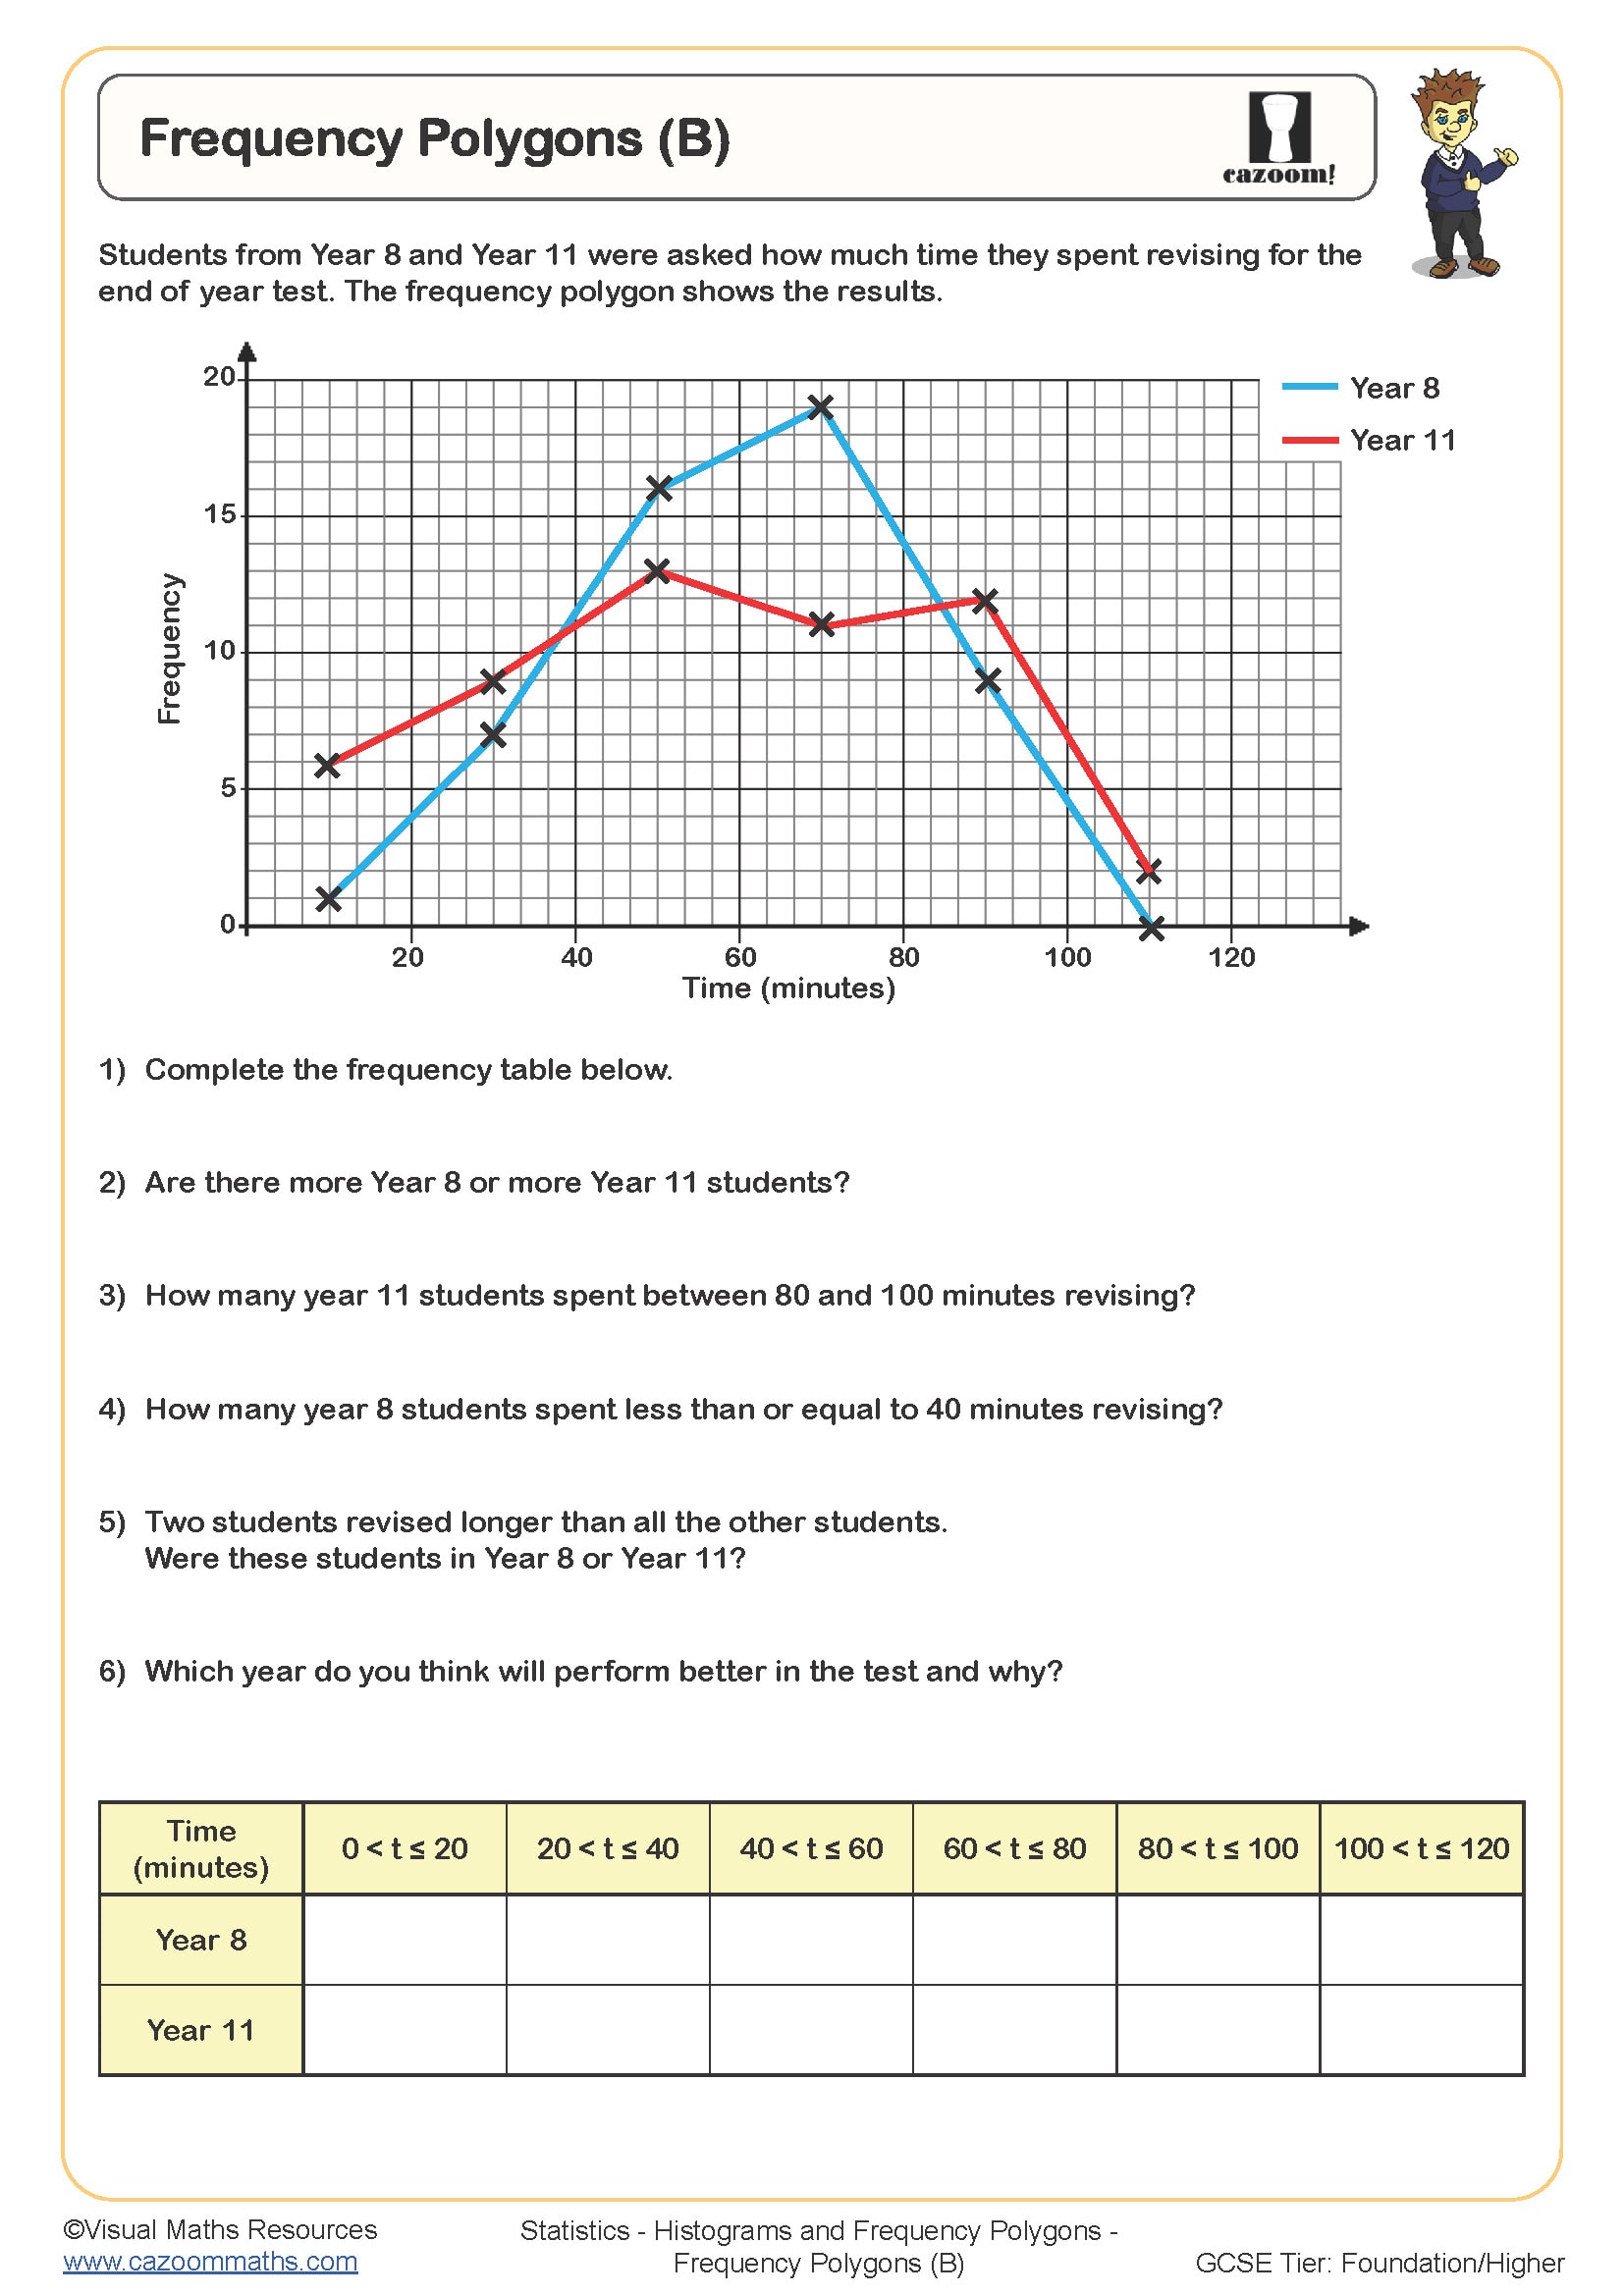
Frequency Polygons (B)
Year groups: 8, 9
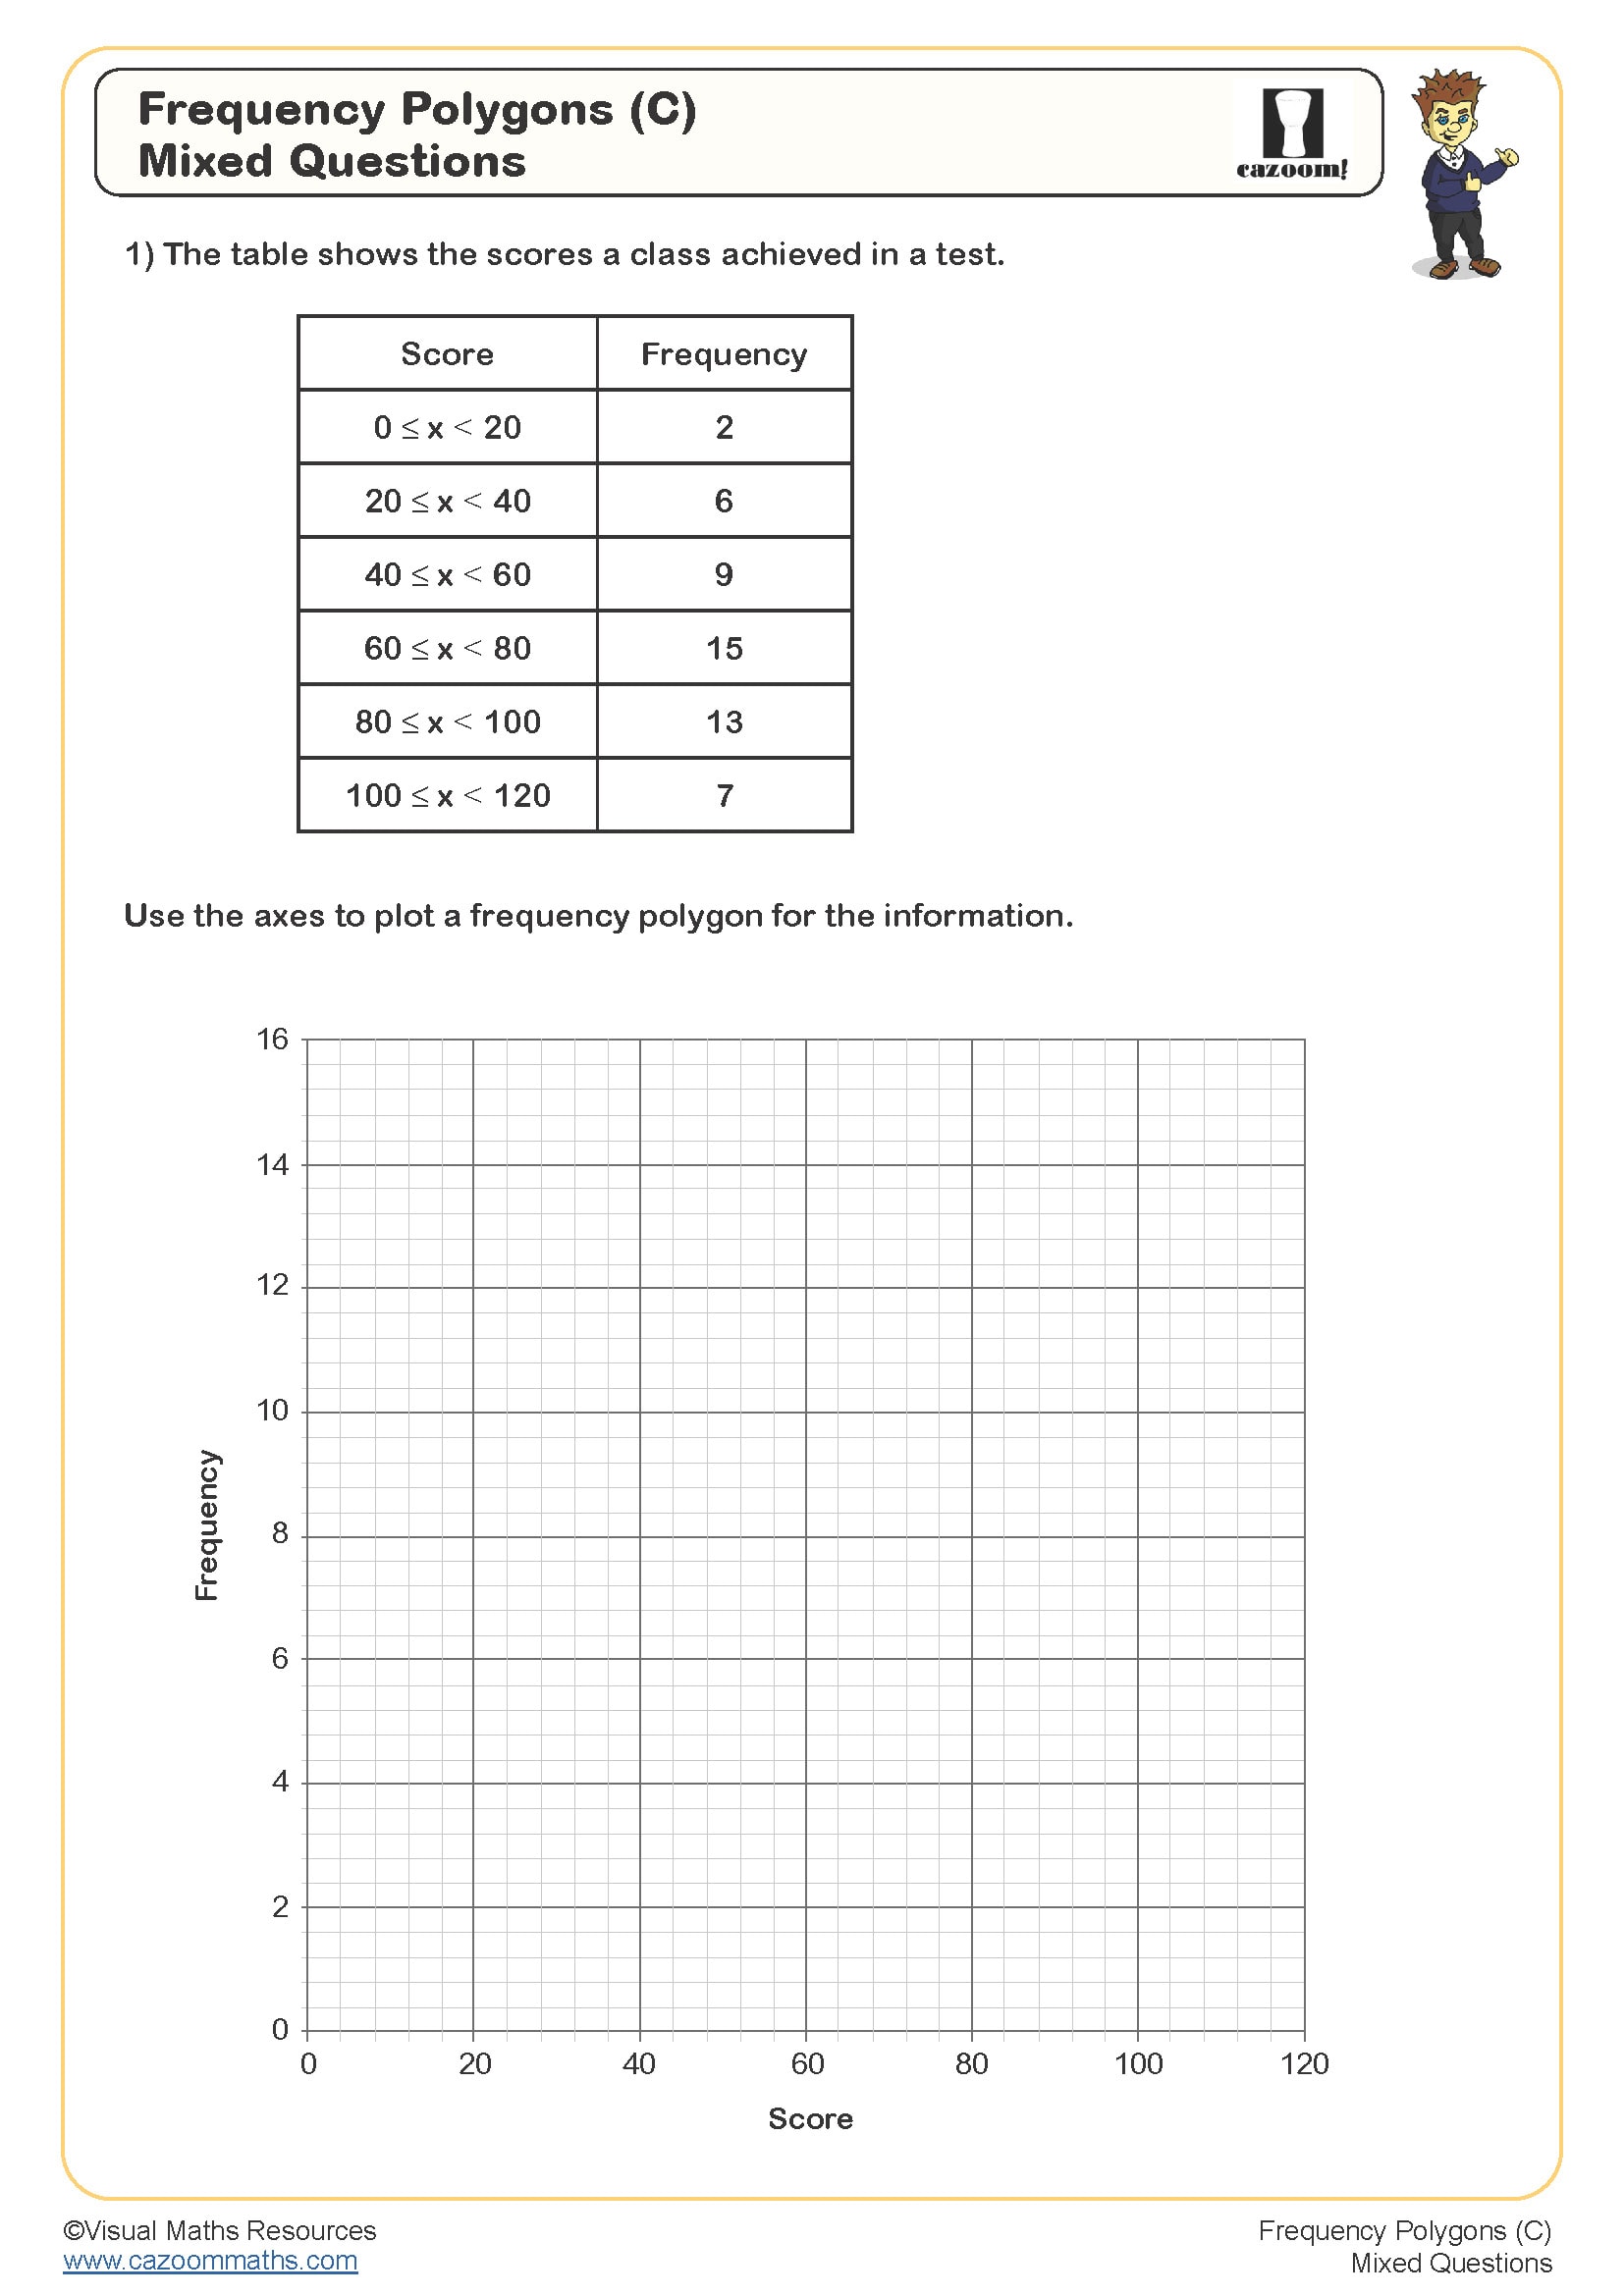
Frequency Polygons (C)
Year groups: 8, 9
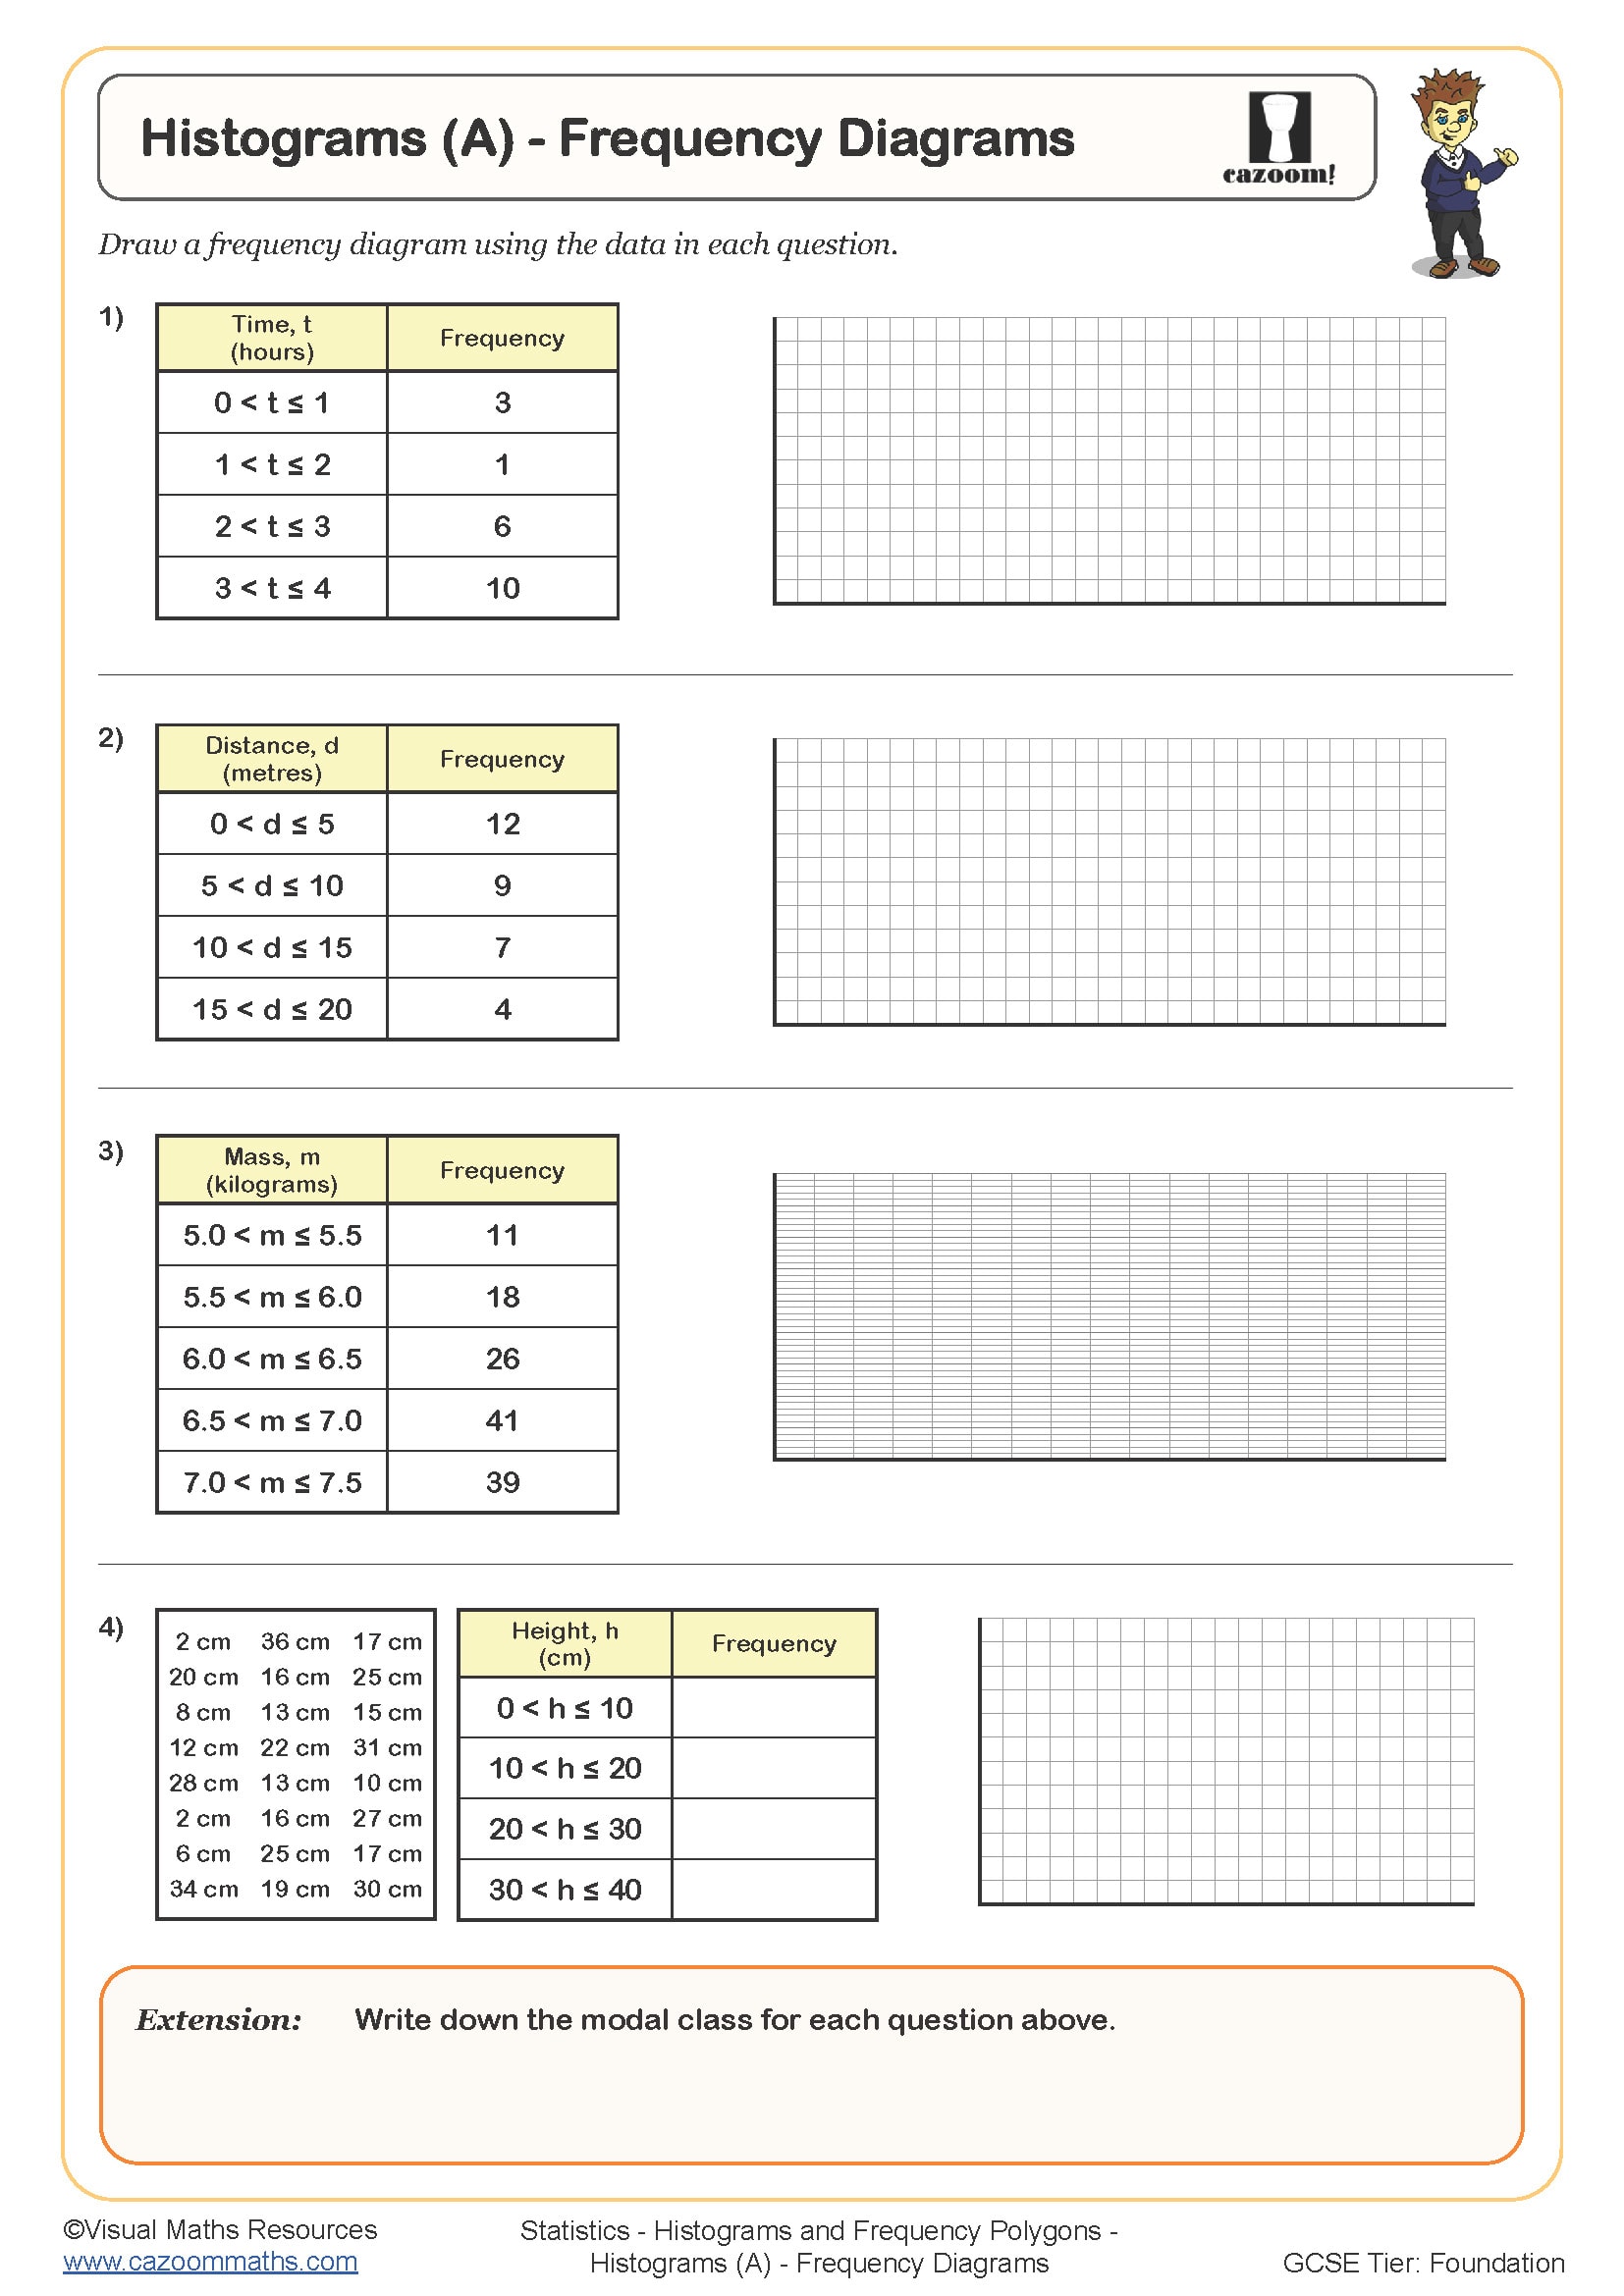
Histograms (A) - Frequency Diagrams
Year groups: 8, 9
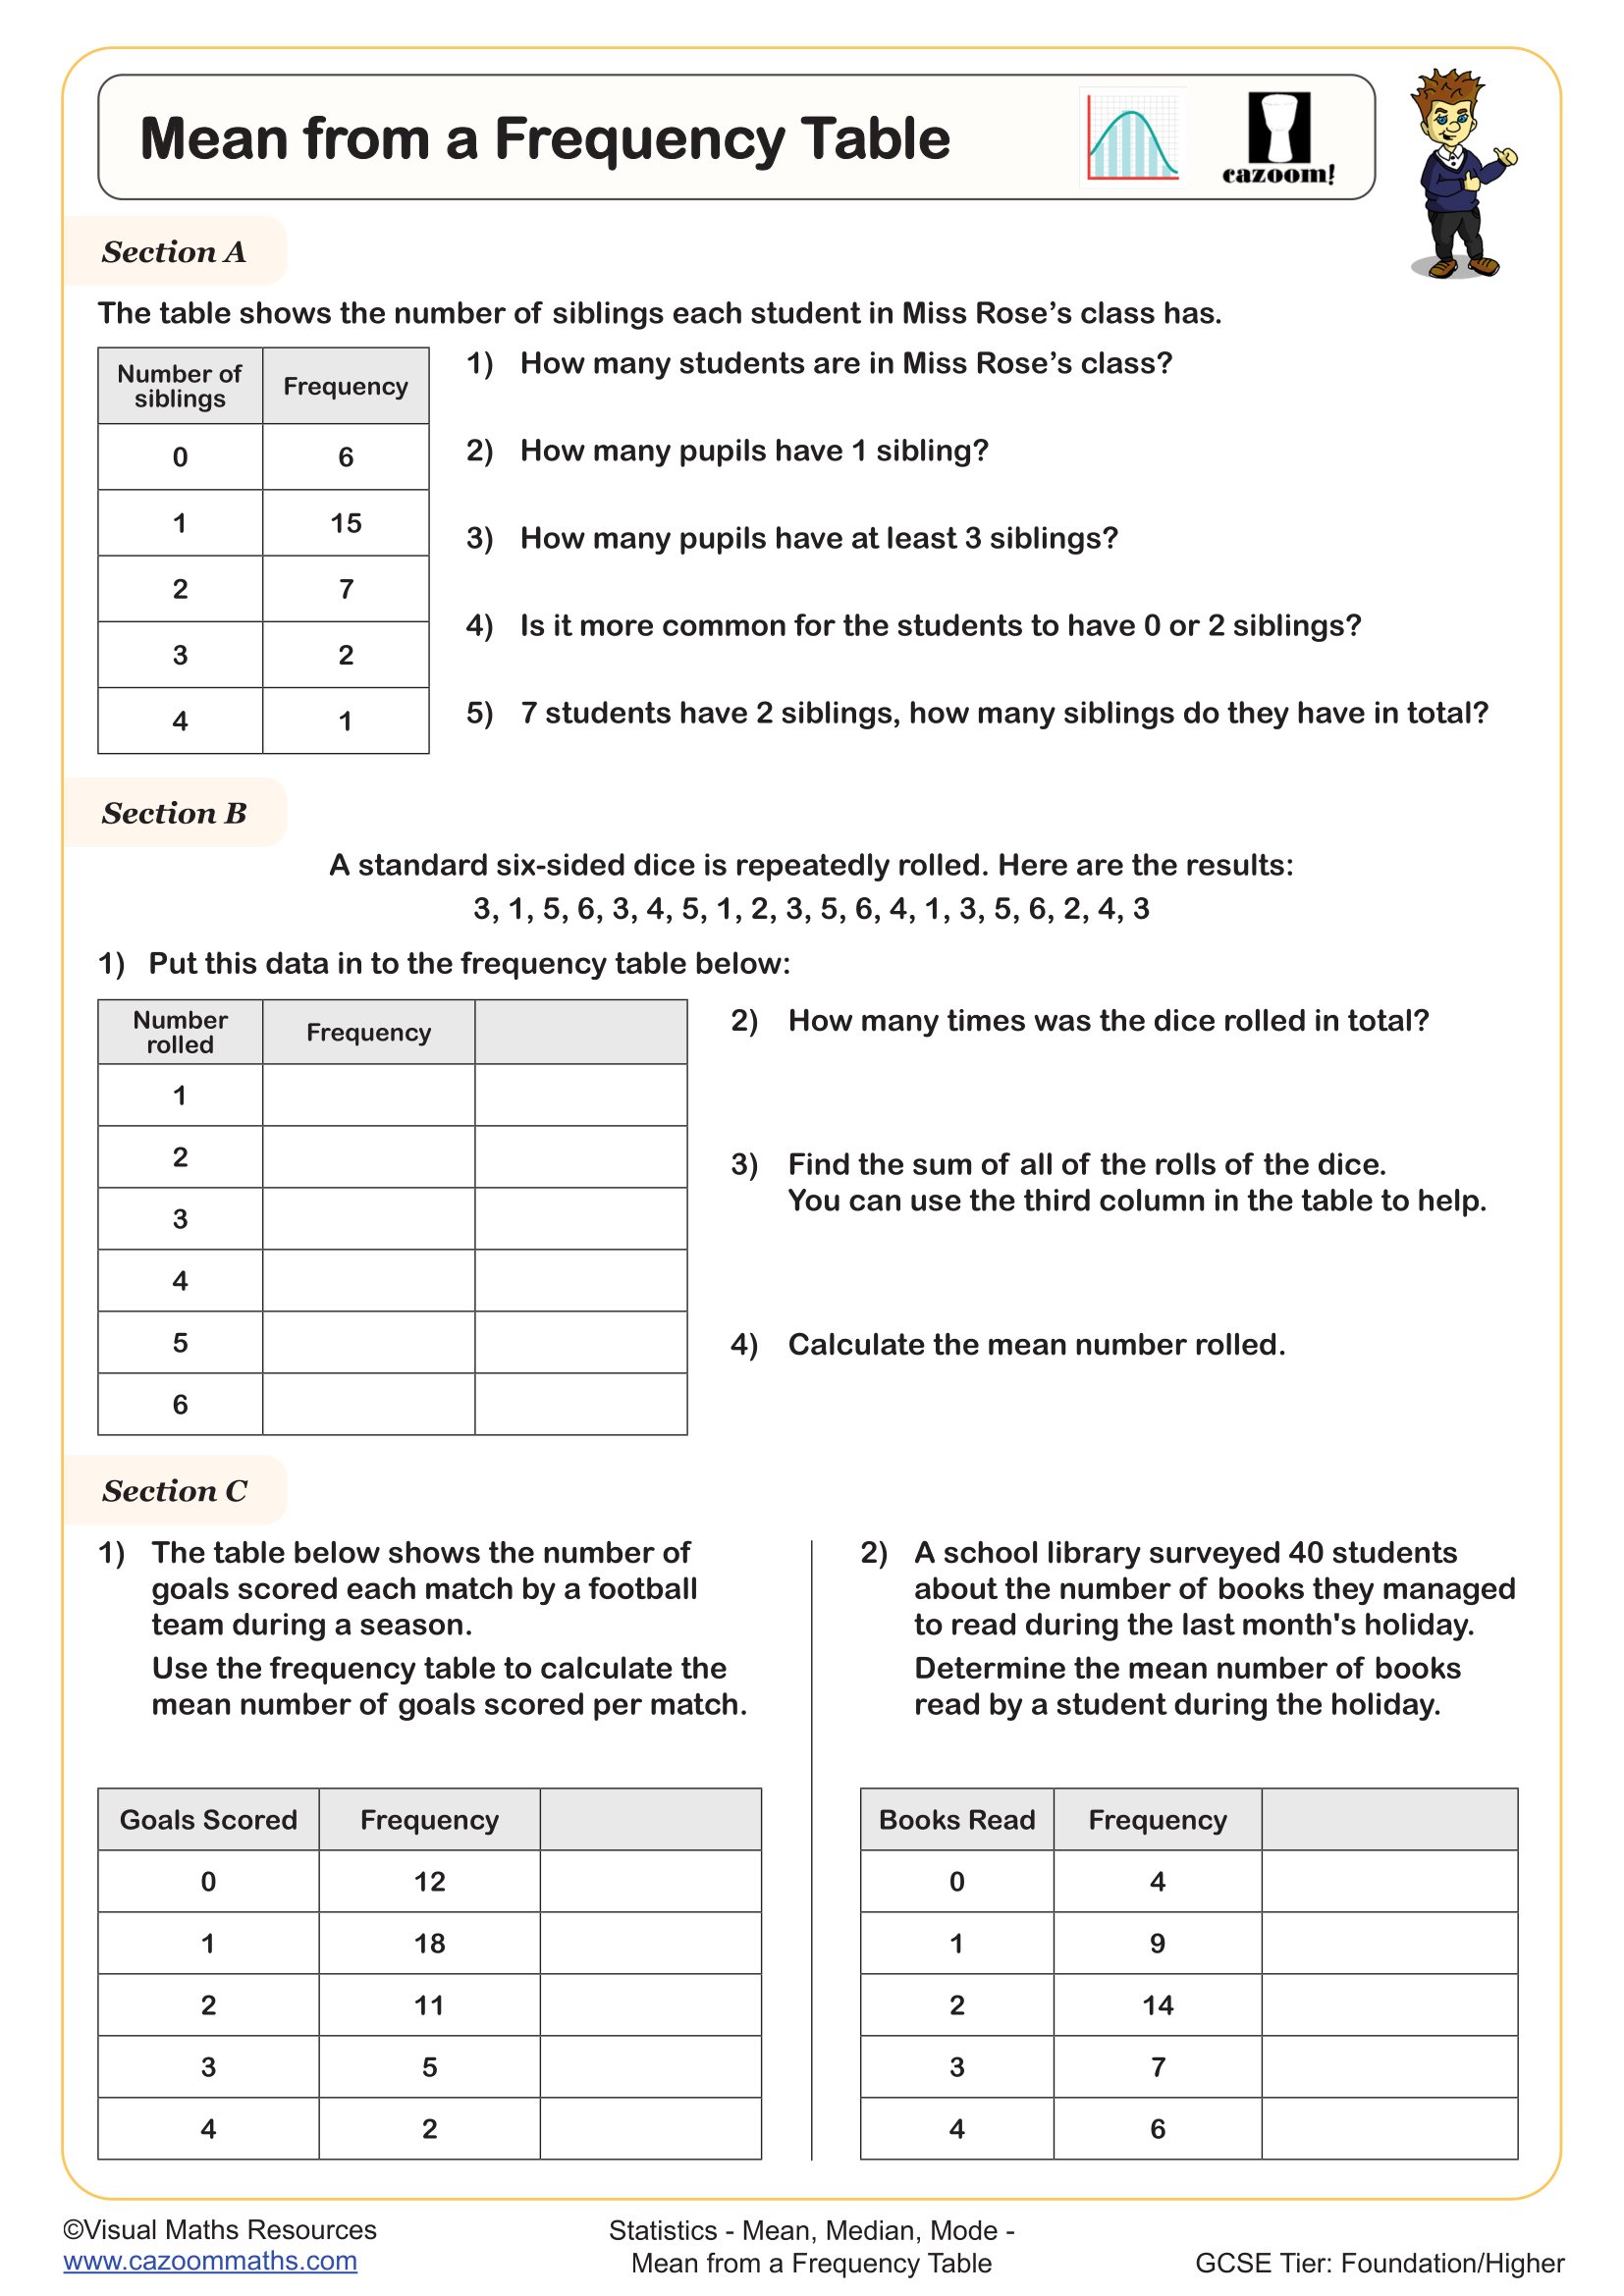
Mean from a Frequency Table
Year groups: 8, 9
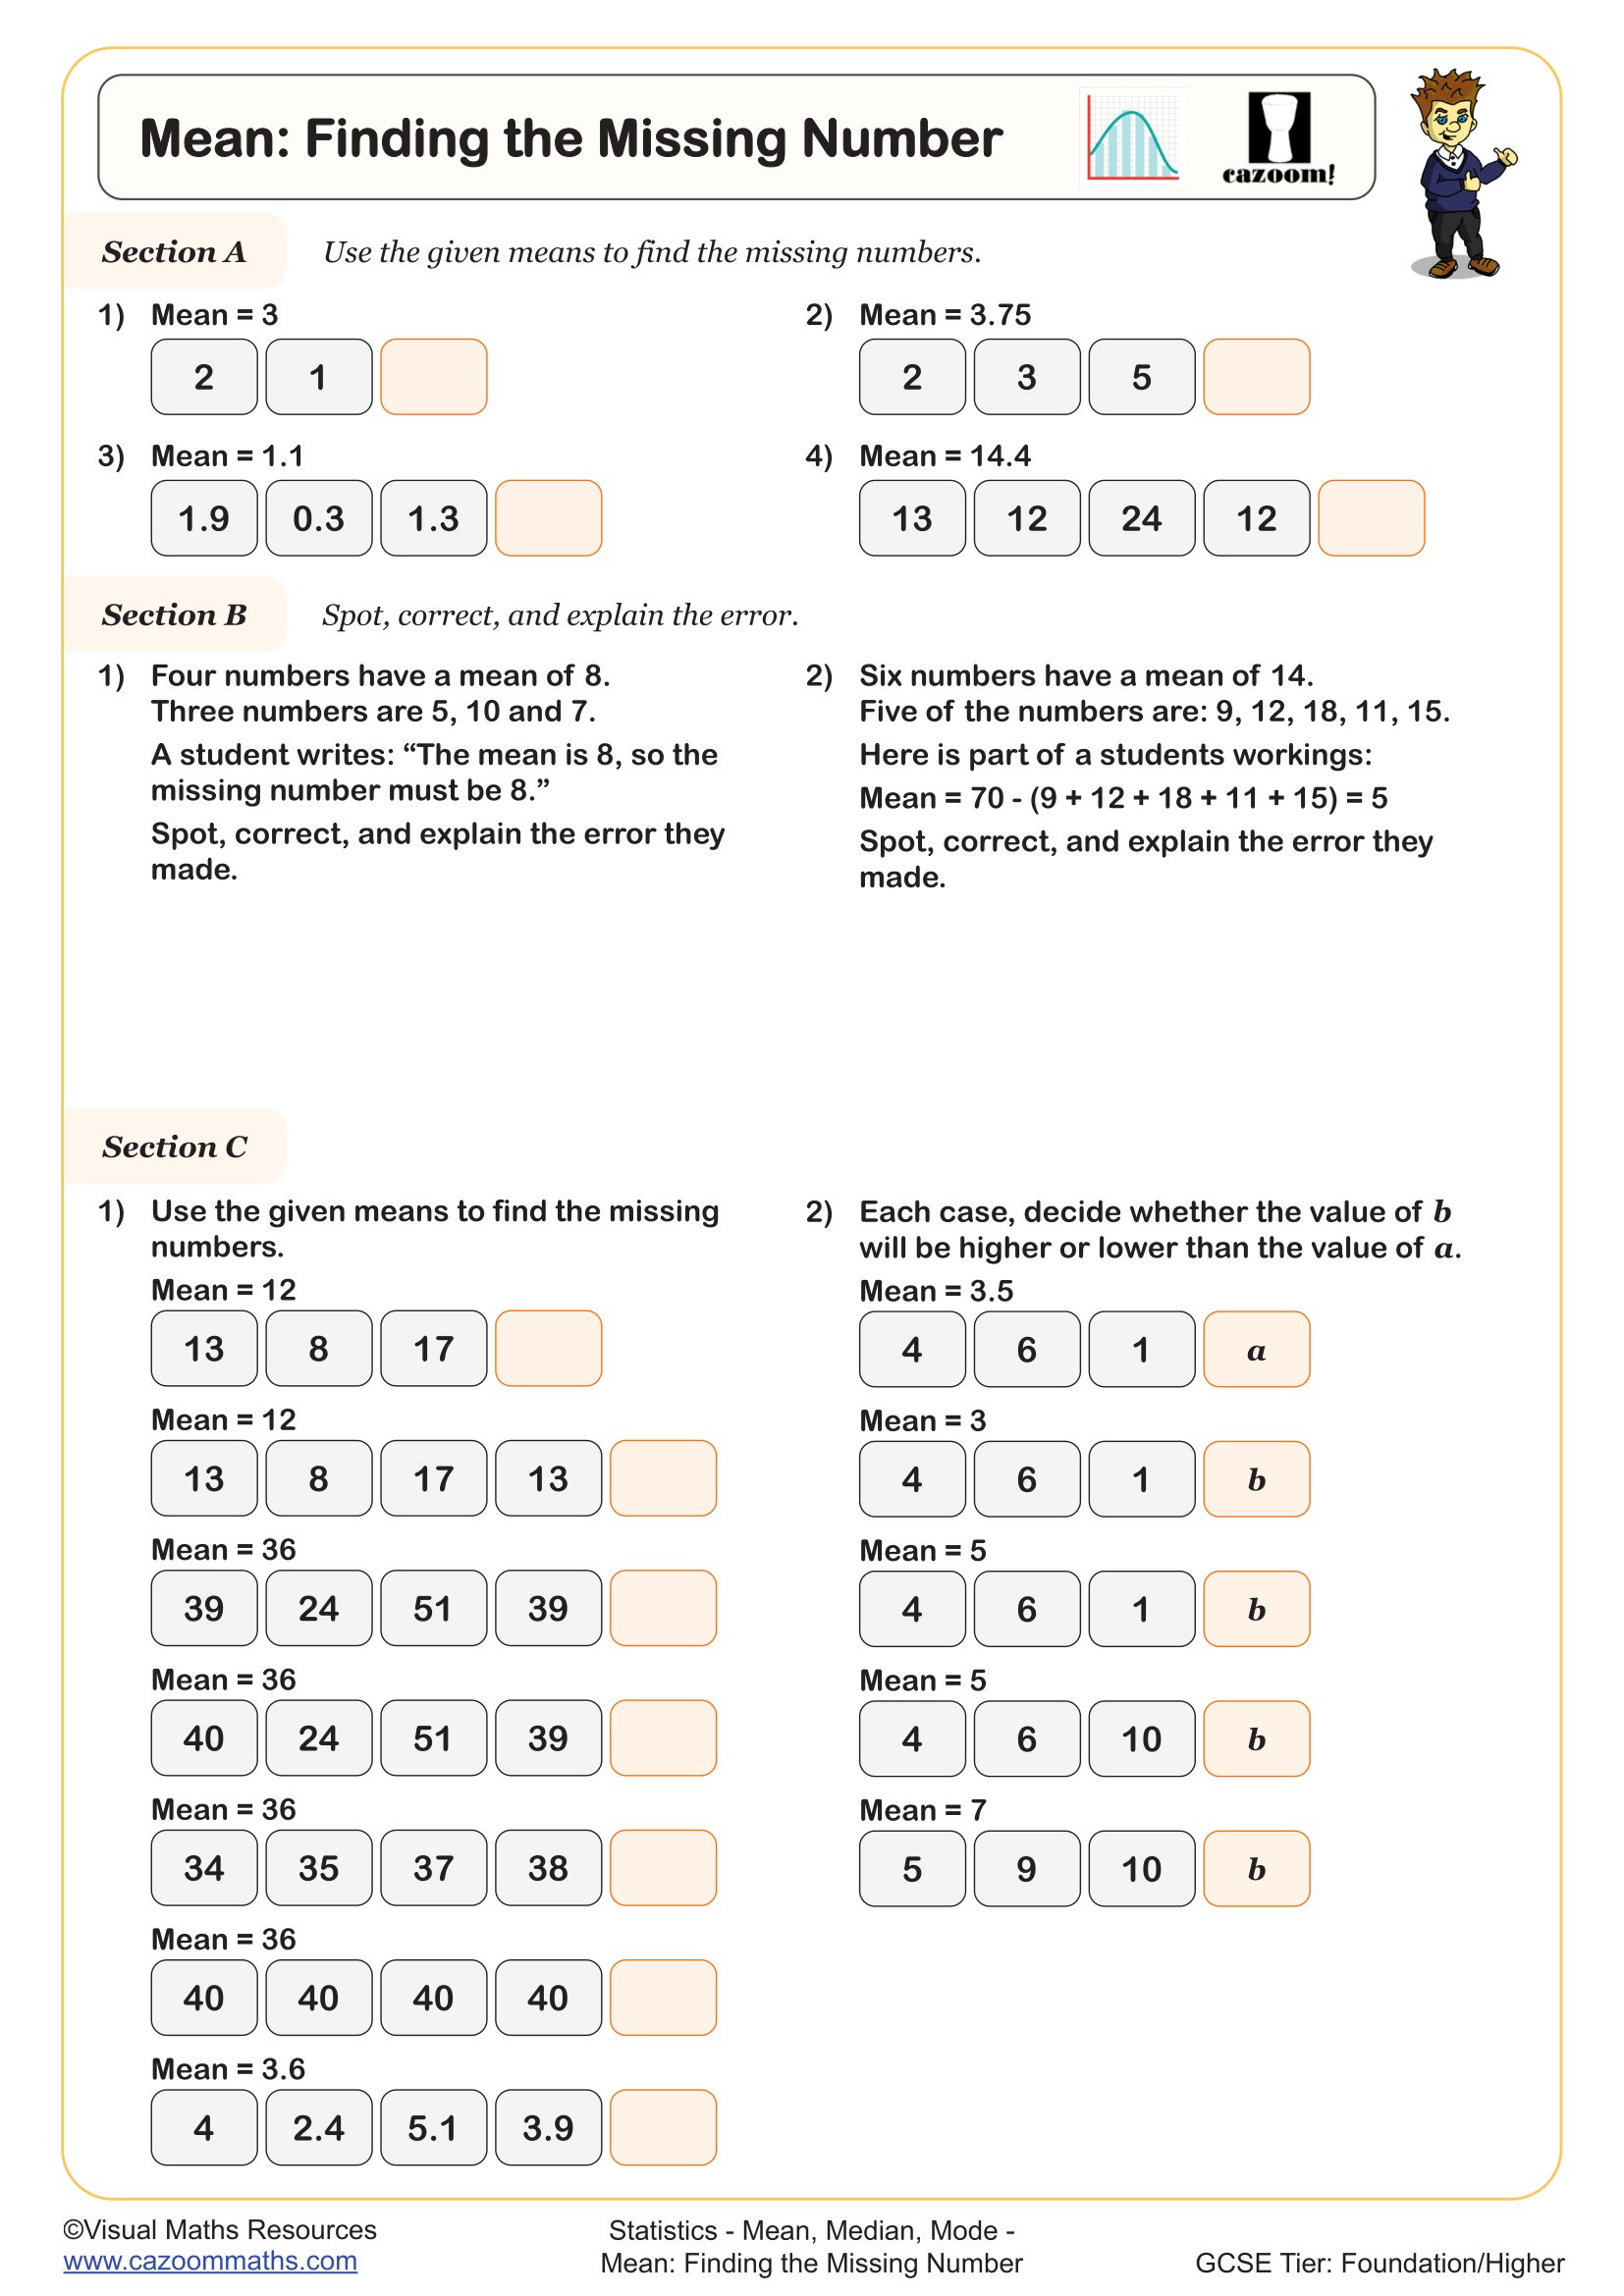
Mean: Finding the Missing Number
Year groups: 8, 9
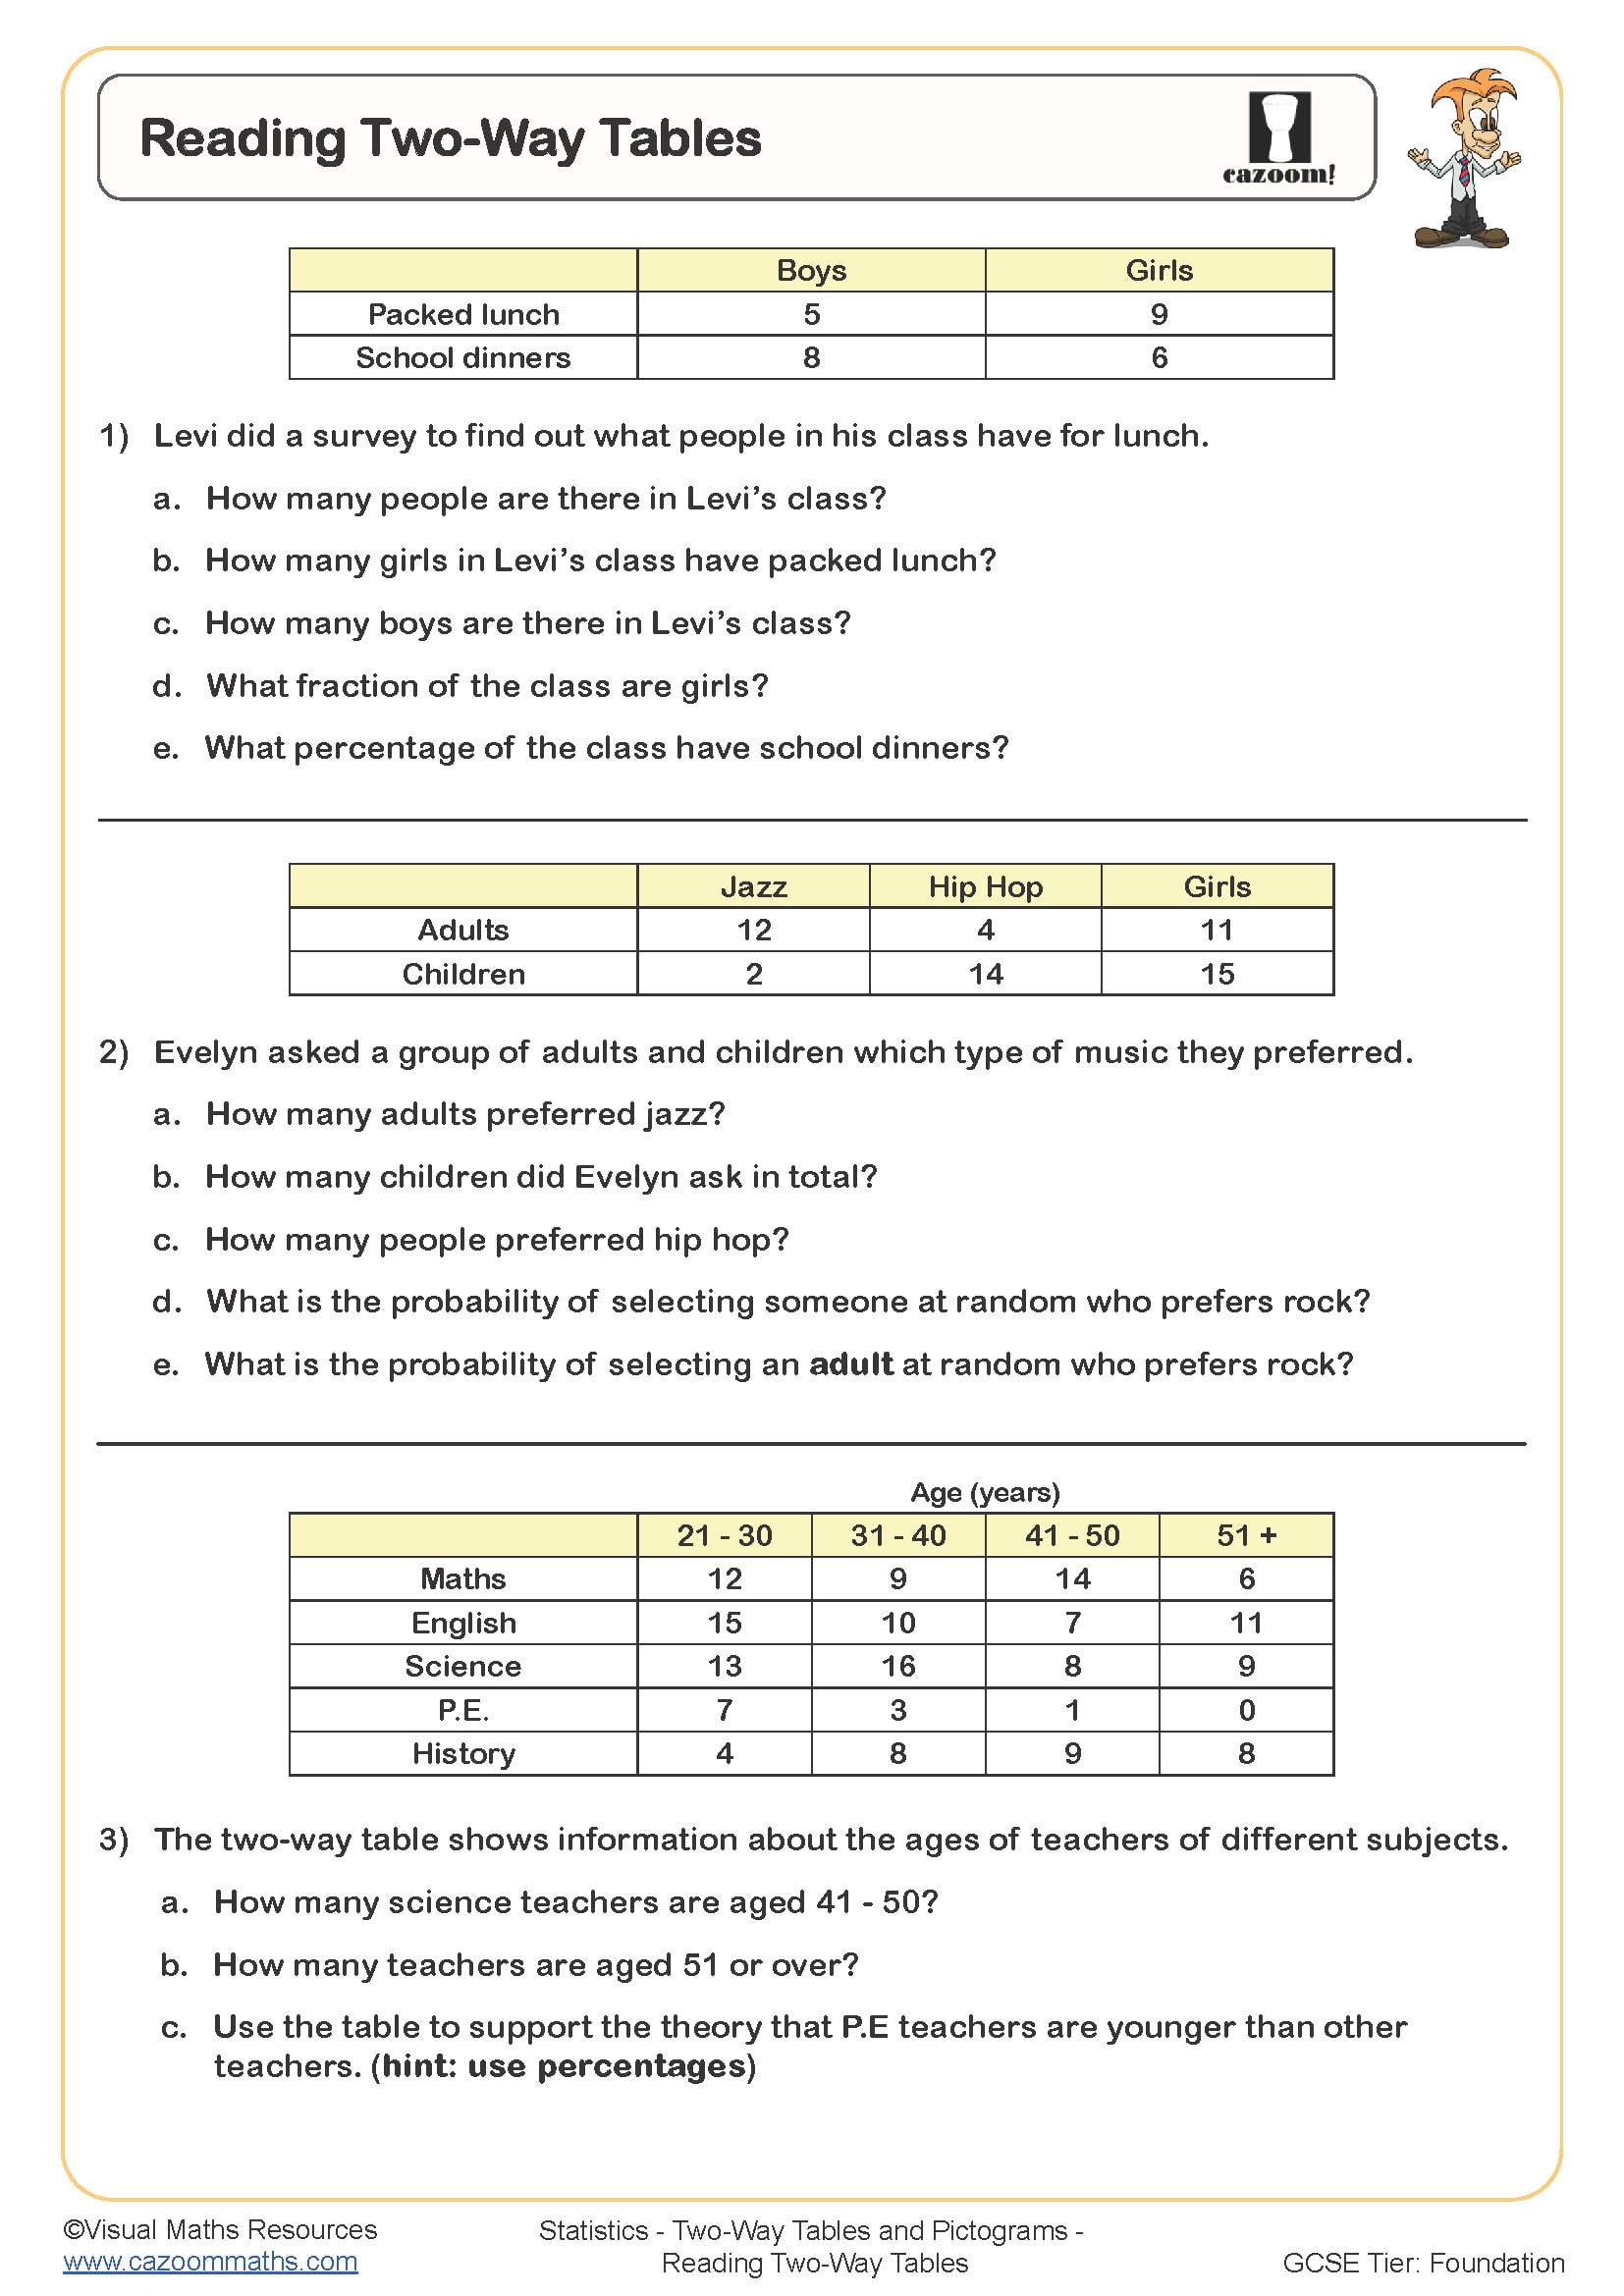
Reading Two-way Tables
Year groups: 8, 9
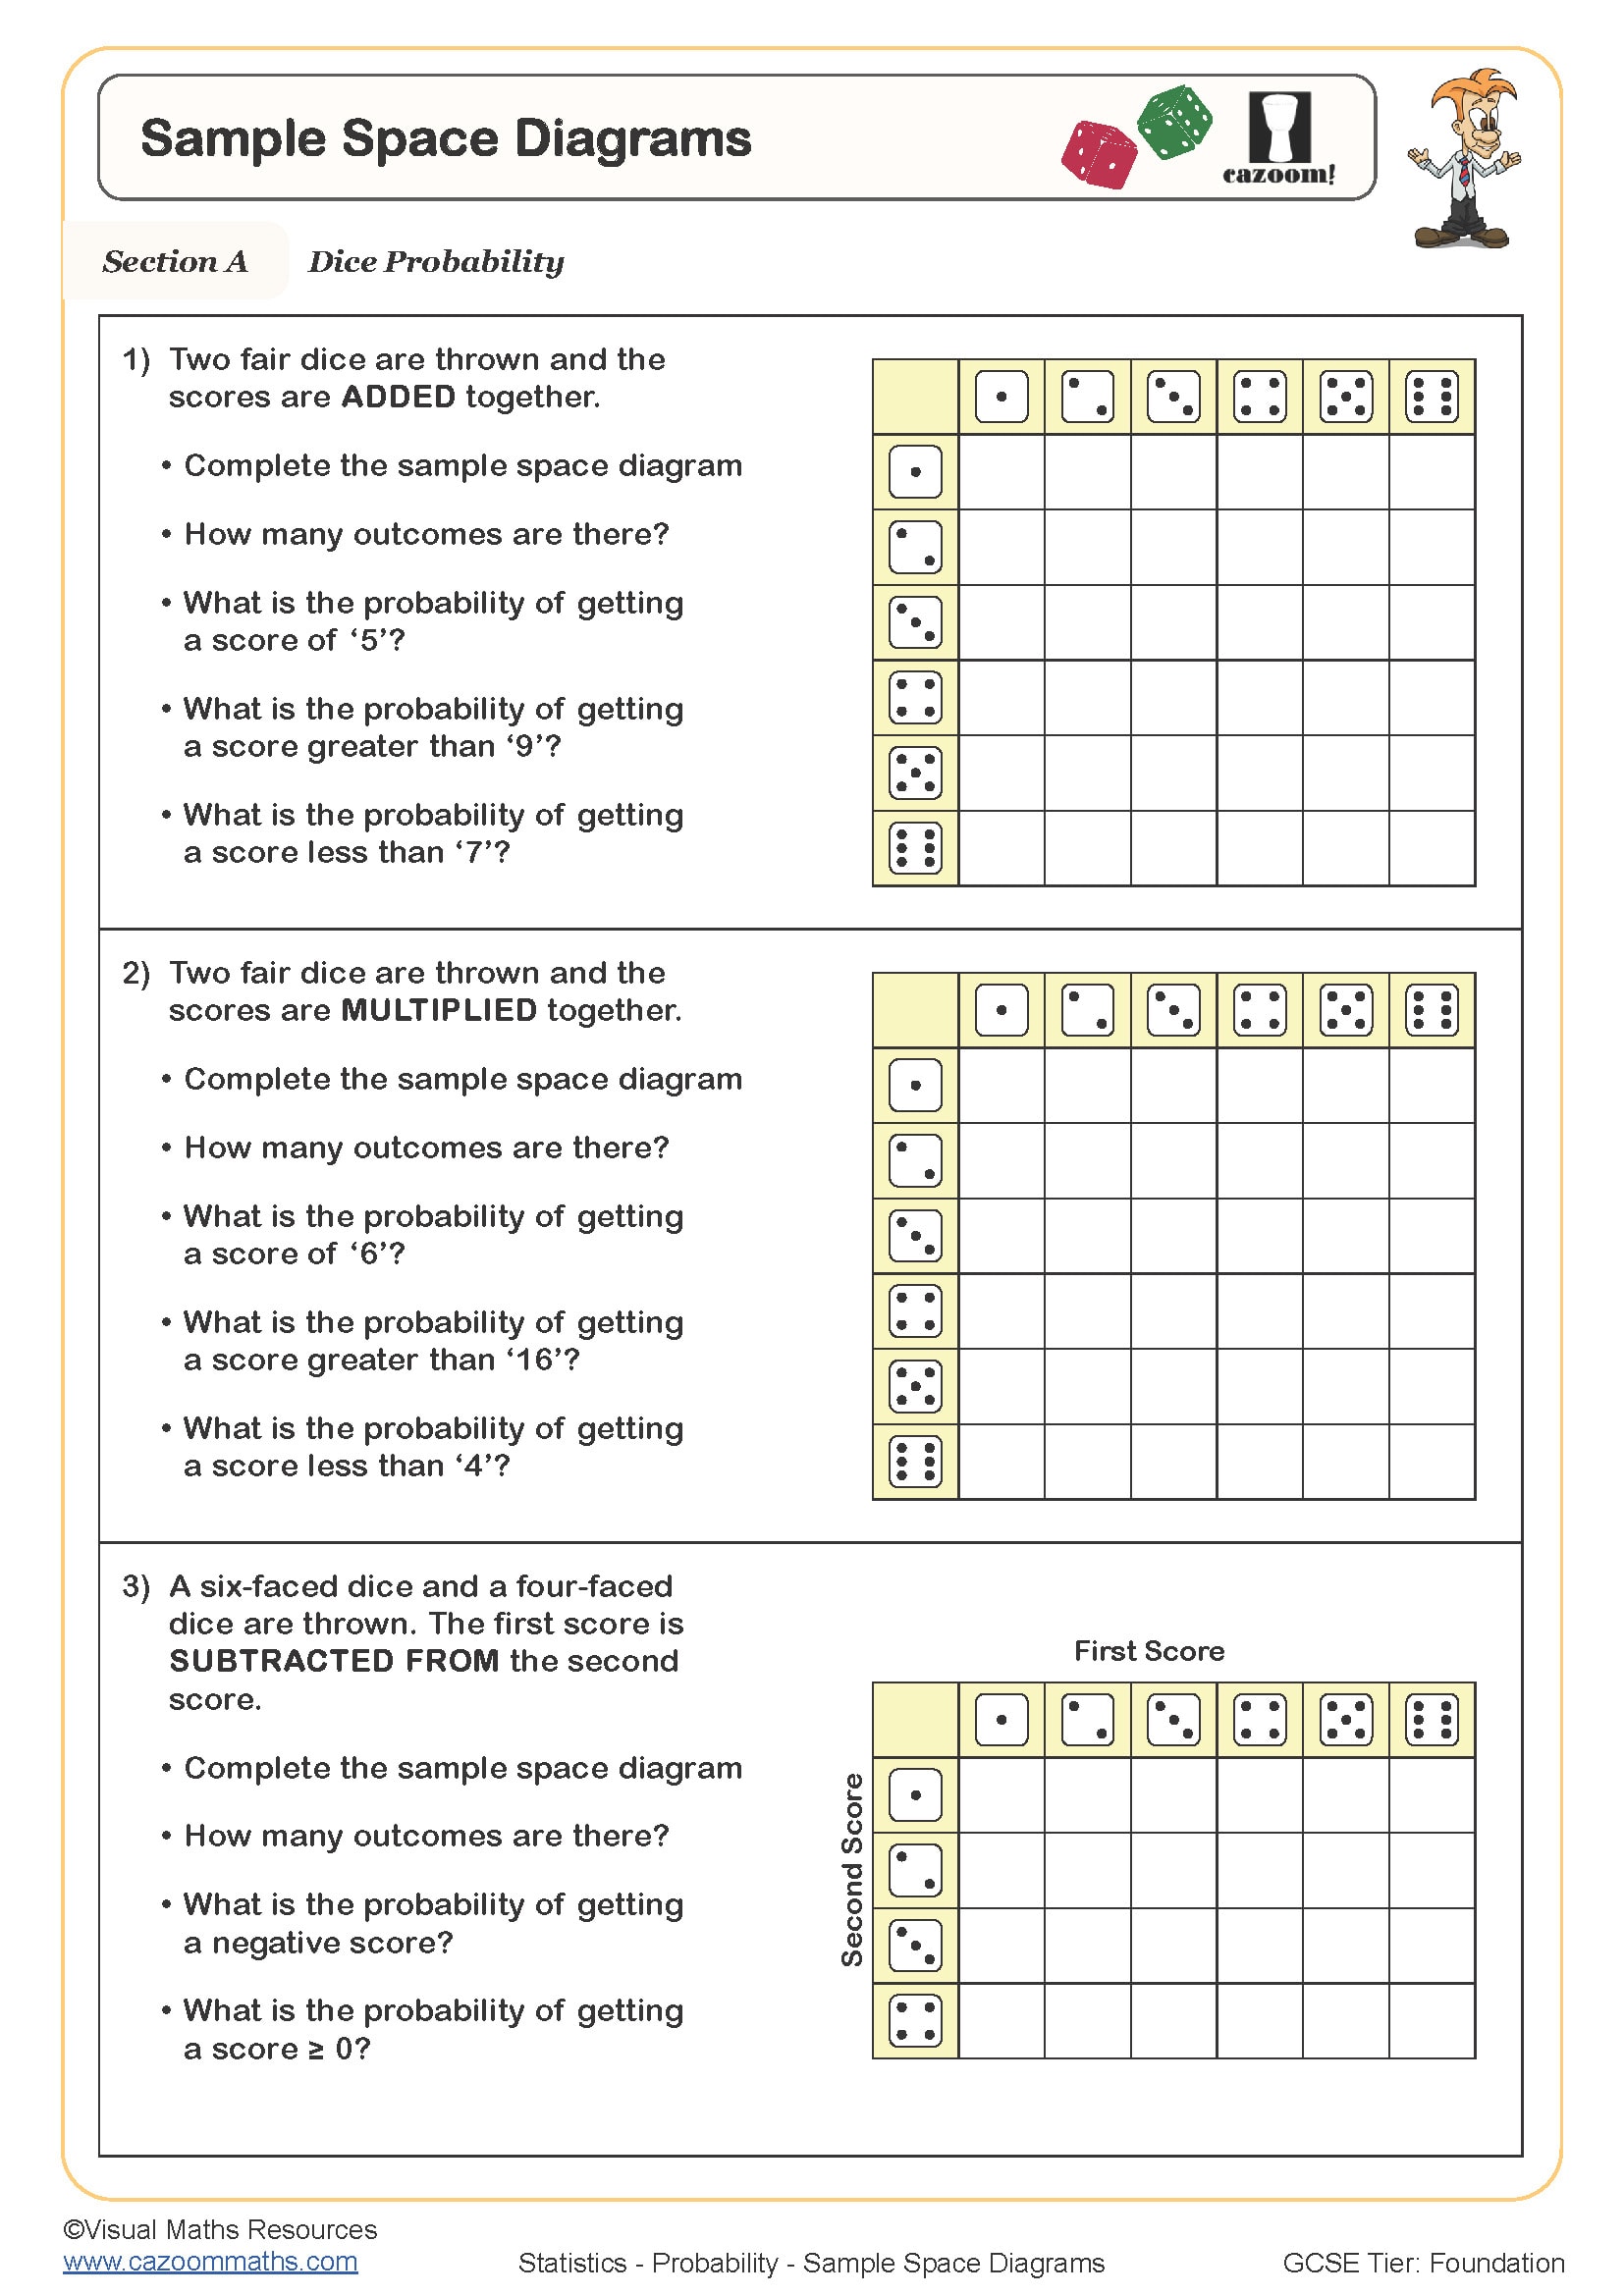
Sample Space Diagrams
Year groups: 8, 9, 10
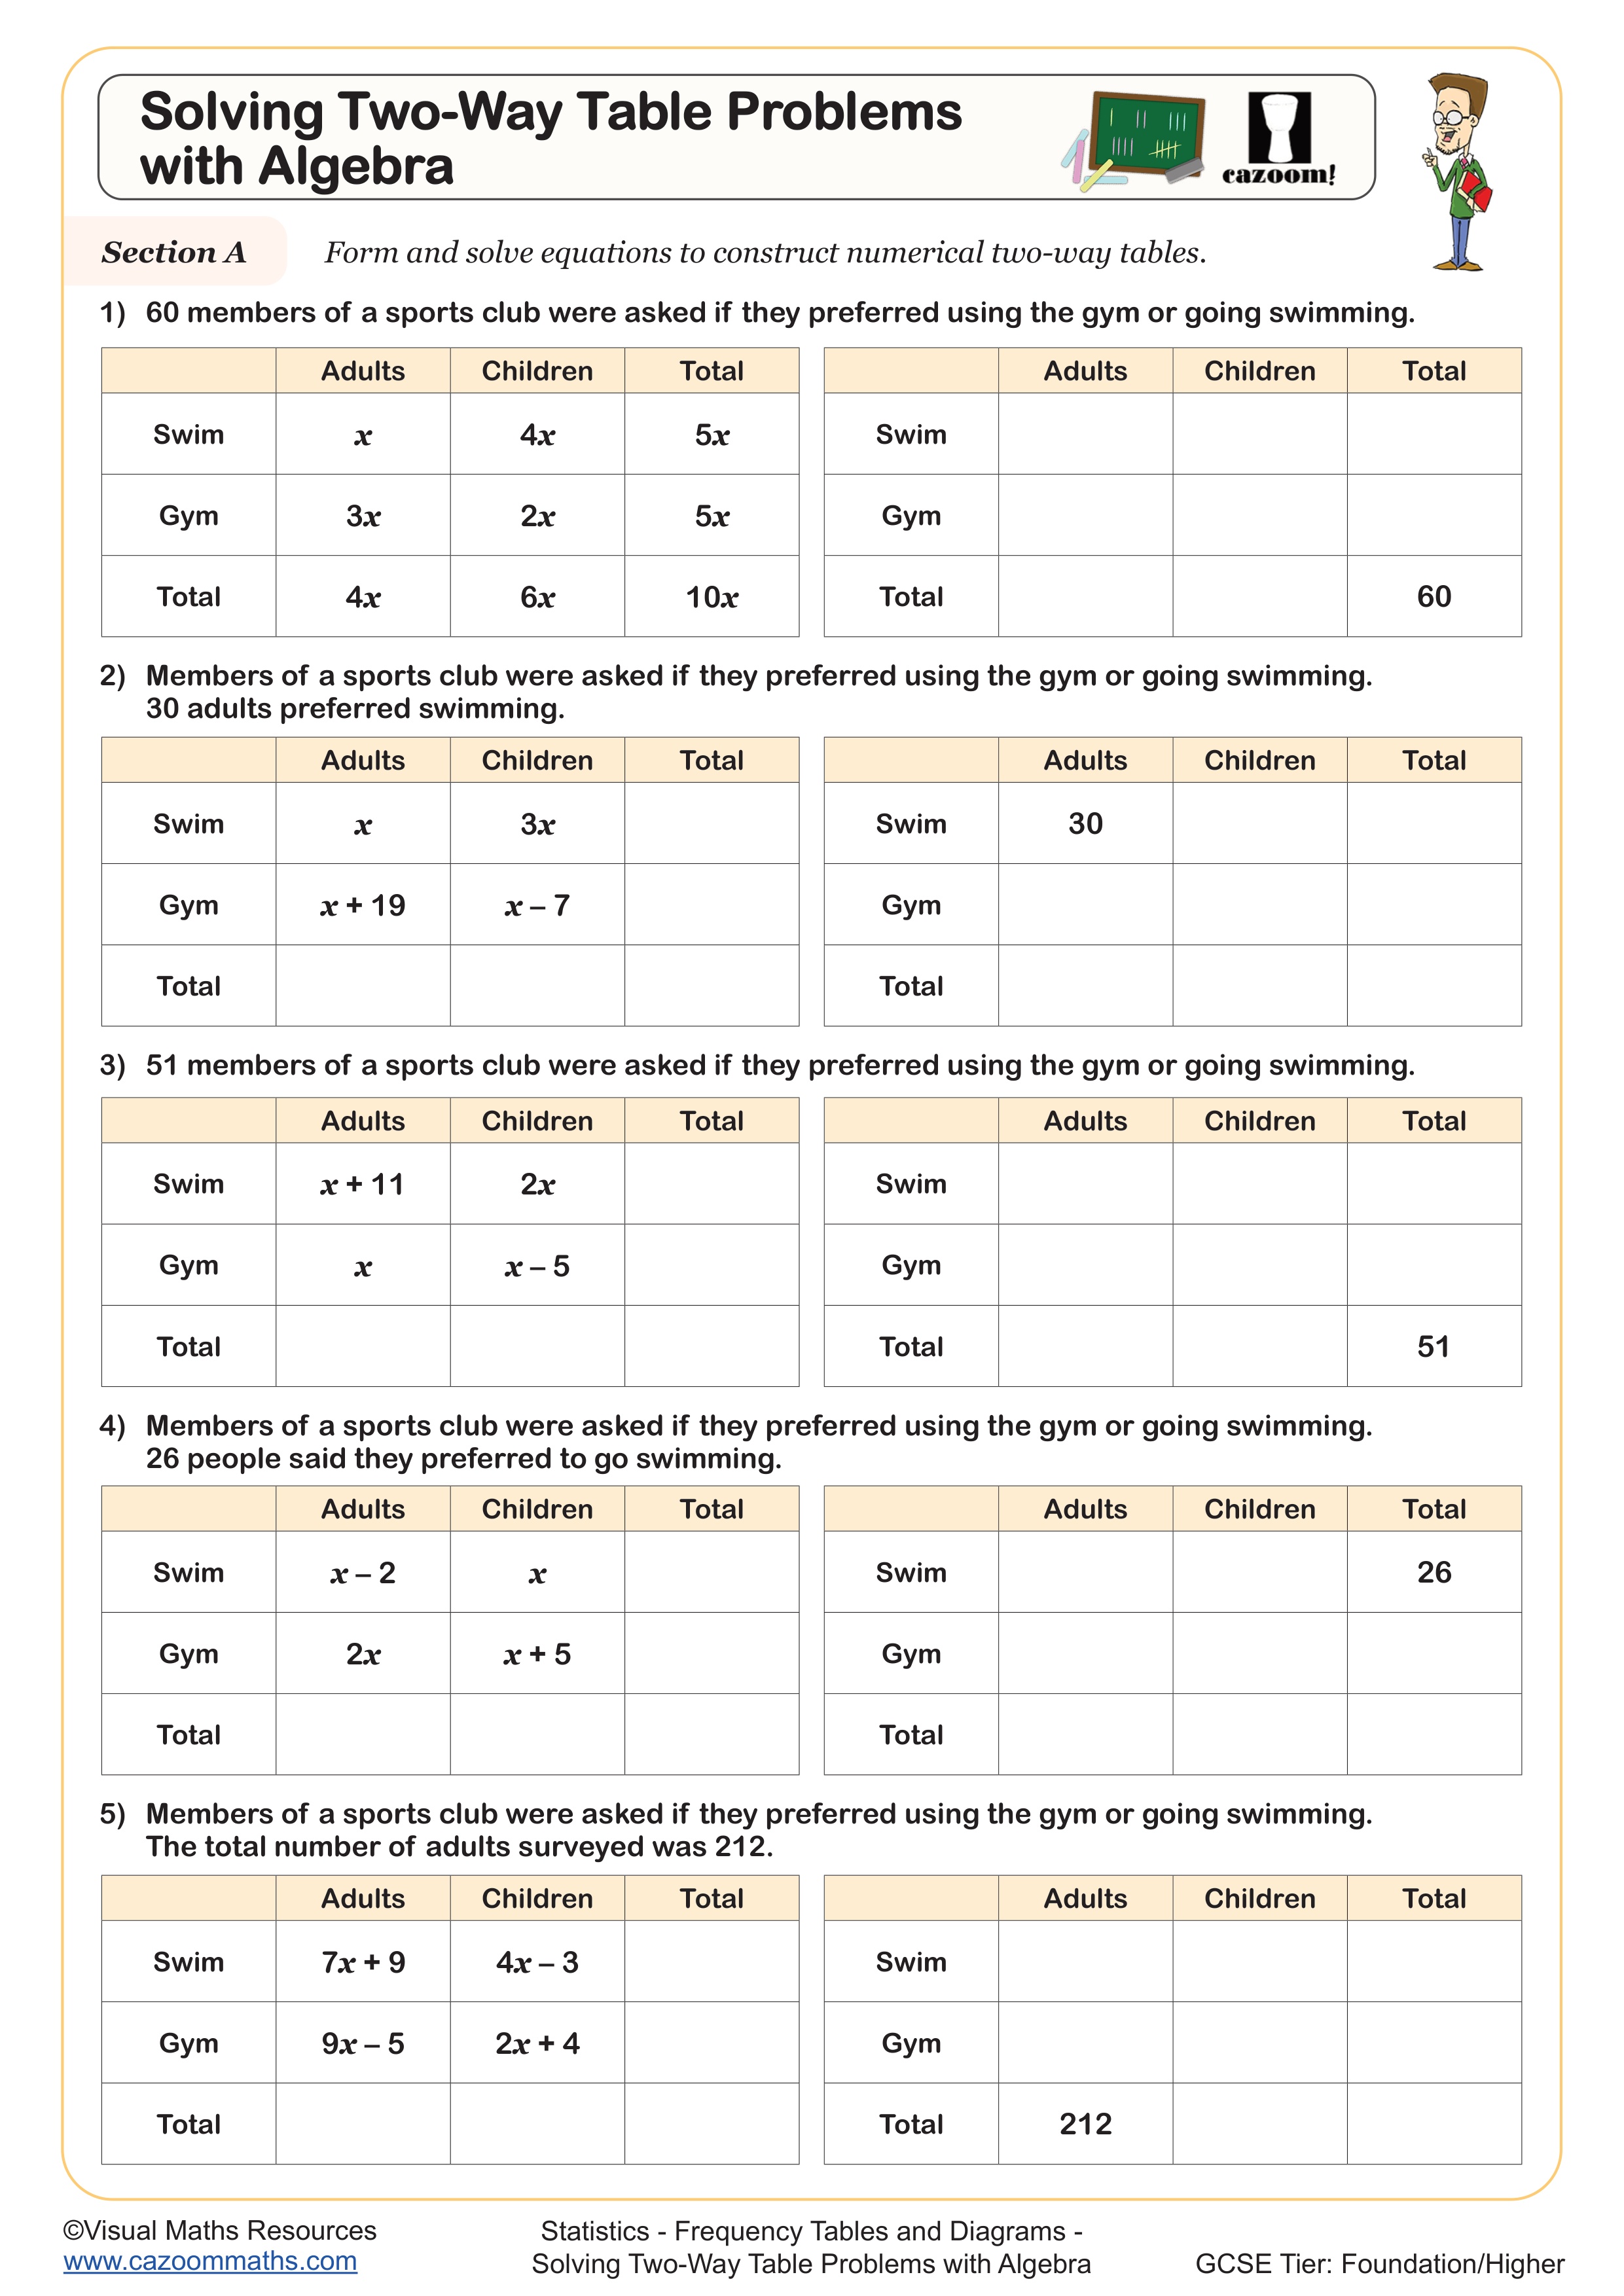
Solving Two-Way Table Problems with Algebra
Year groups: 8, 9
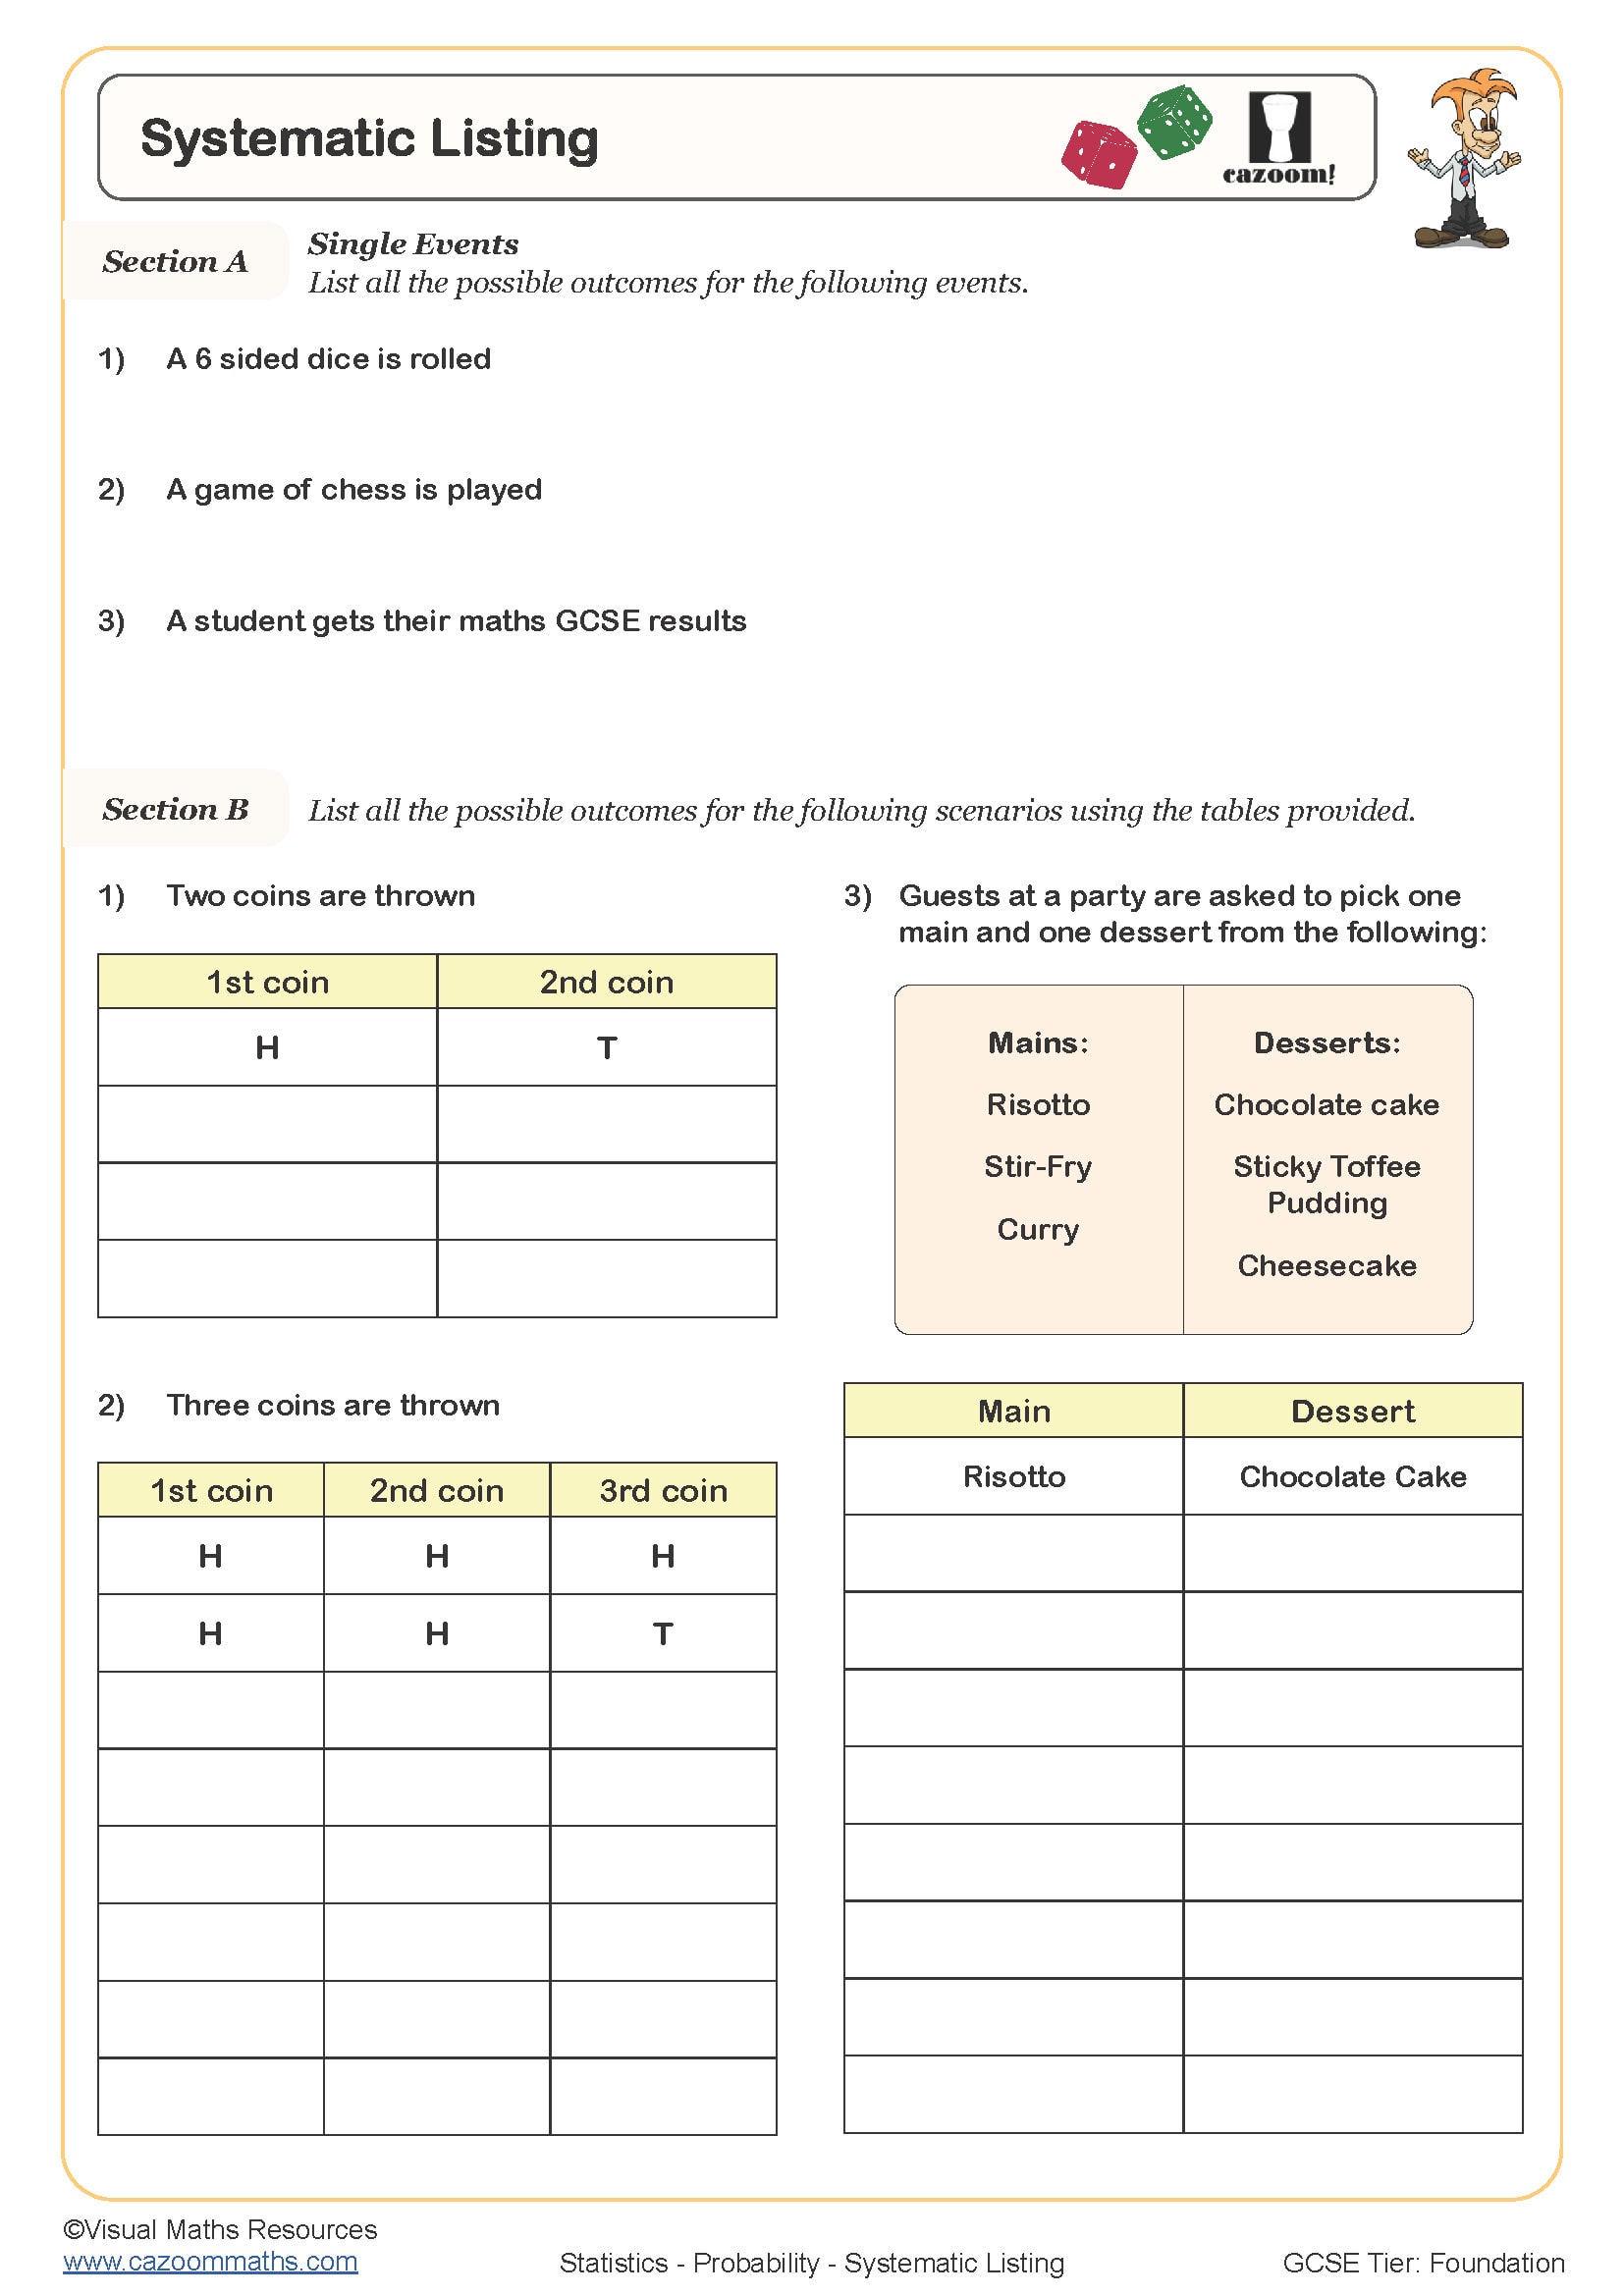
Systematic Listing
Year groups: 8, 9, 10
Two-Way Tables and Ratio
Year groups: 8, 9

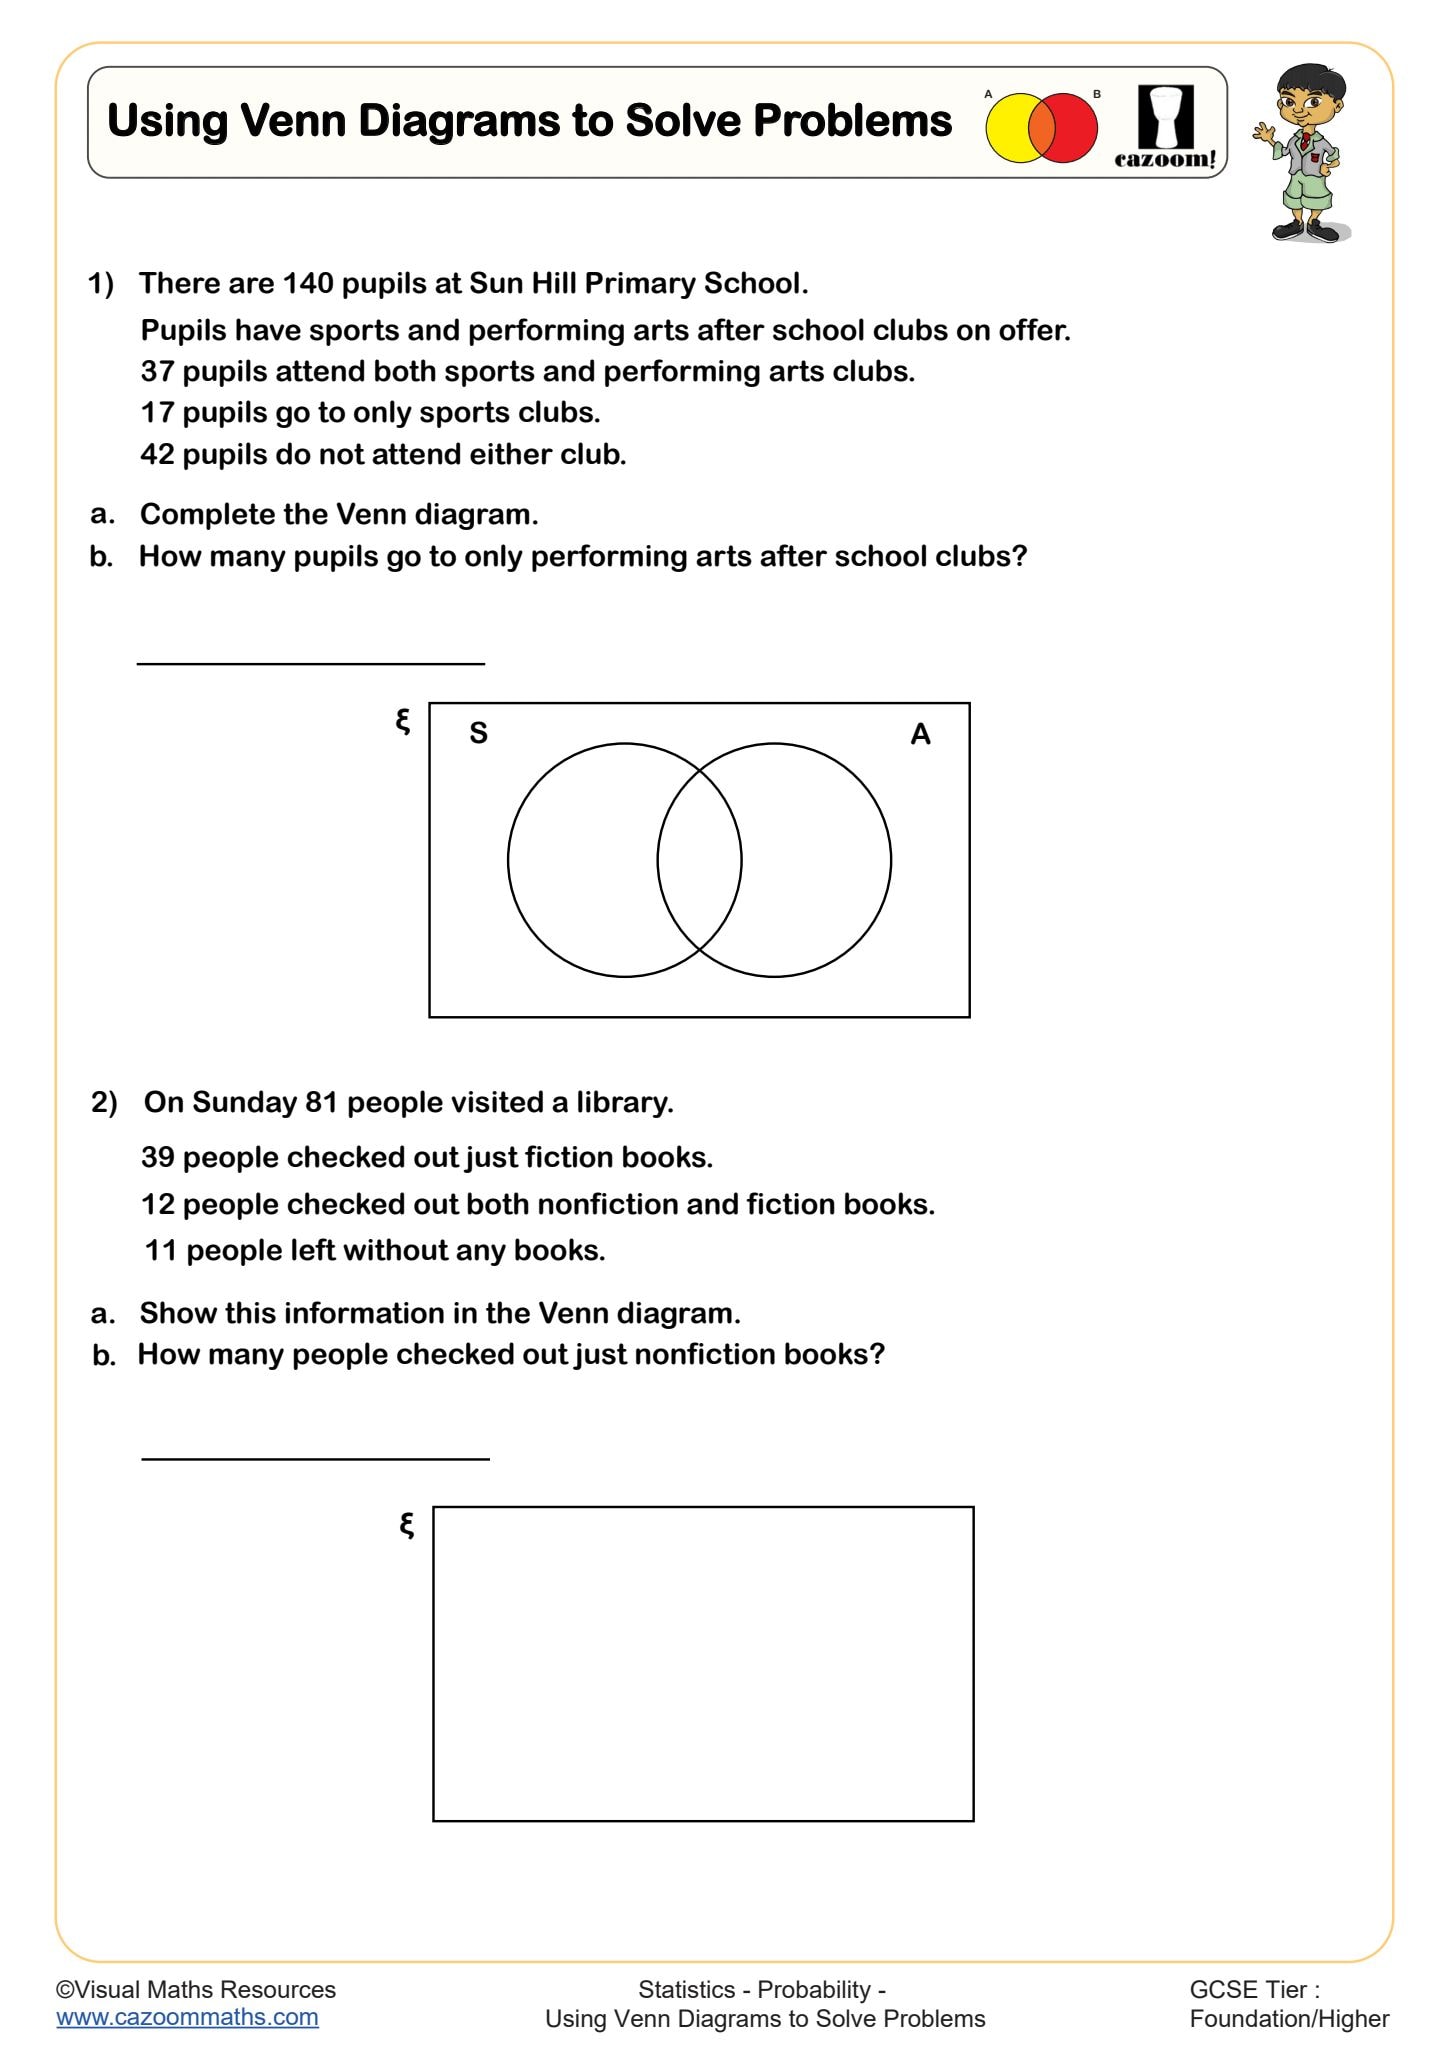
Using Venn Diagrams to Solve Problems
Year groups: 8, 9
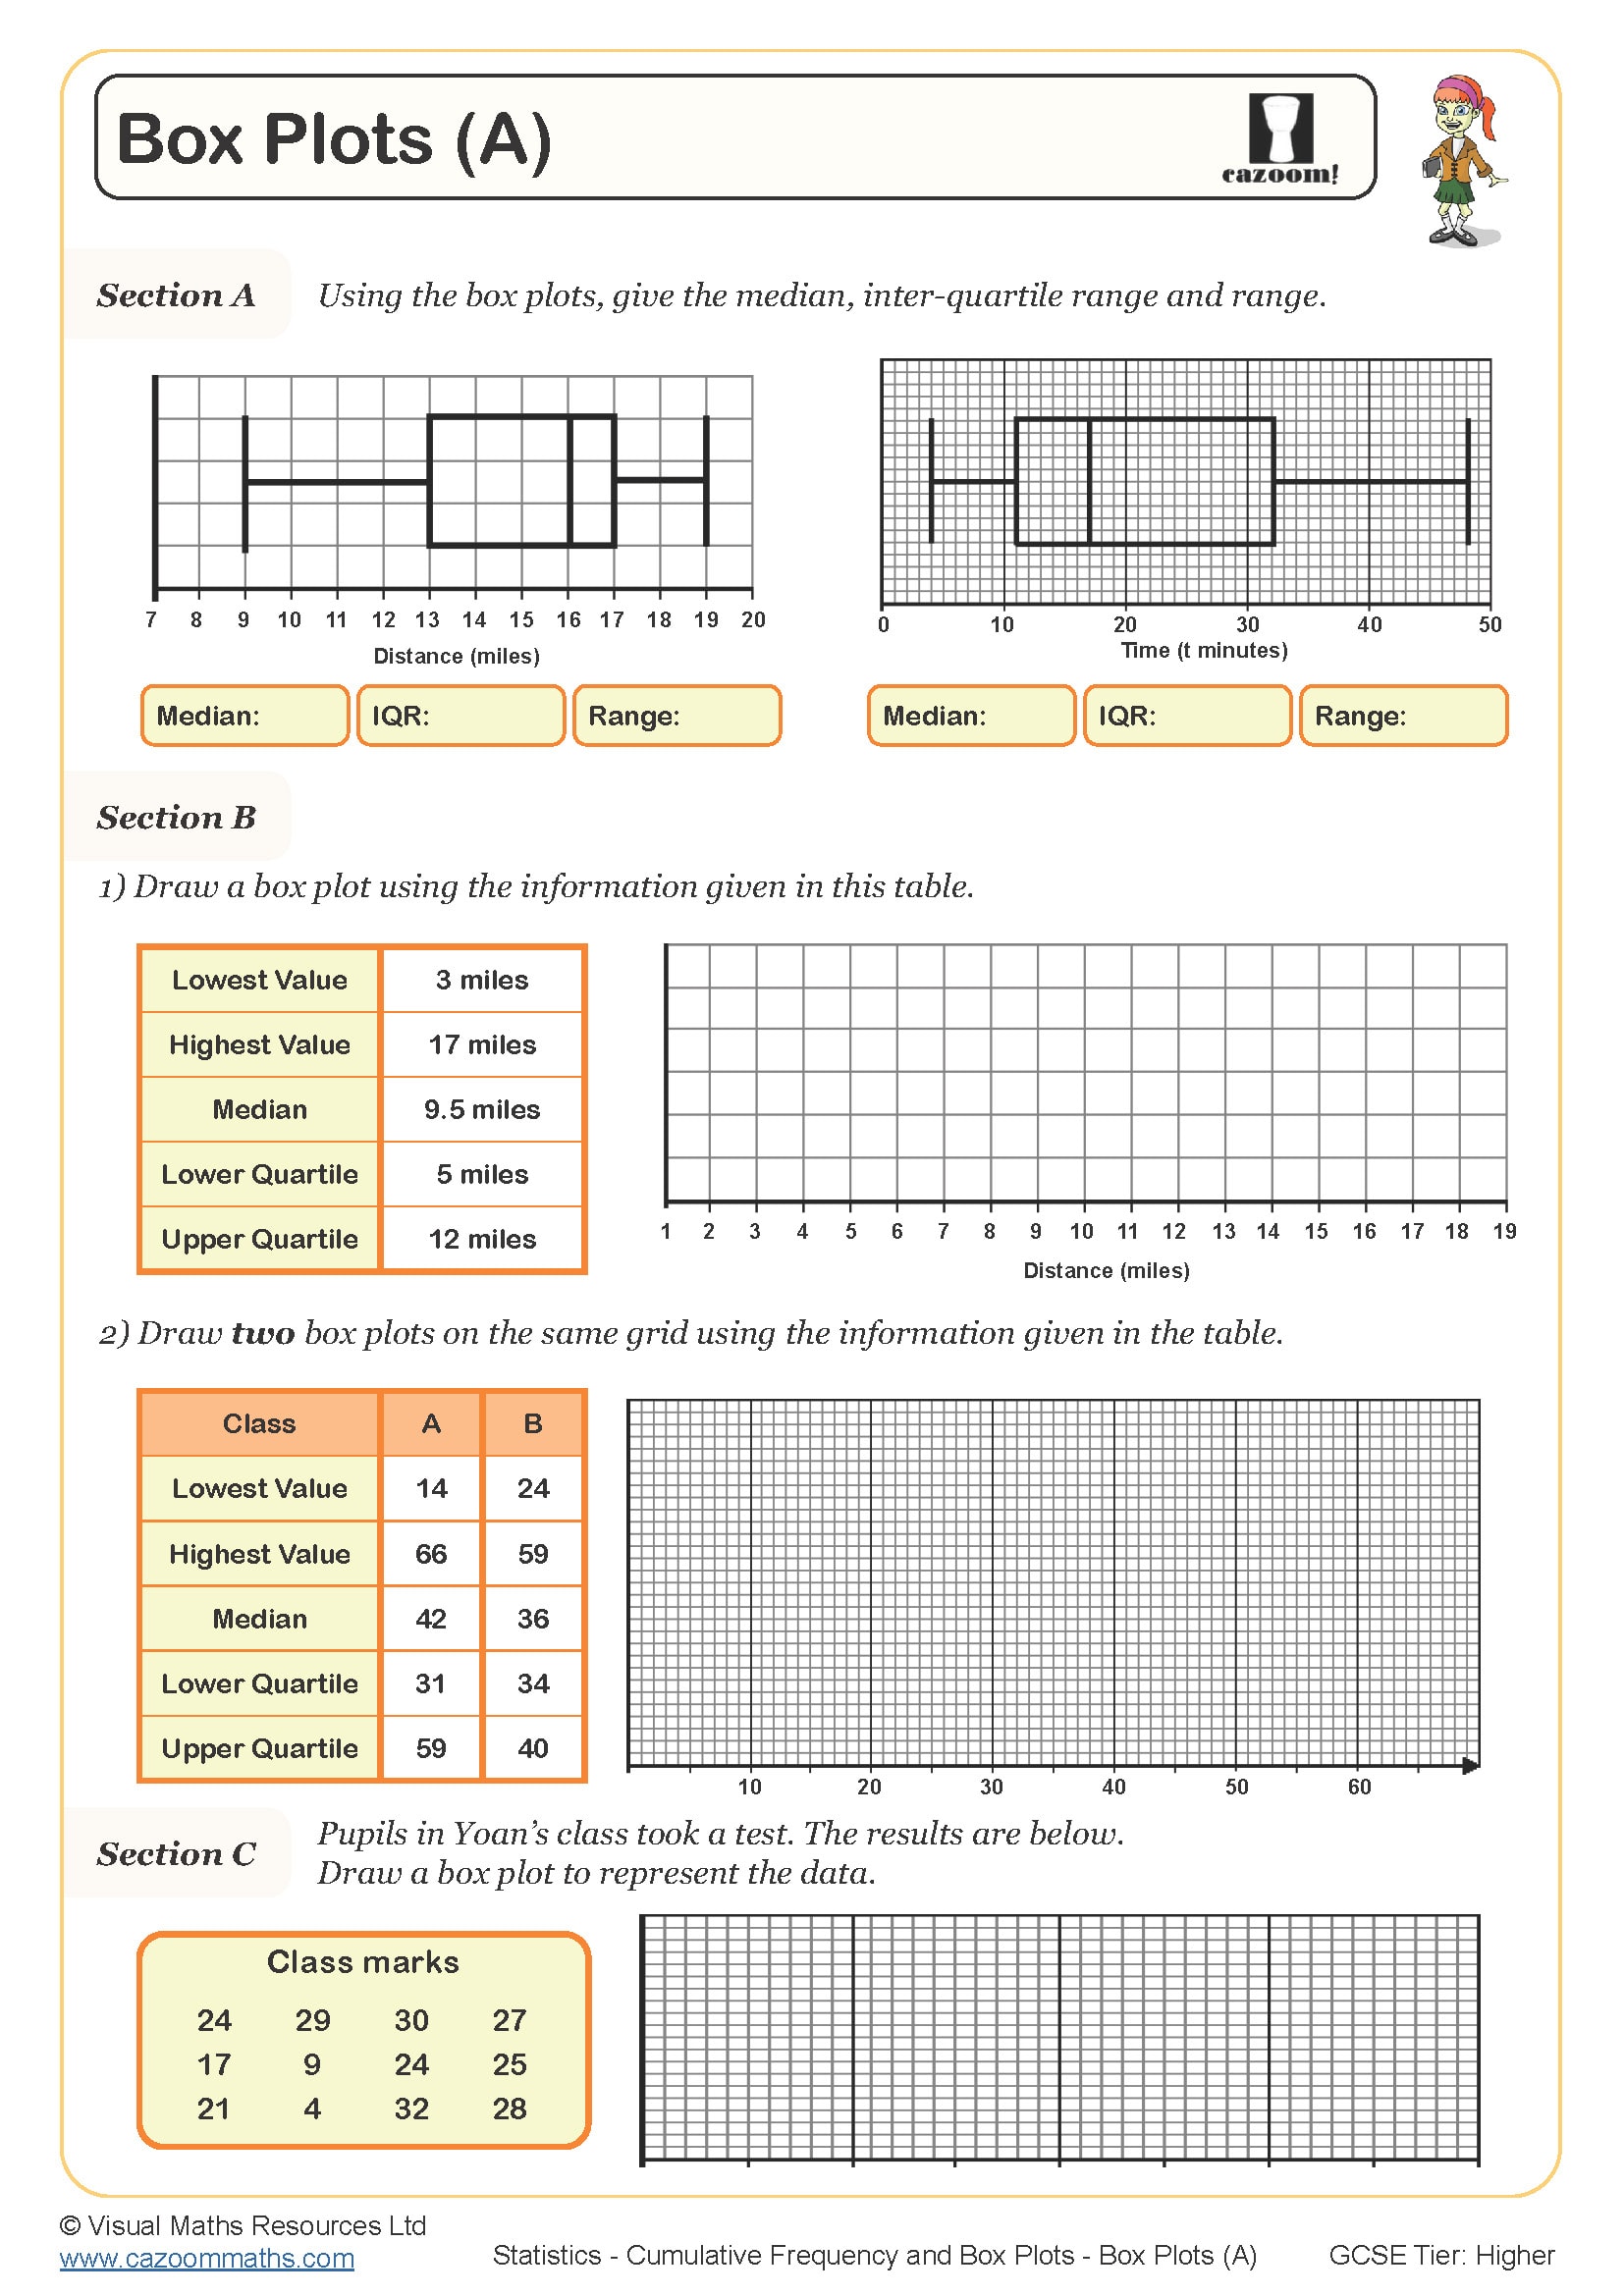
Box Plots (A)
Year groups: 9, 10
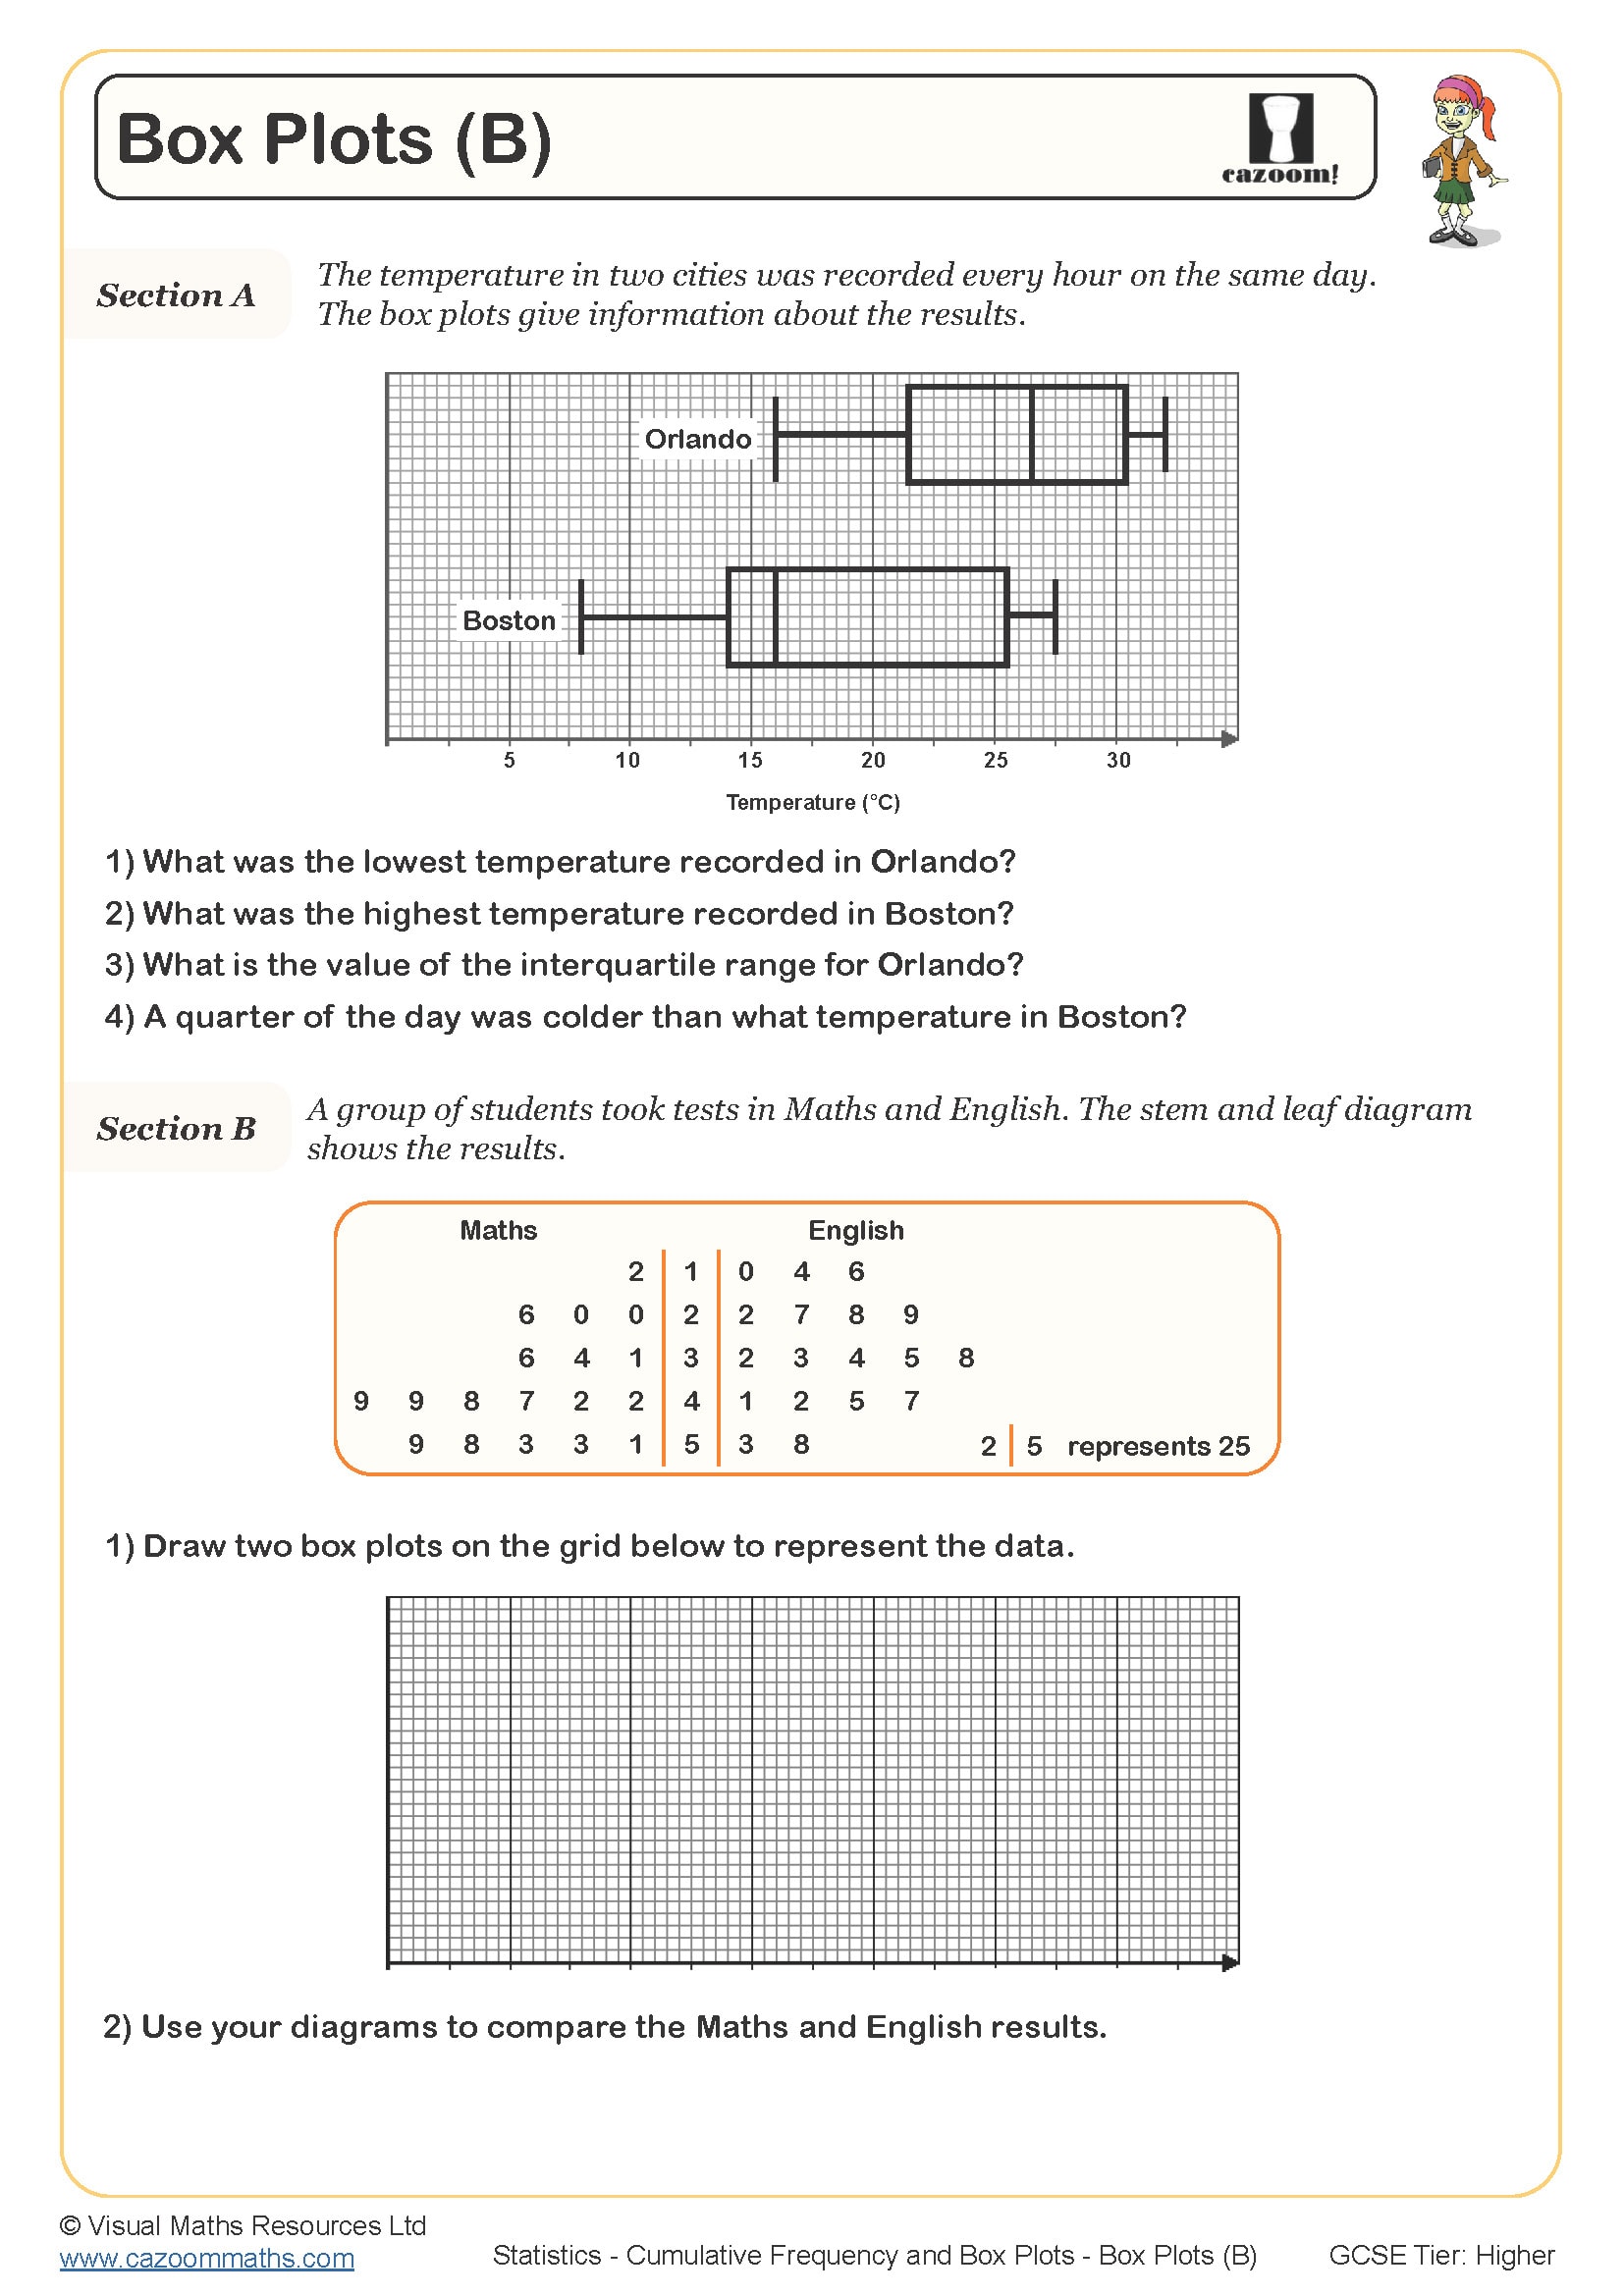
Box Plots (B)
Year groups: 9, 10
Capture Recapture
Year groups: 9, 10

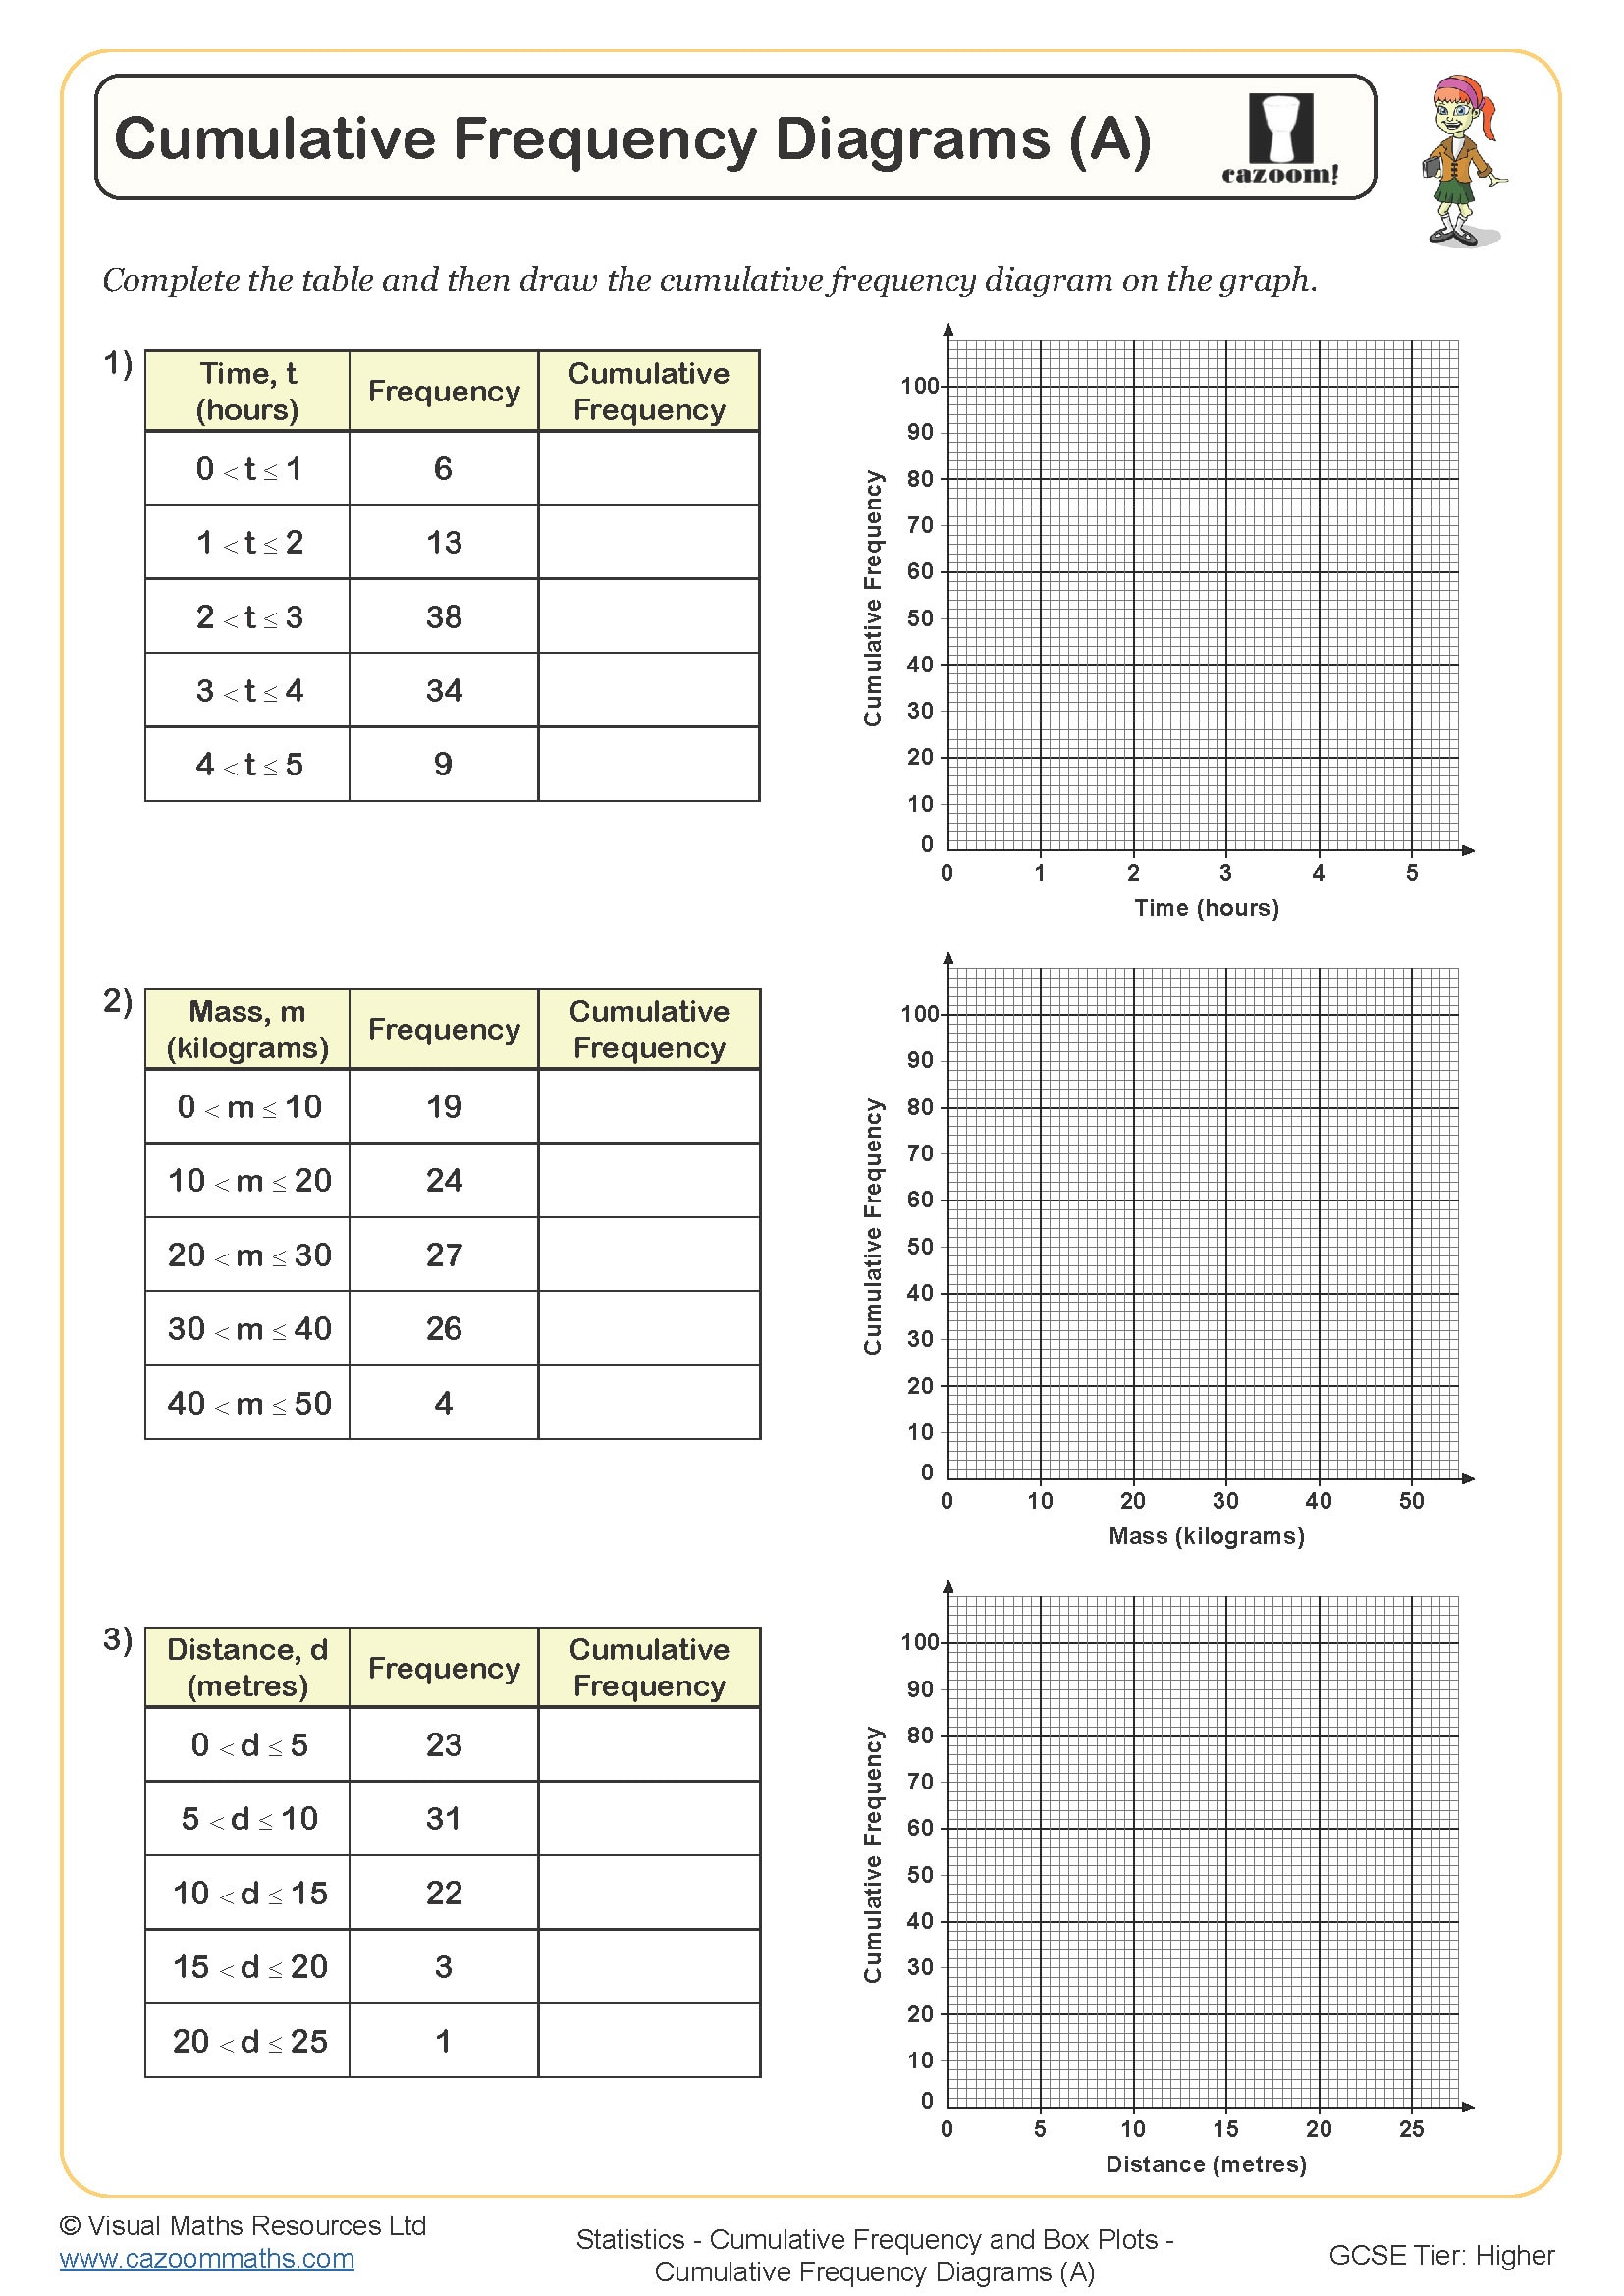
Cumulative Frequency Diagrams (A)
Year groups: 9, 10
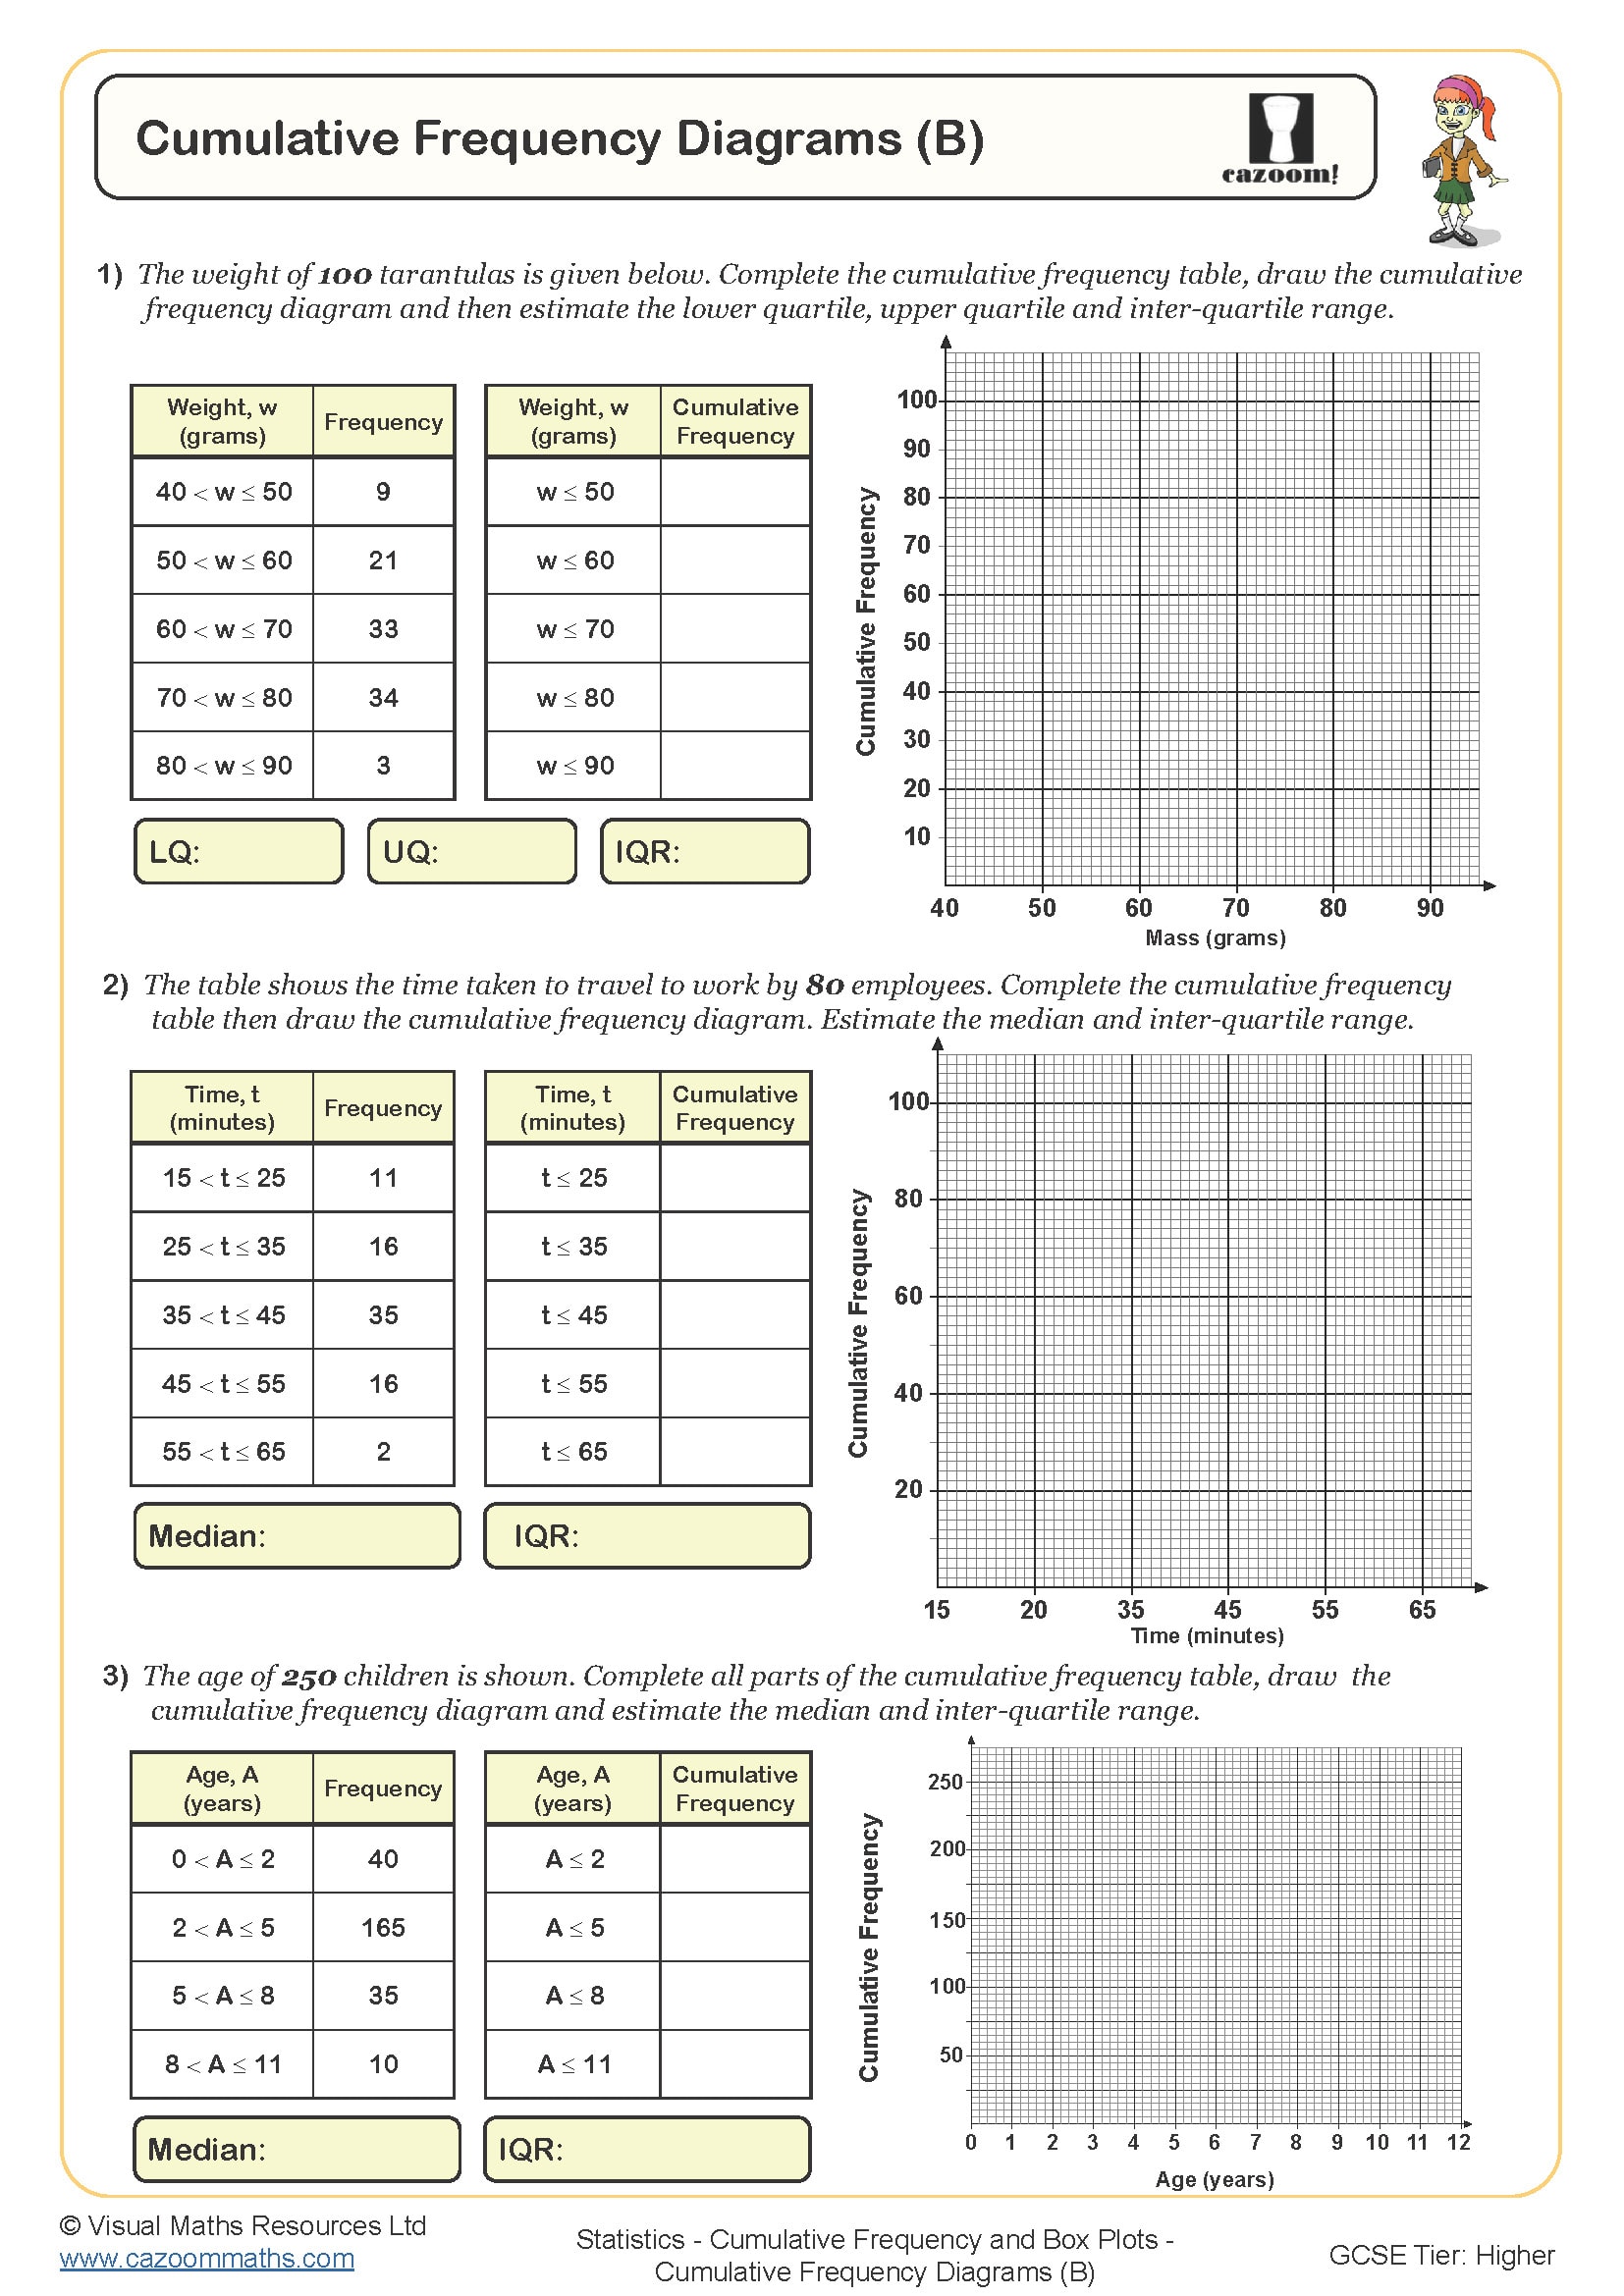
Cumulative Frequency Diagrams (B)
Year groups: 9, 10
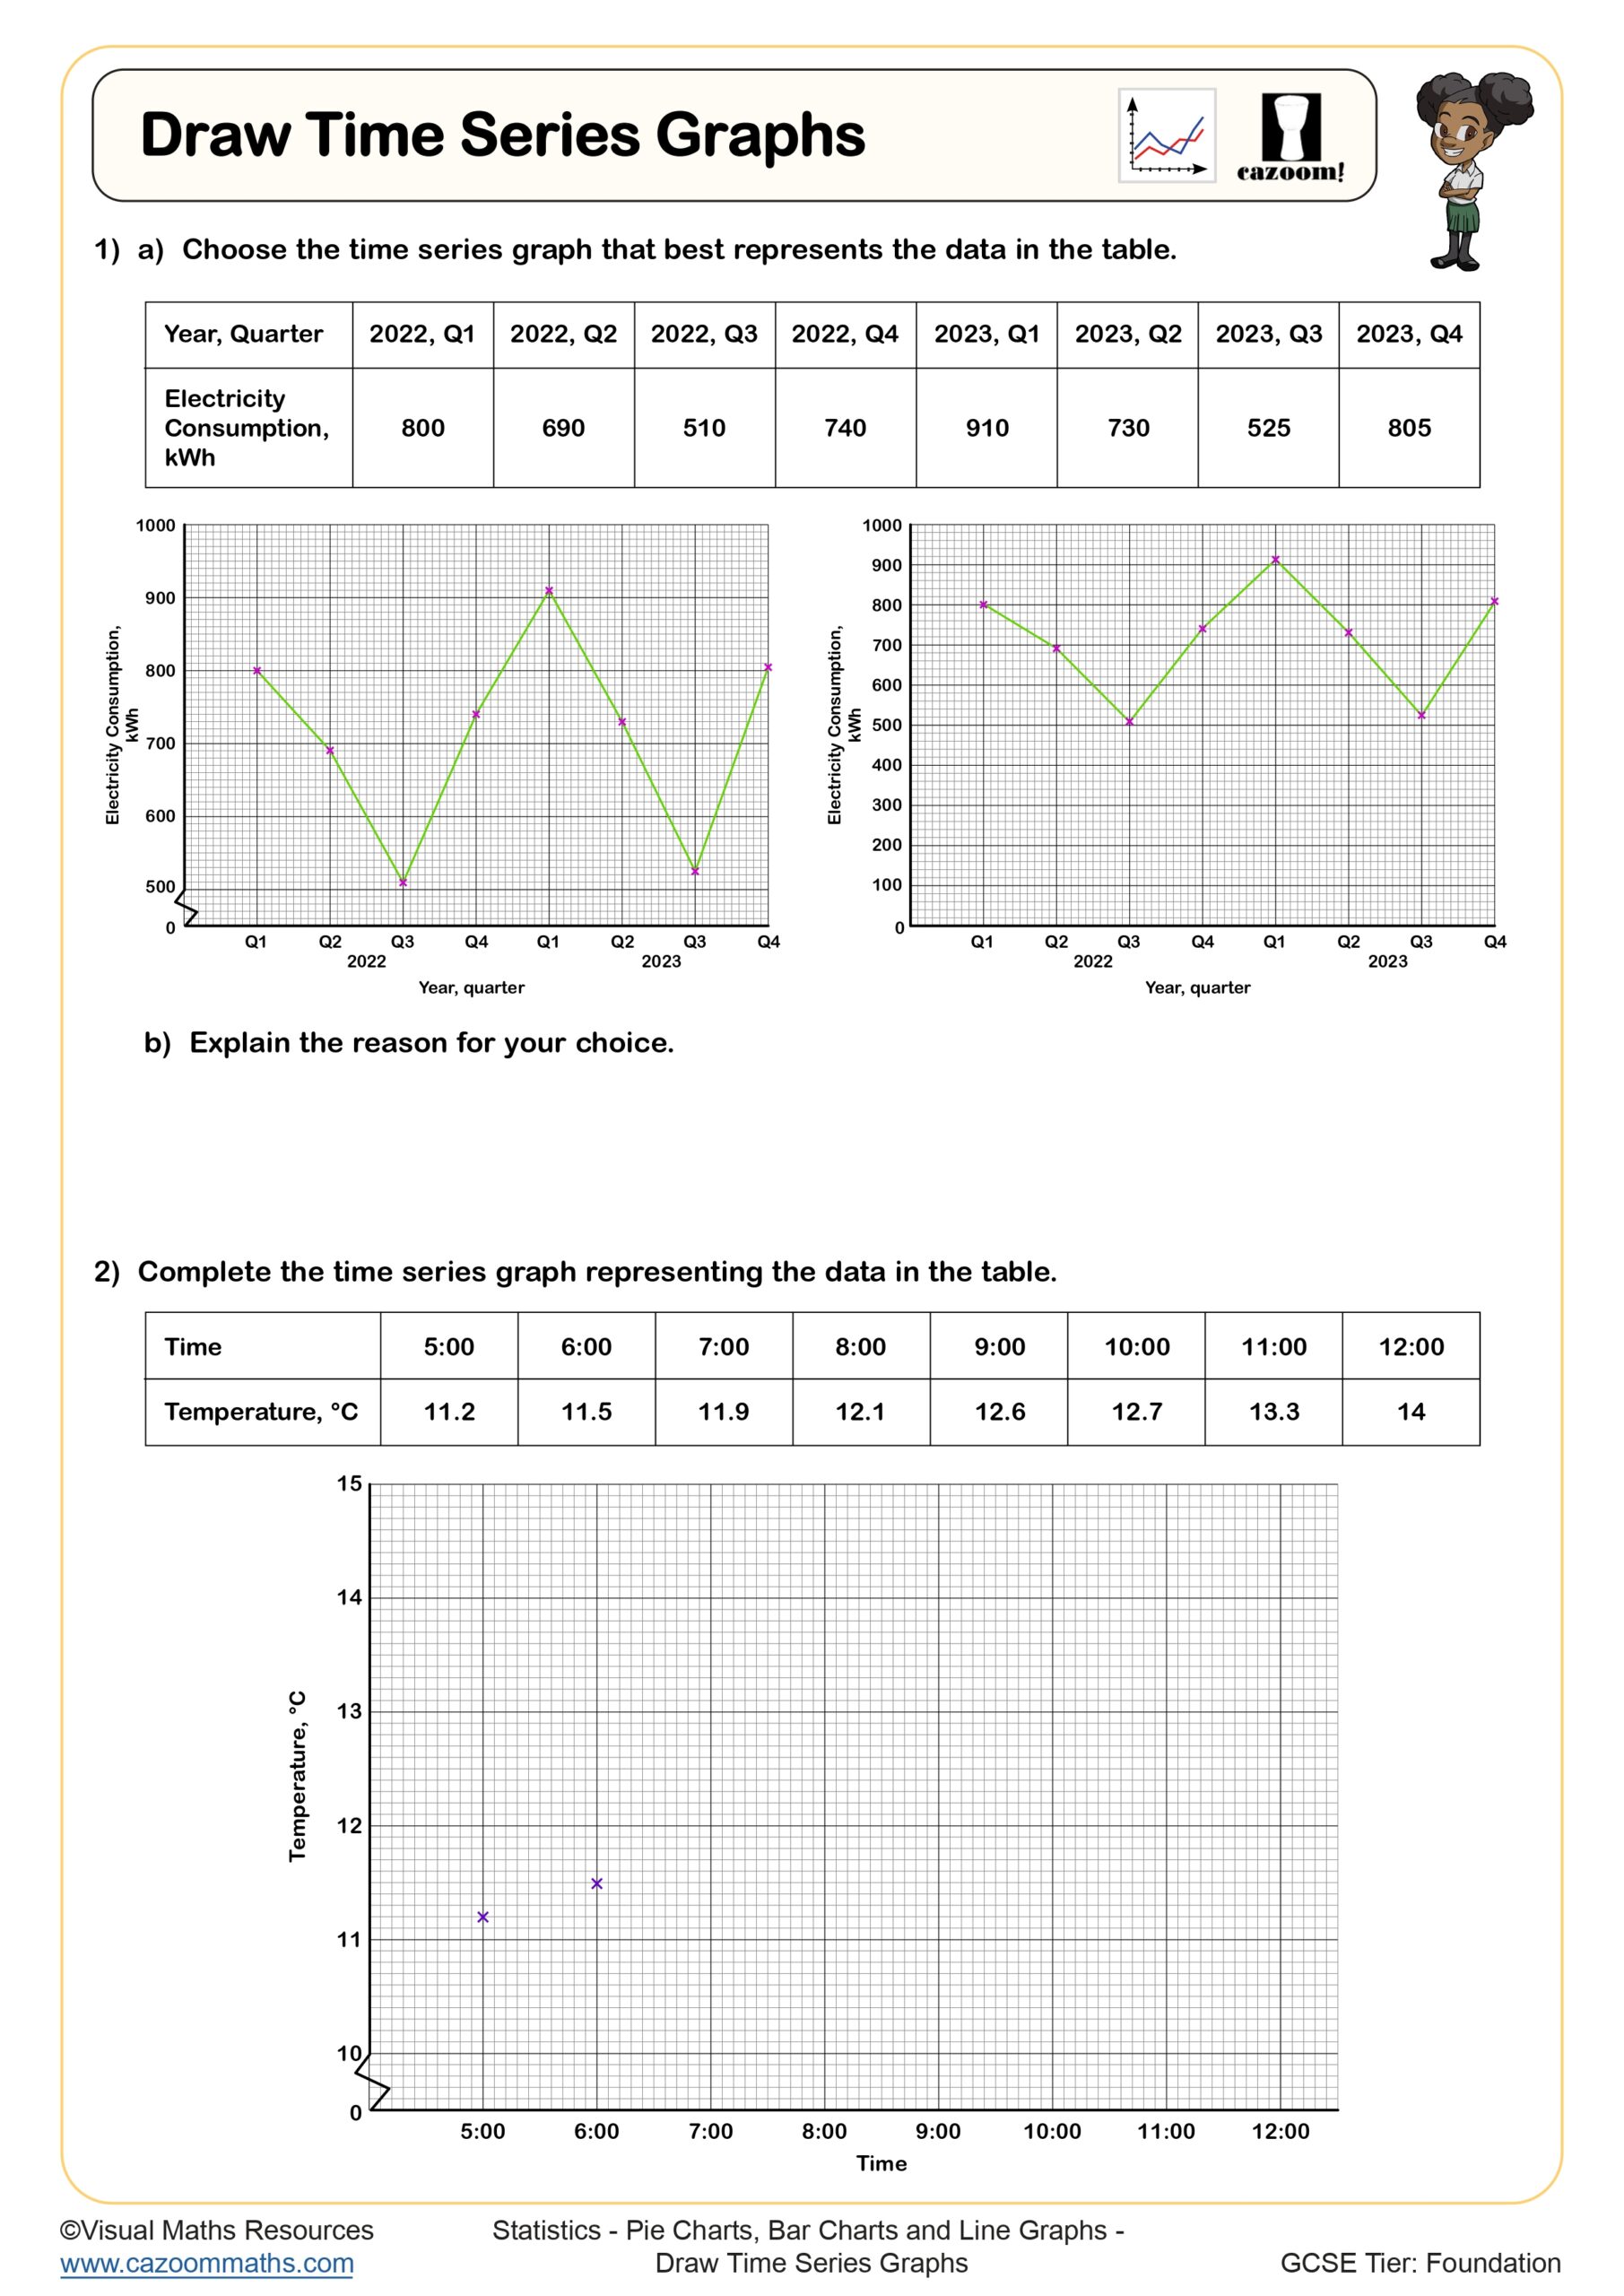
Draw Time Series Graphs
Year groups: 9, 10
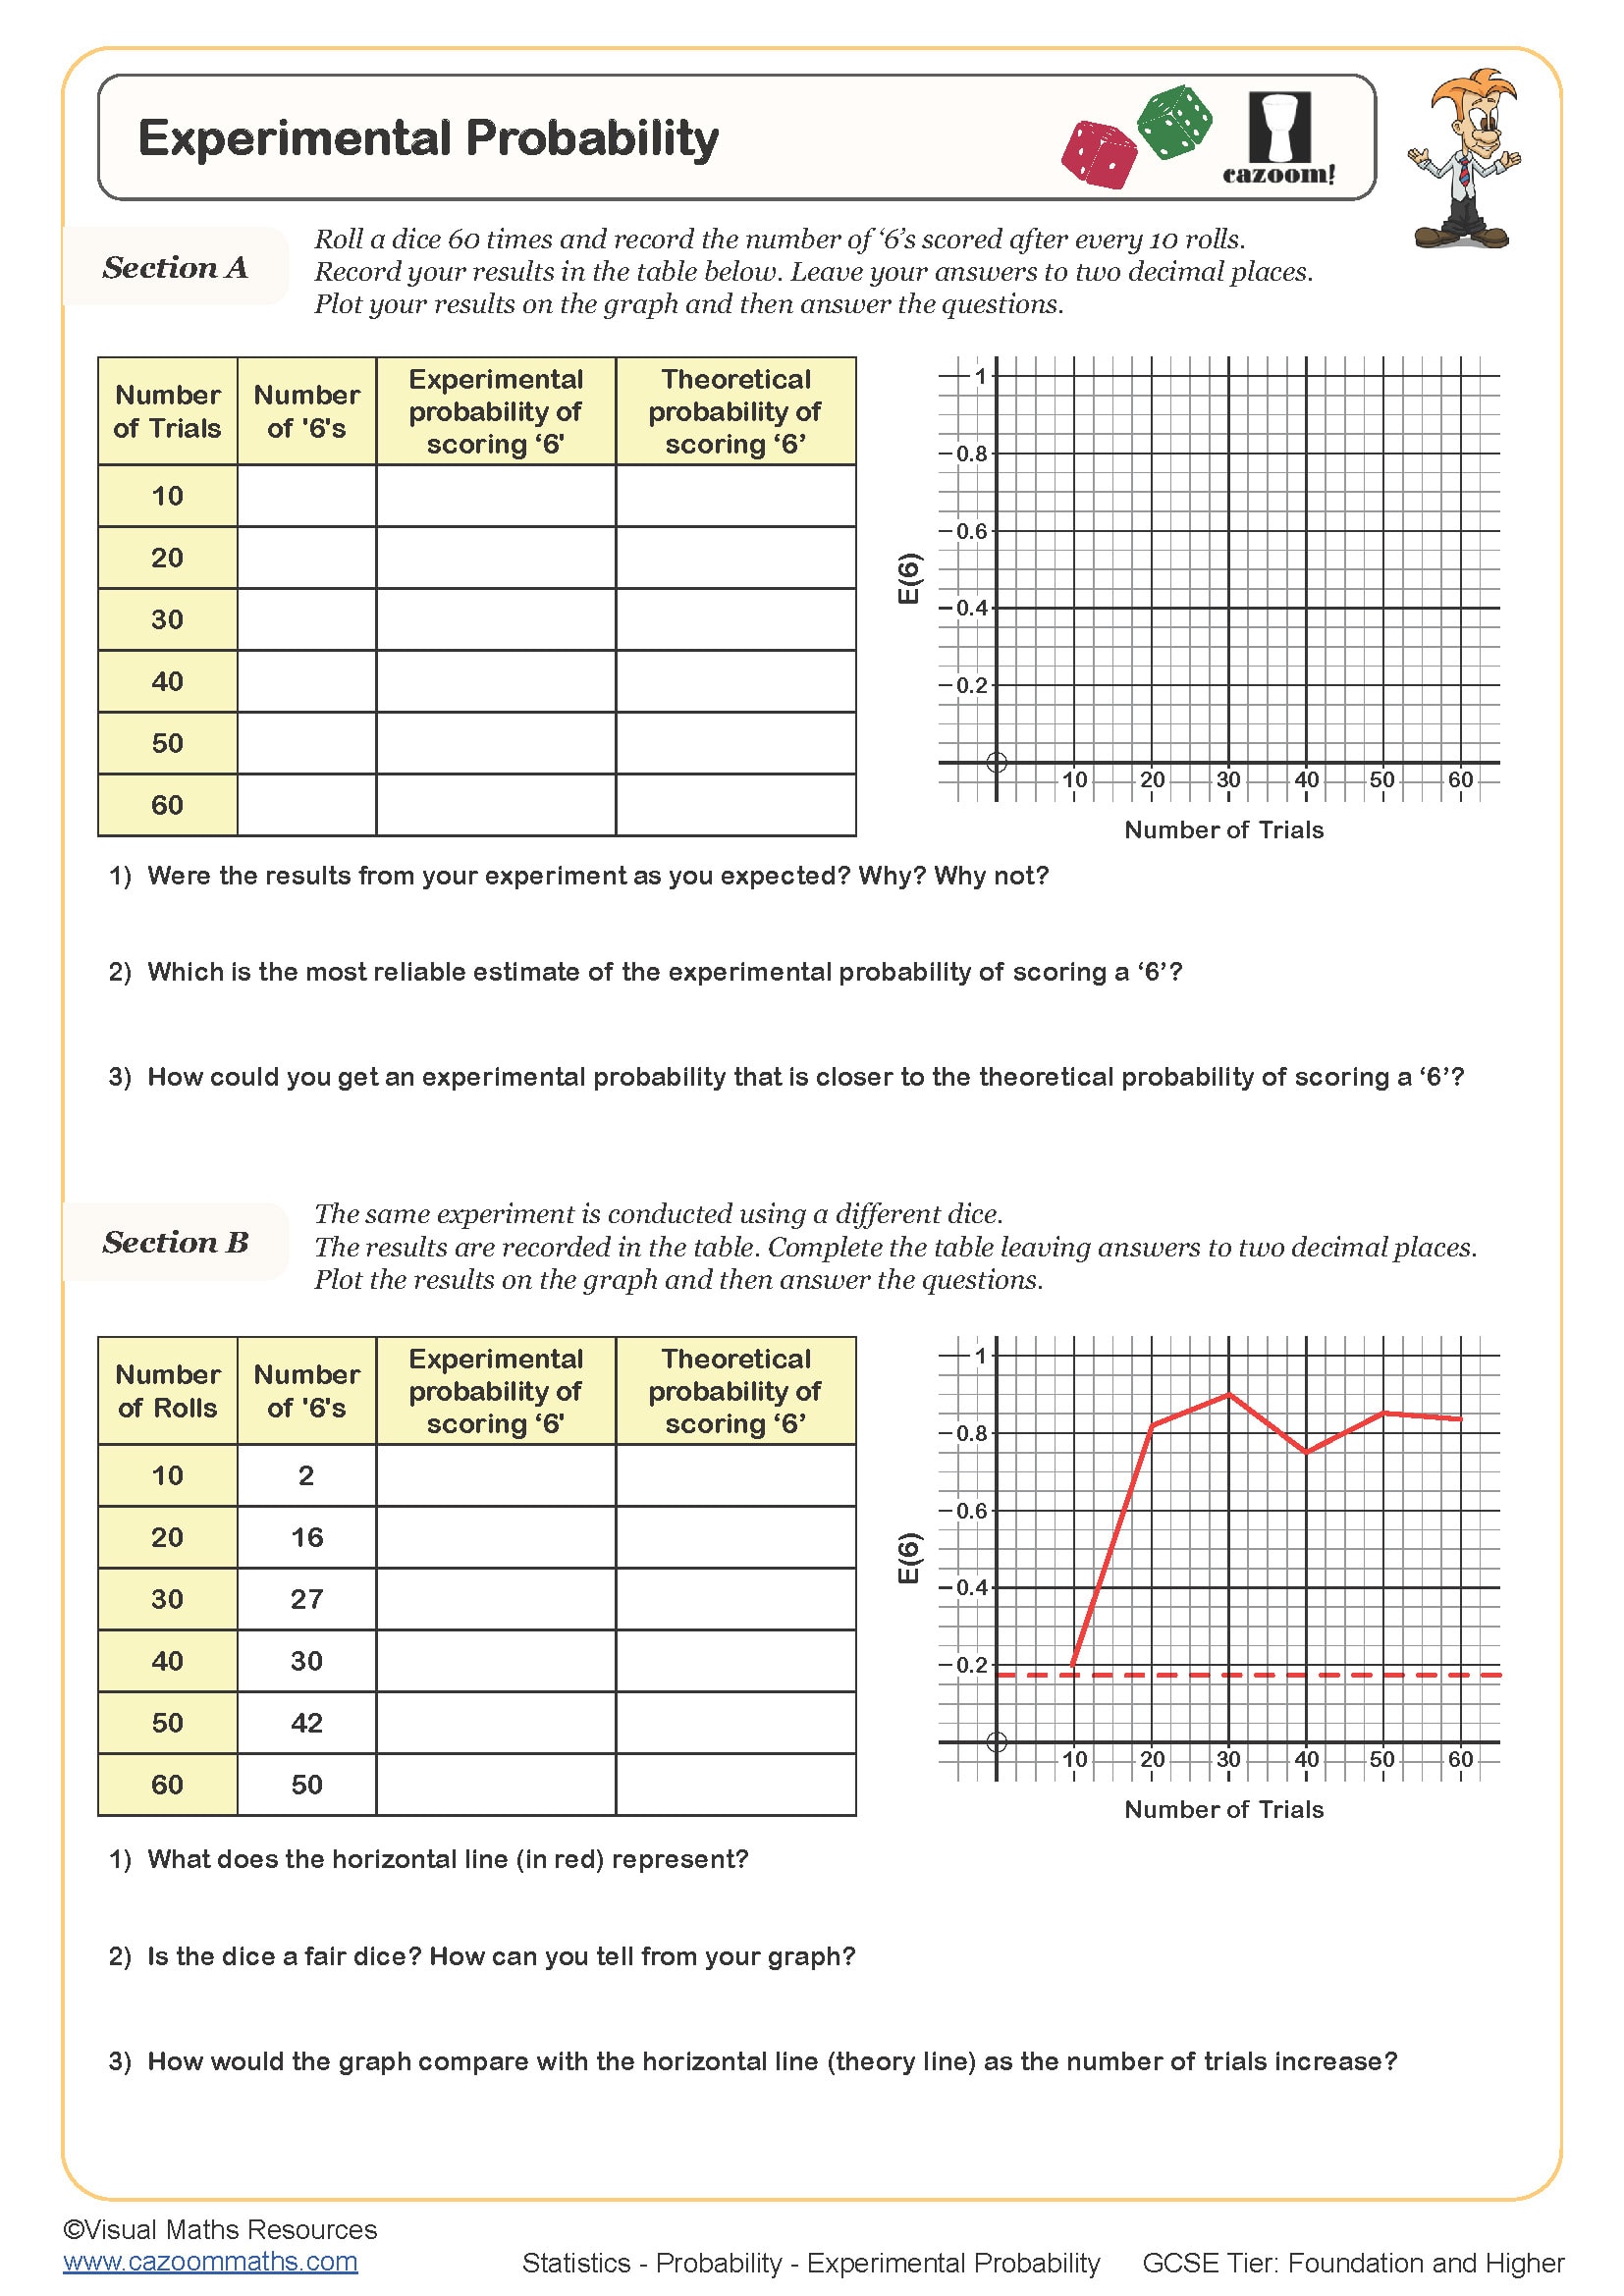
Experimental Probability
Year groups: 9, 10, 11
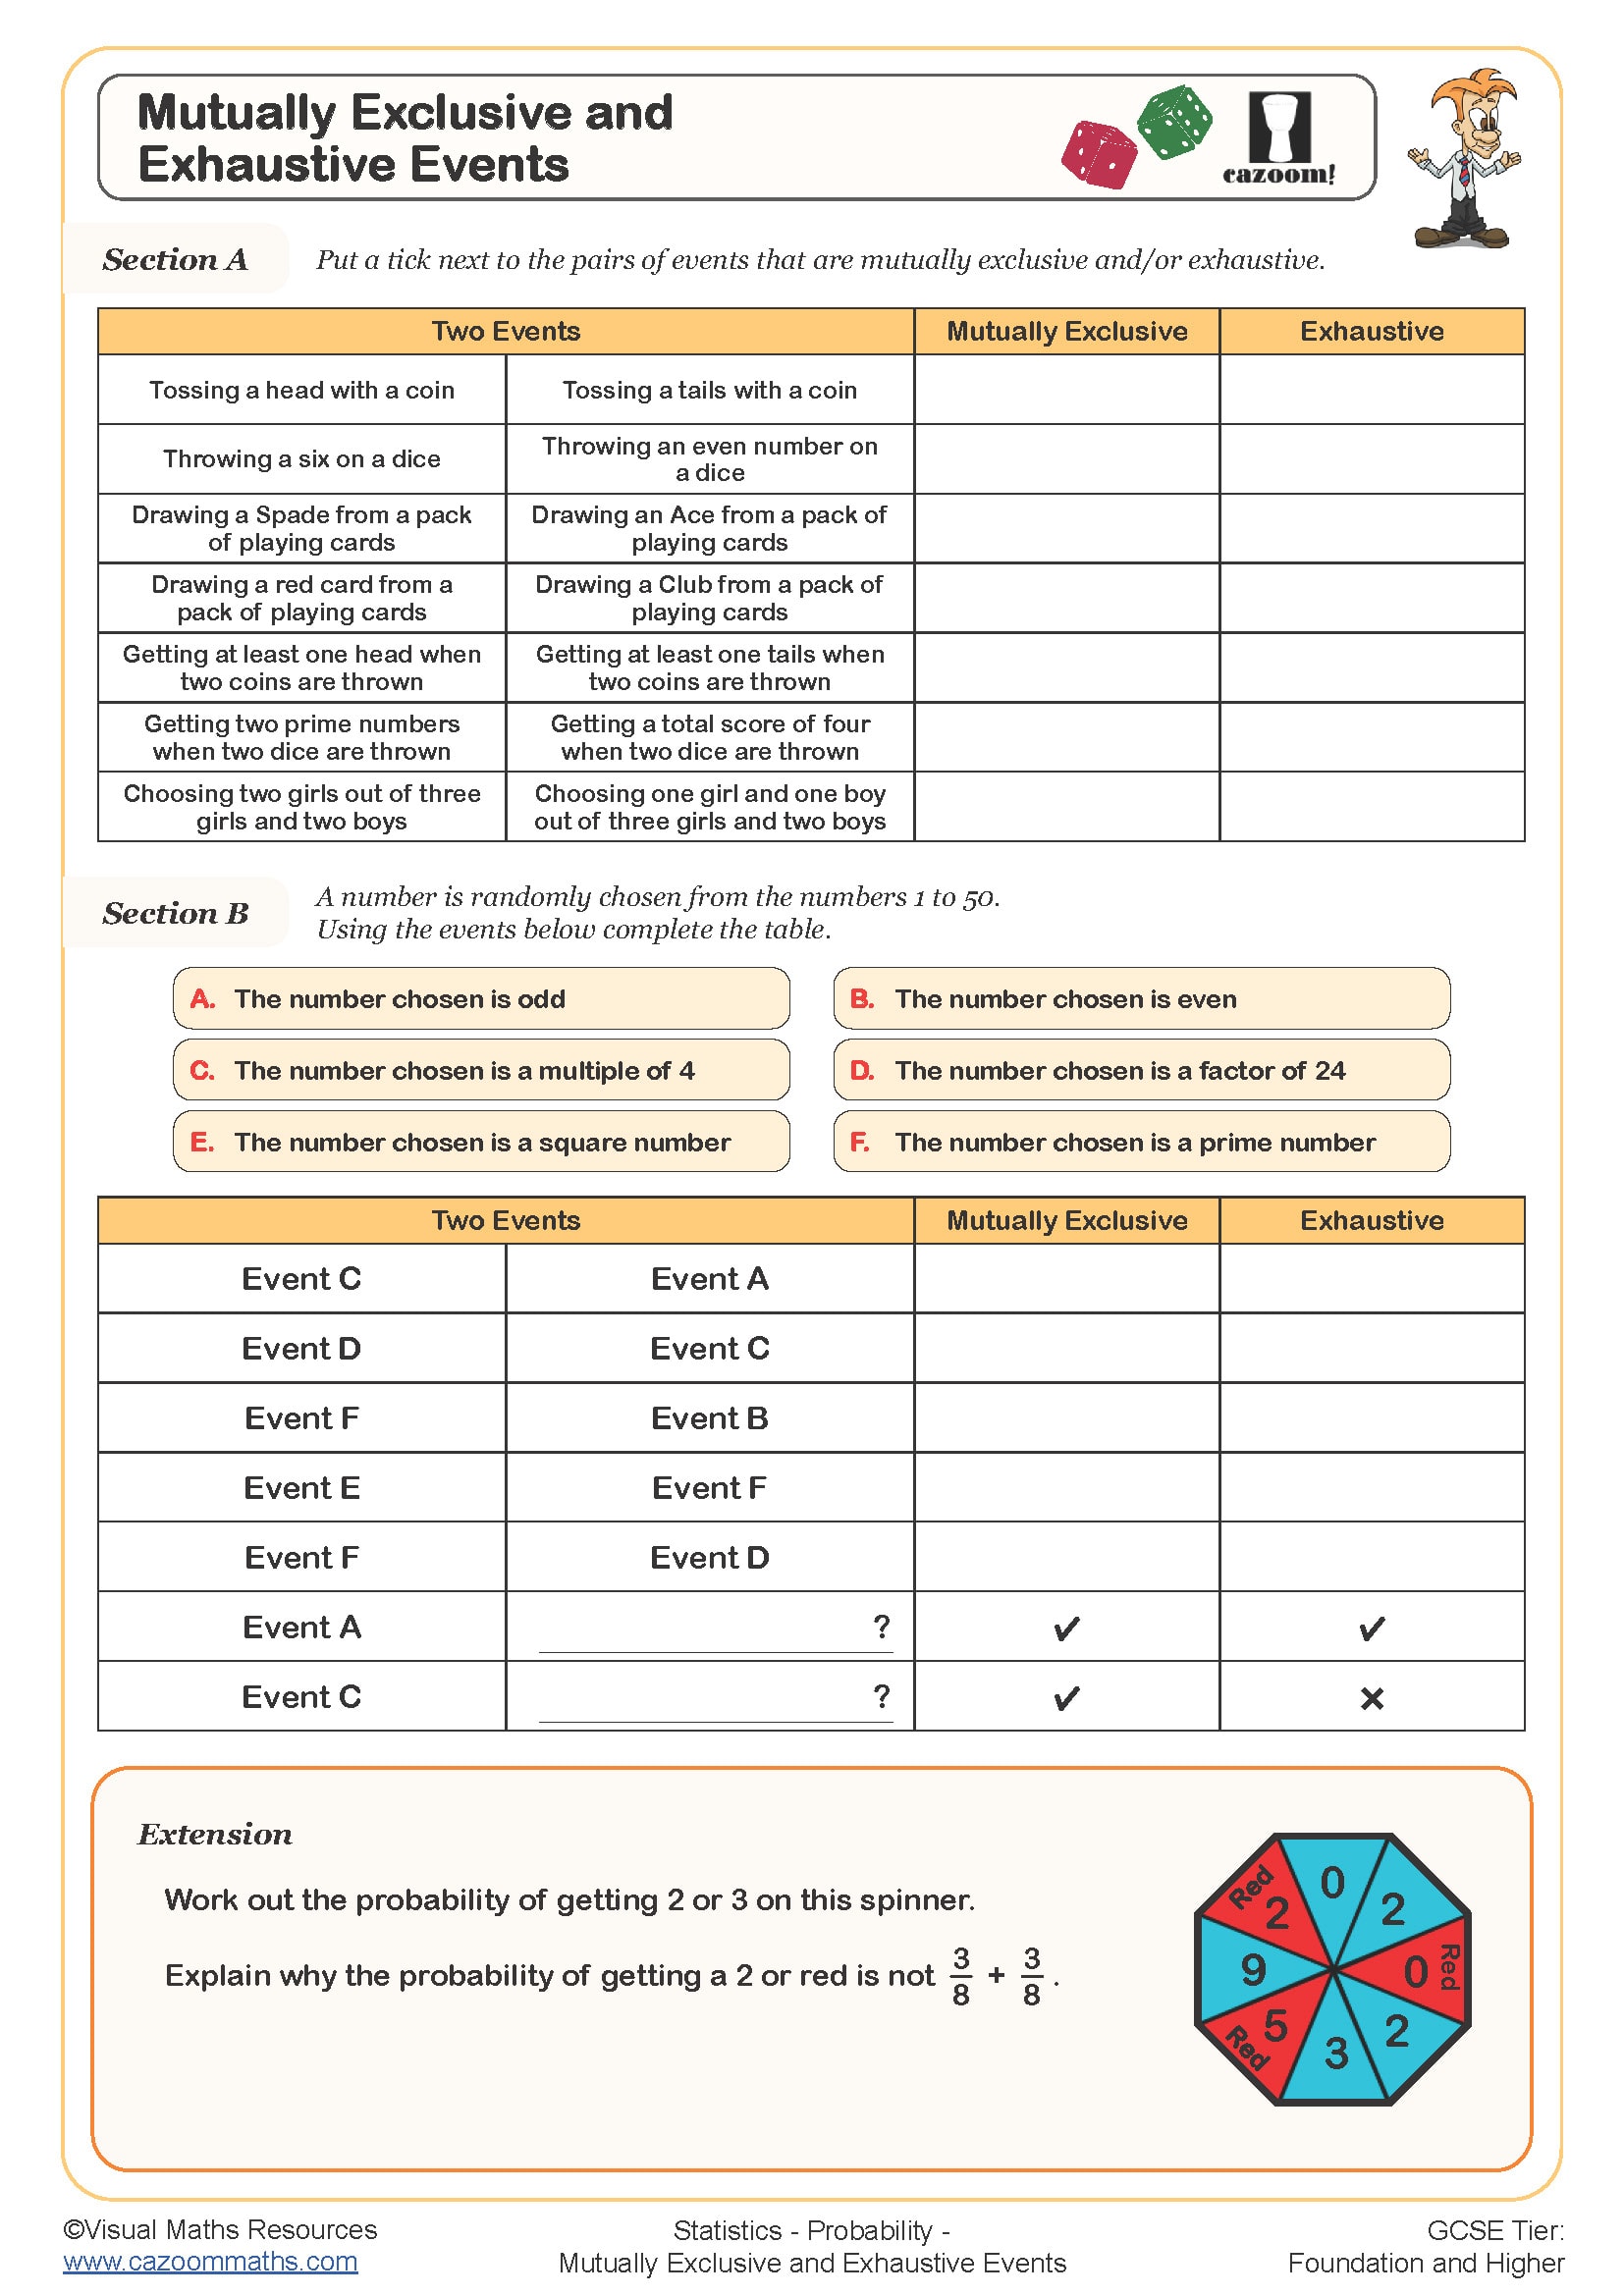
Mutually Exclusive and Exhaustive Events
Year groups: 9, 10, 11
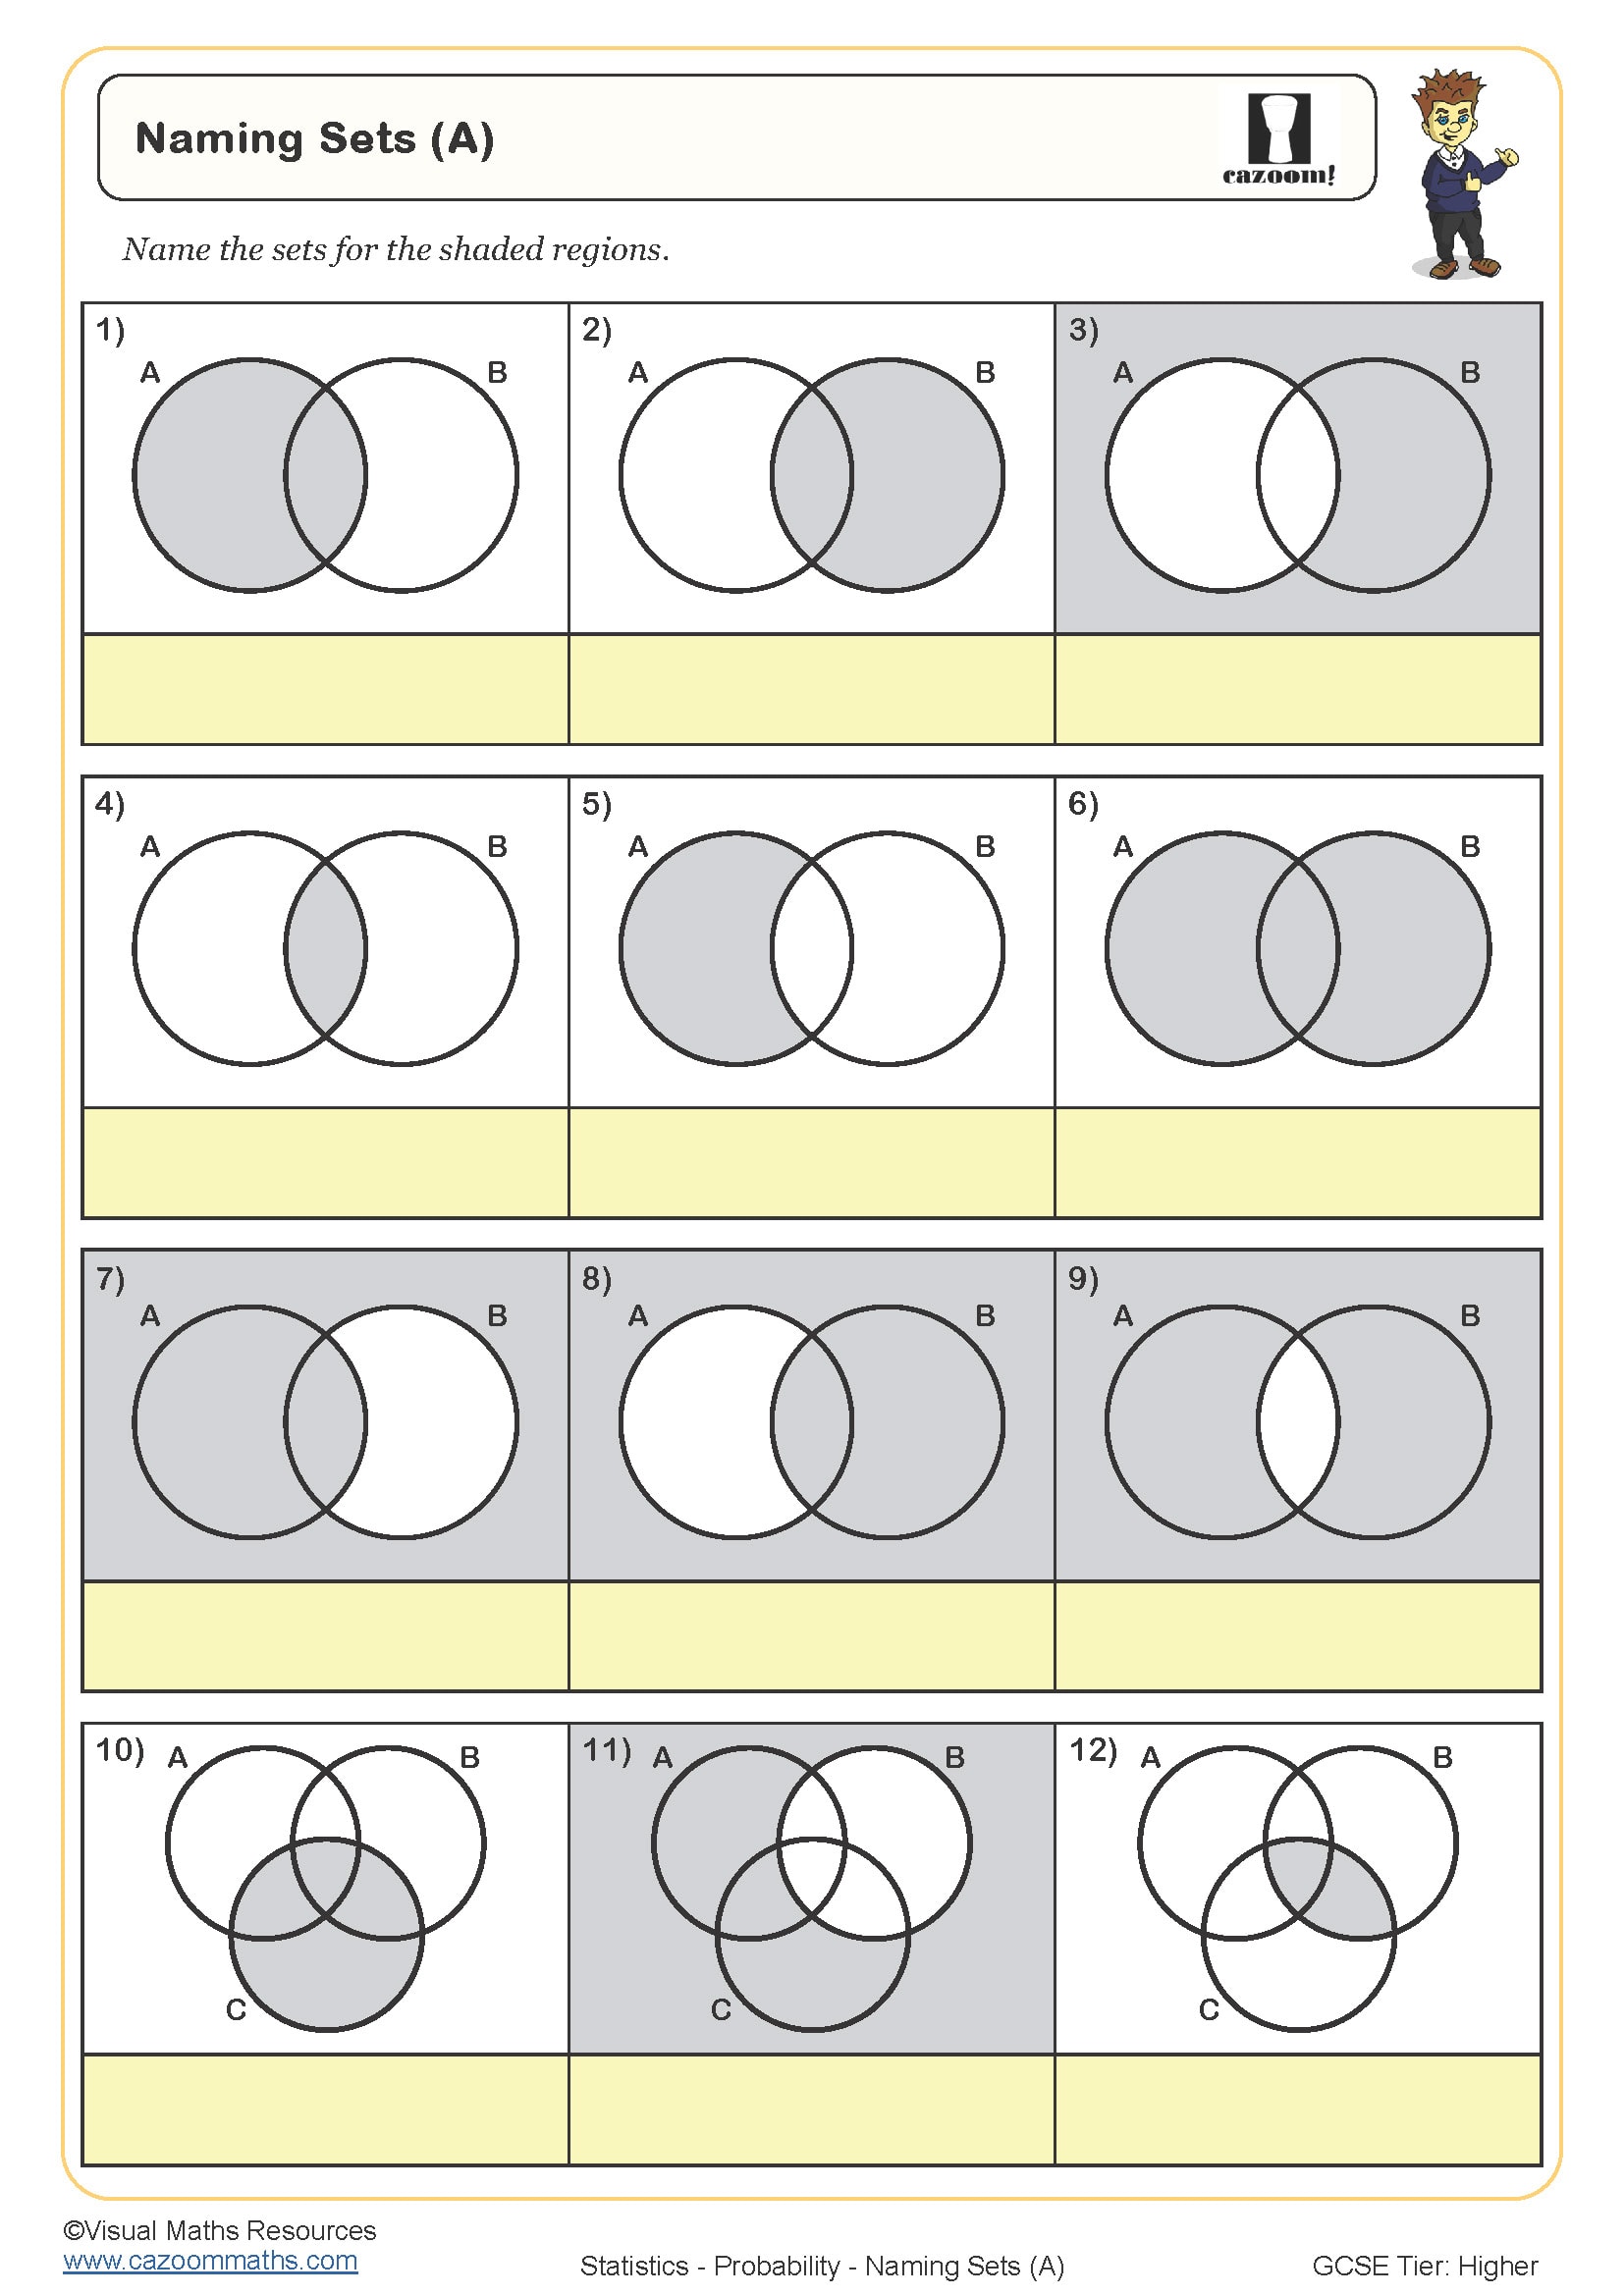
Naming Sets (A)
Year groups: 9, 10
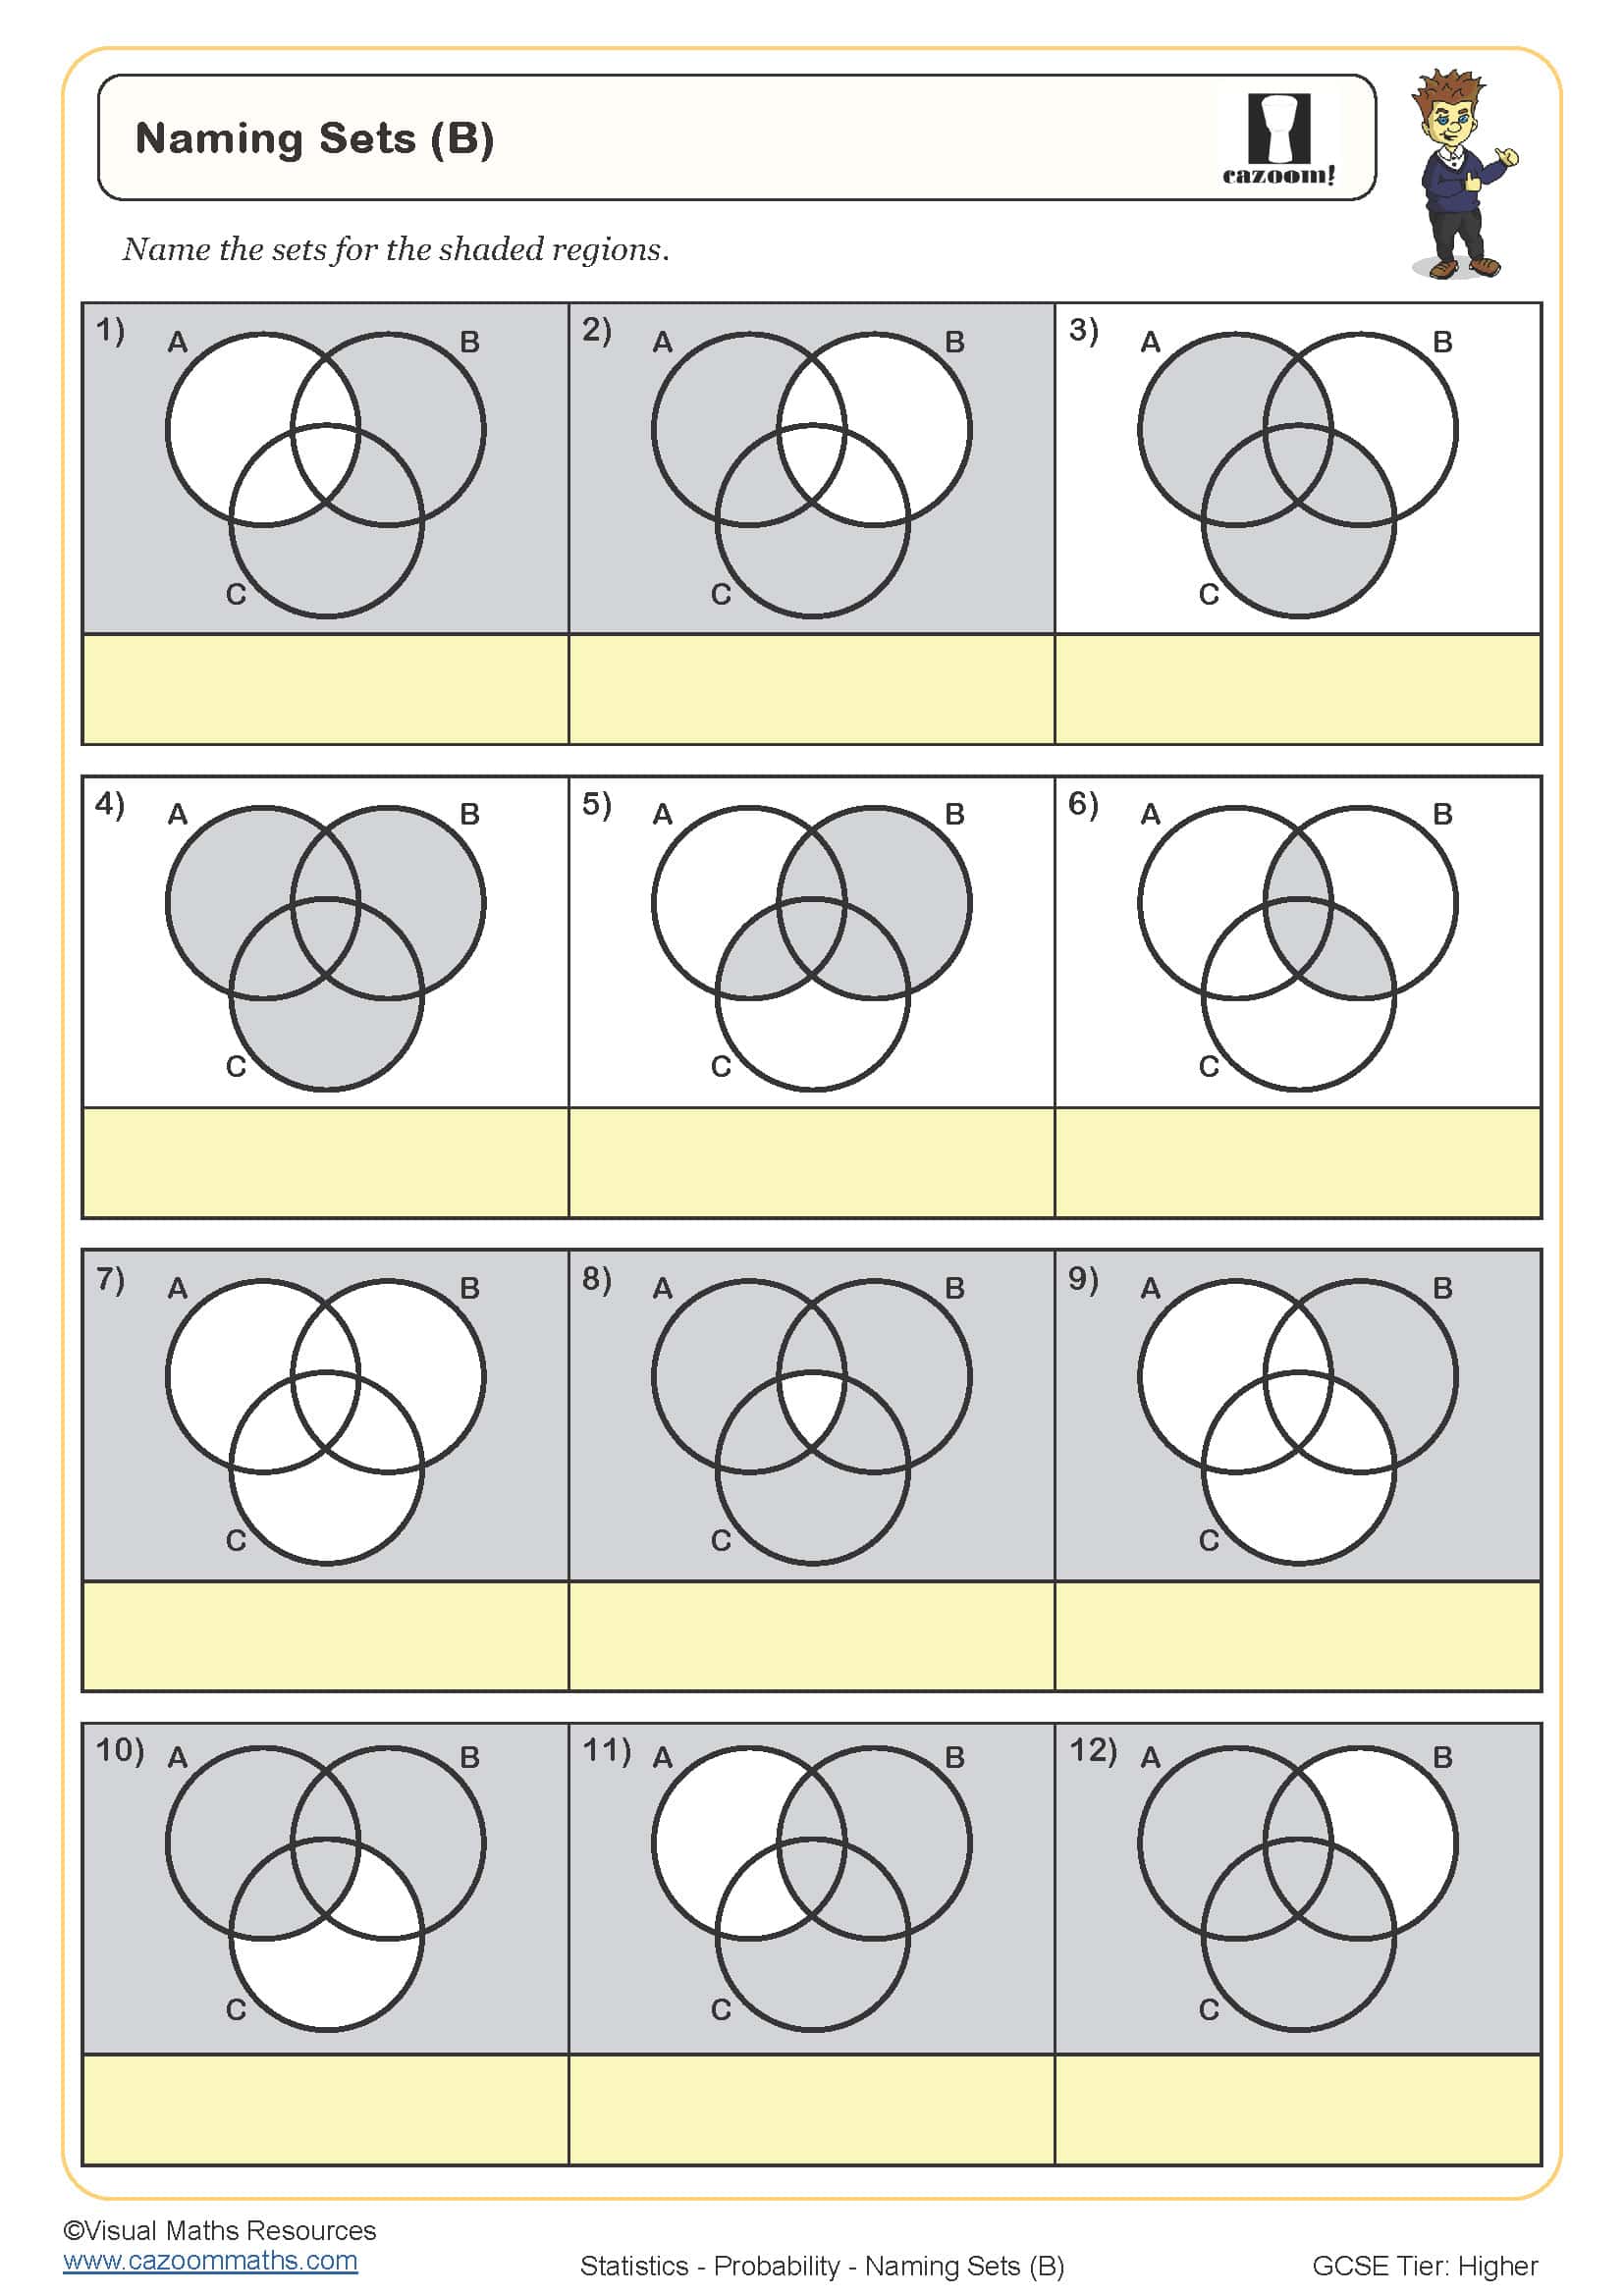
Naming Sets (B)
Year groups: 9, 10
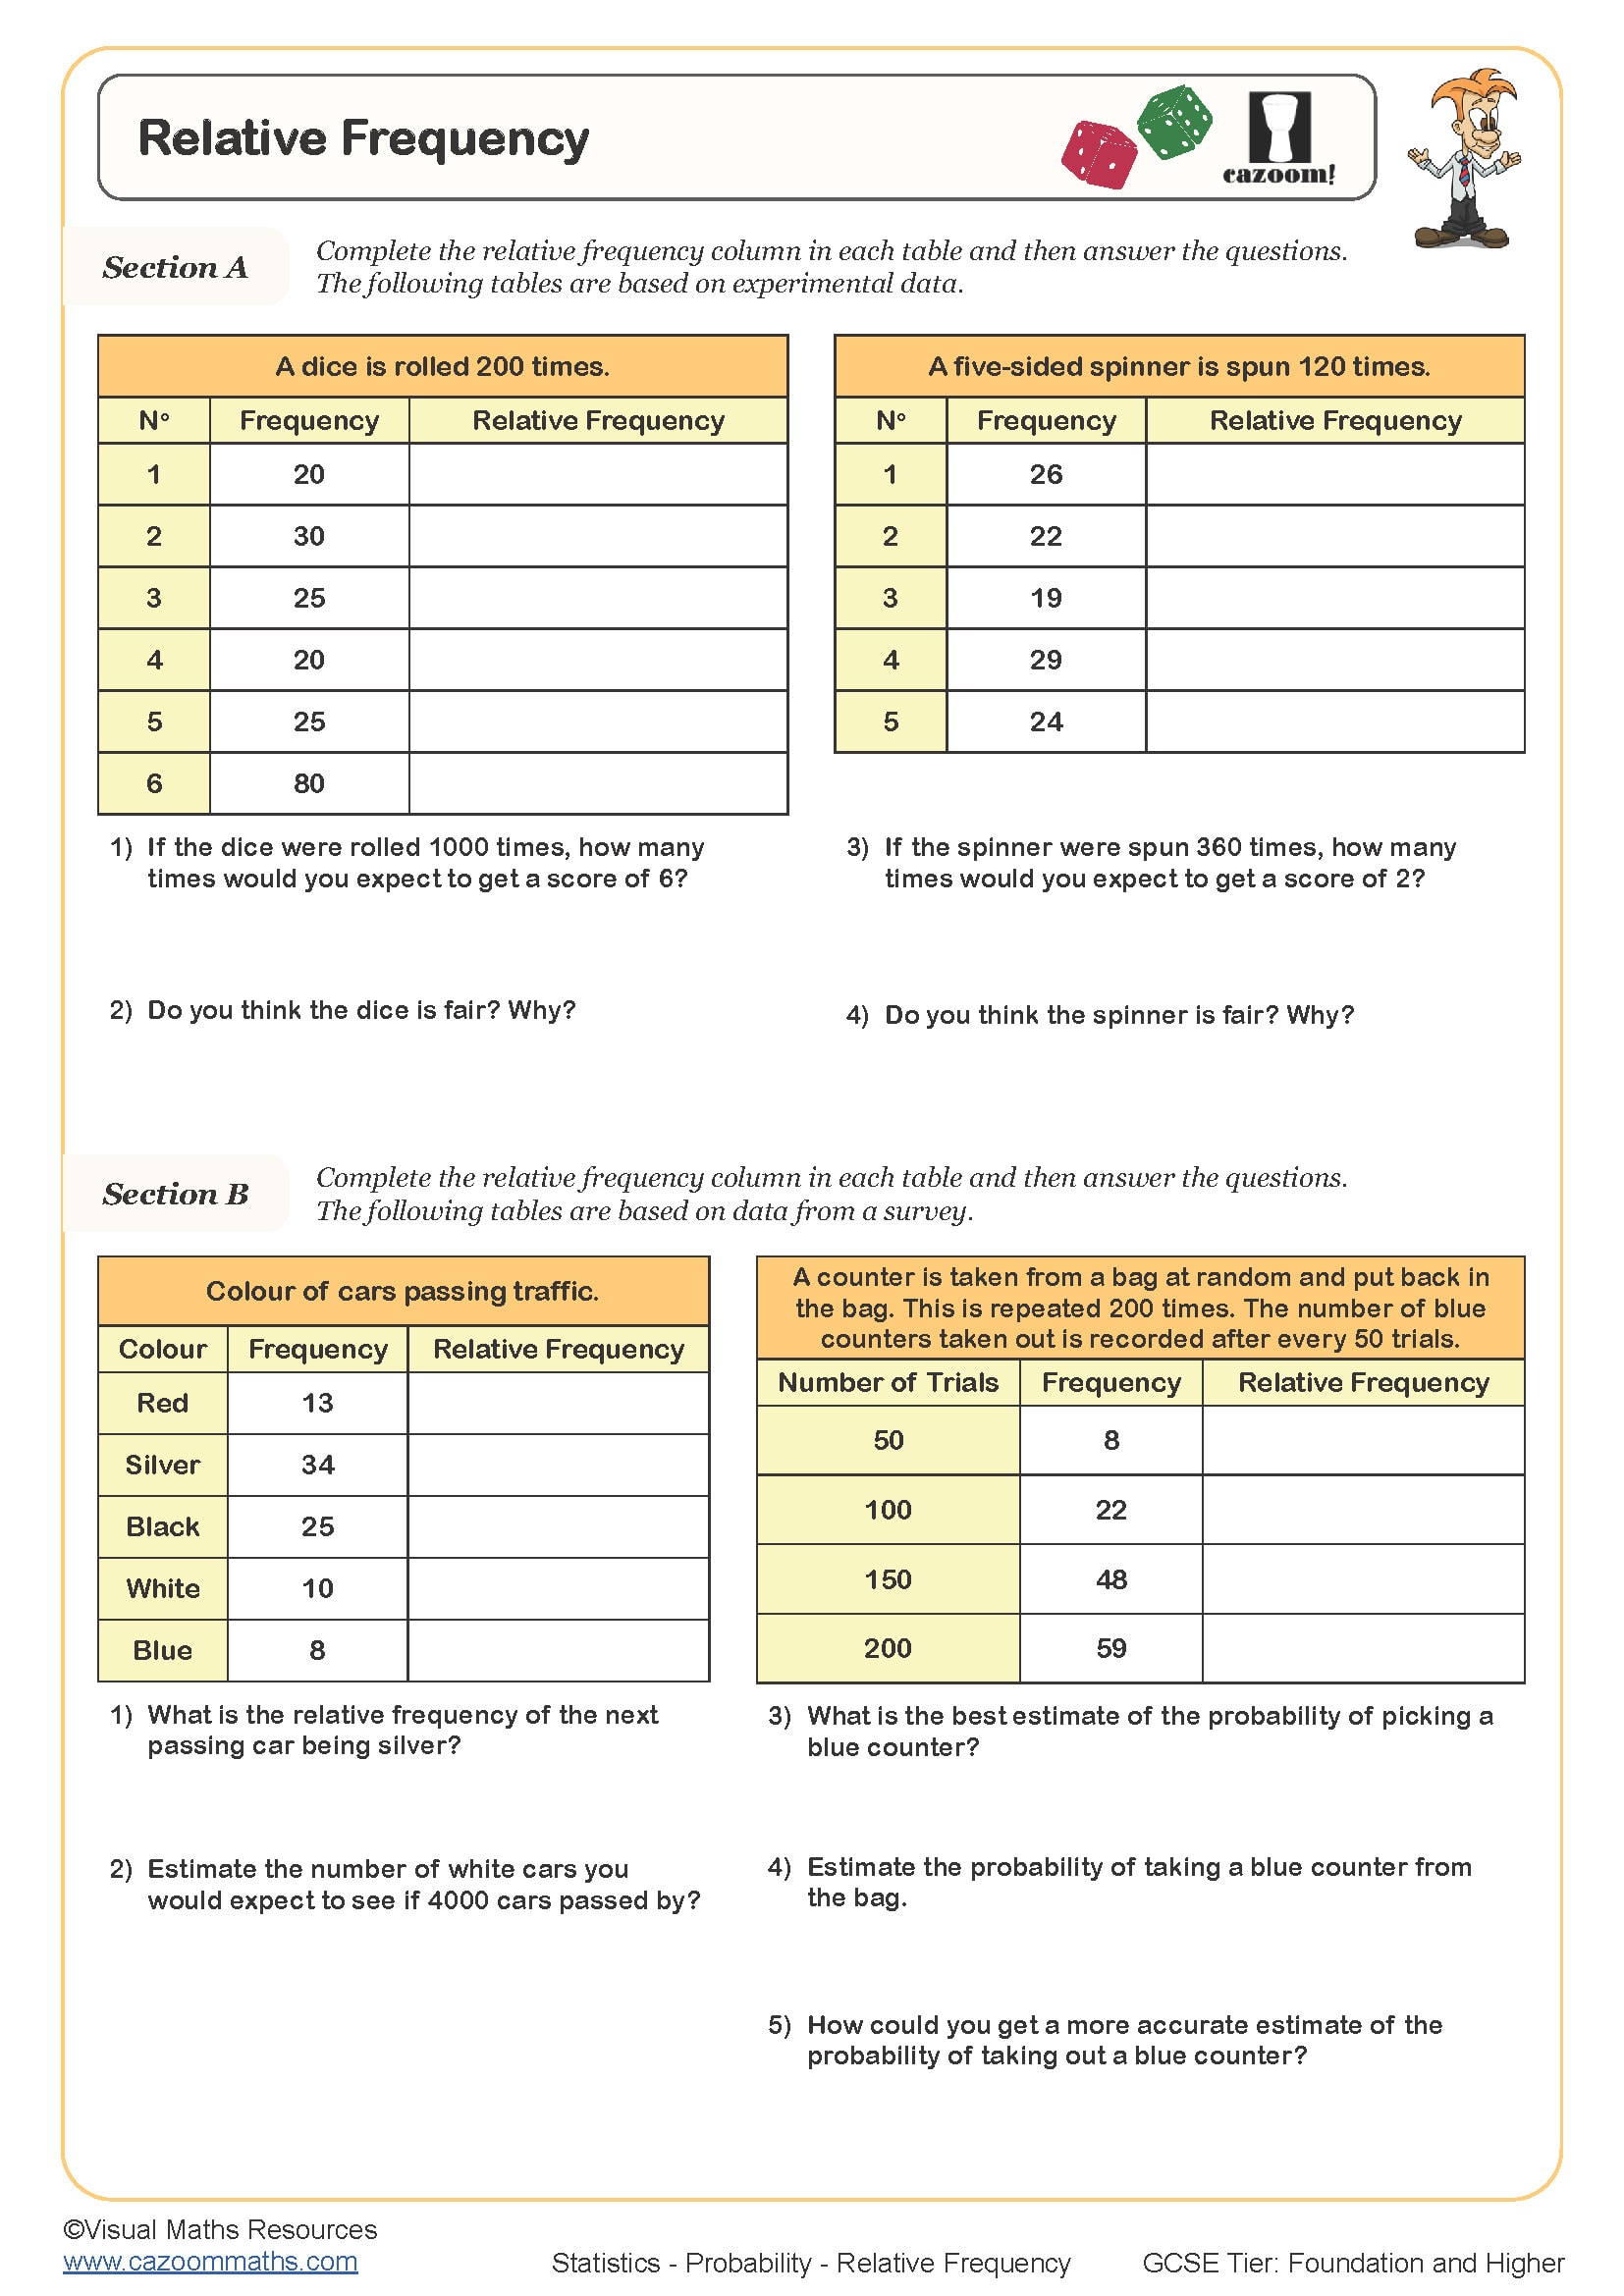
Relative Frequency
Year groups: 9, 10, 11
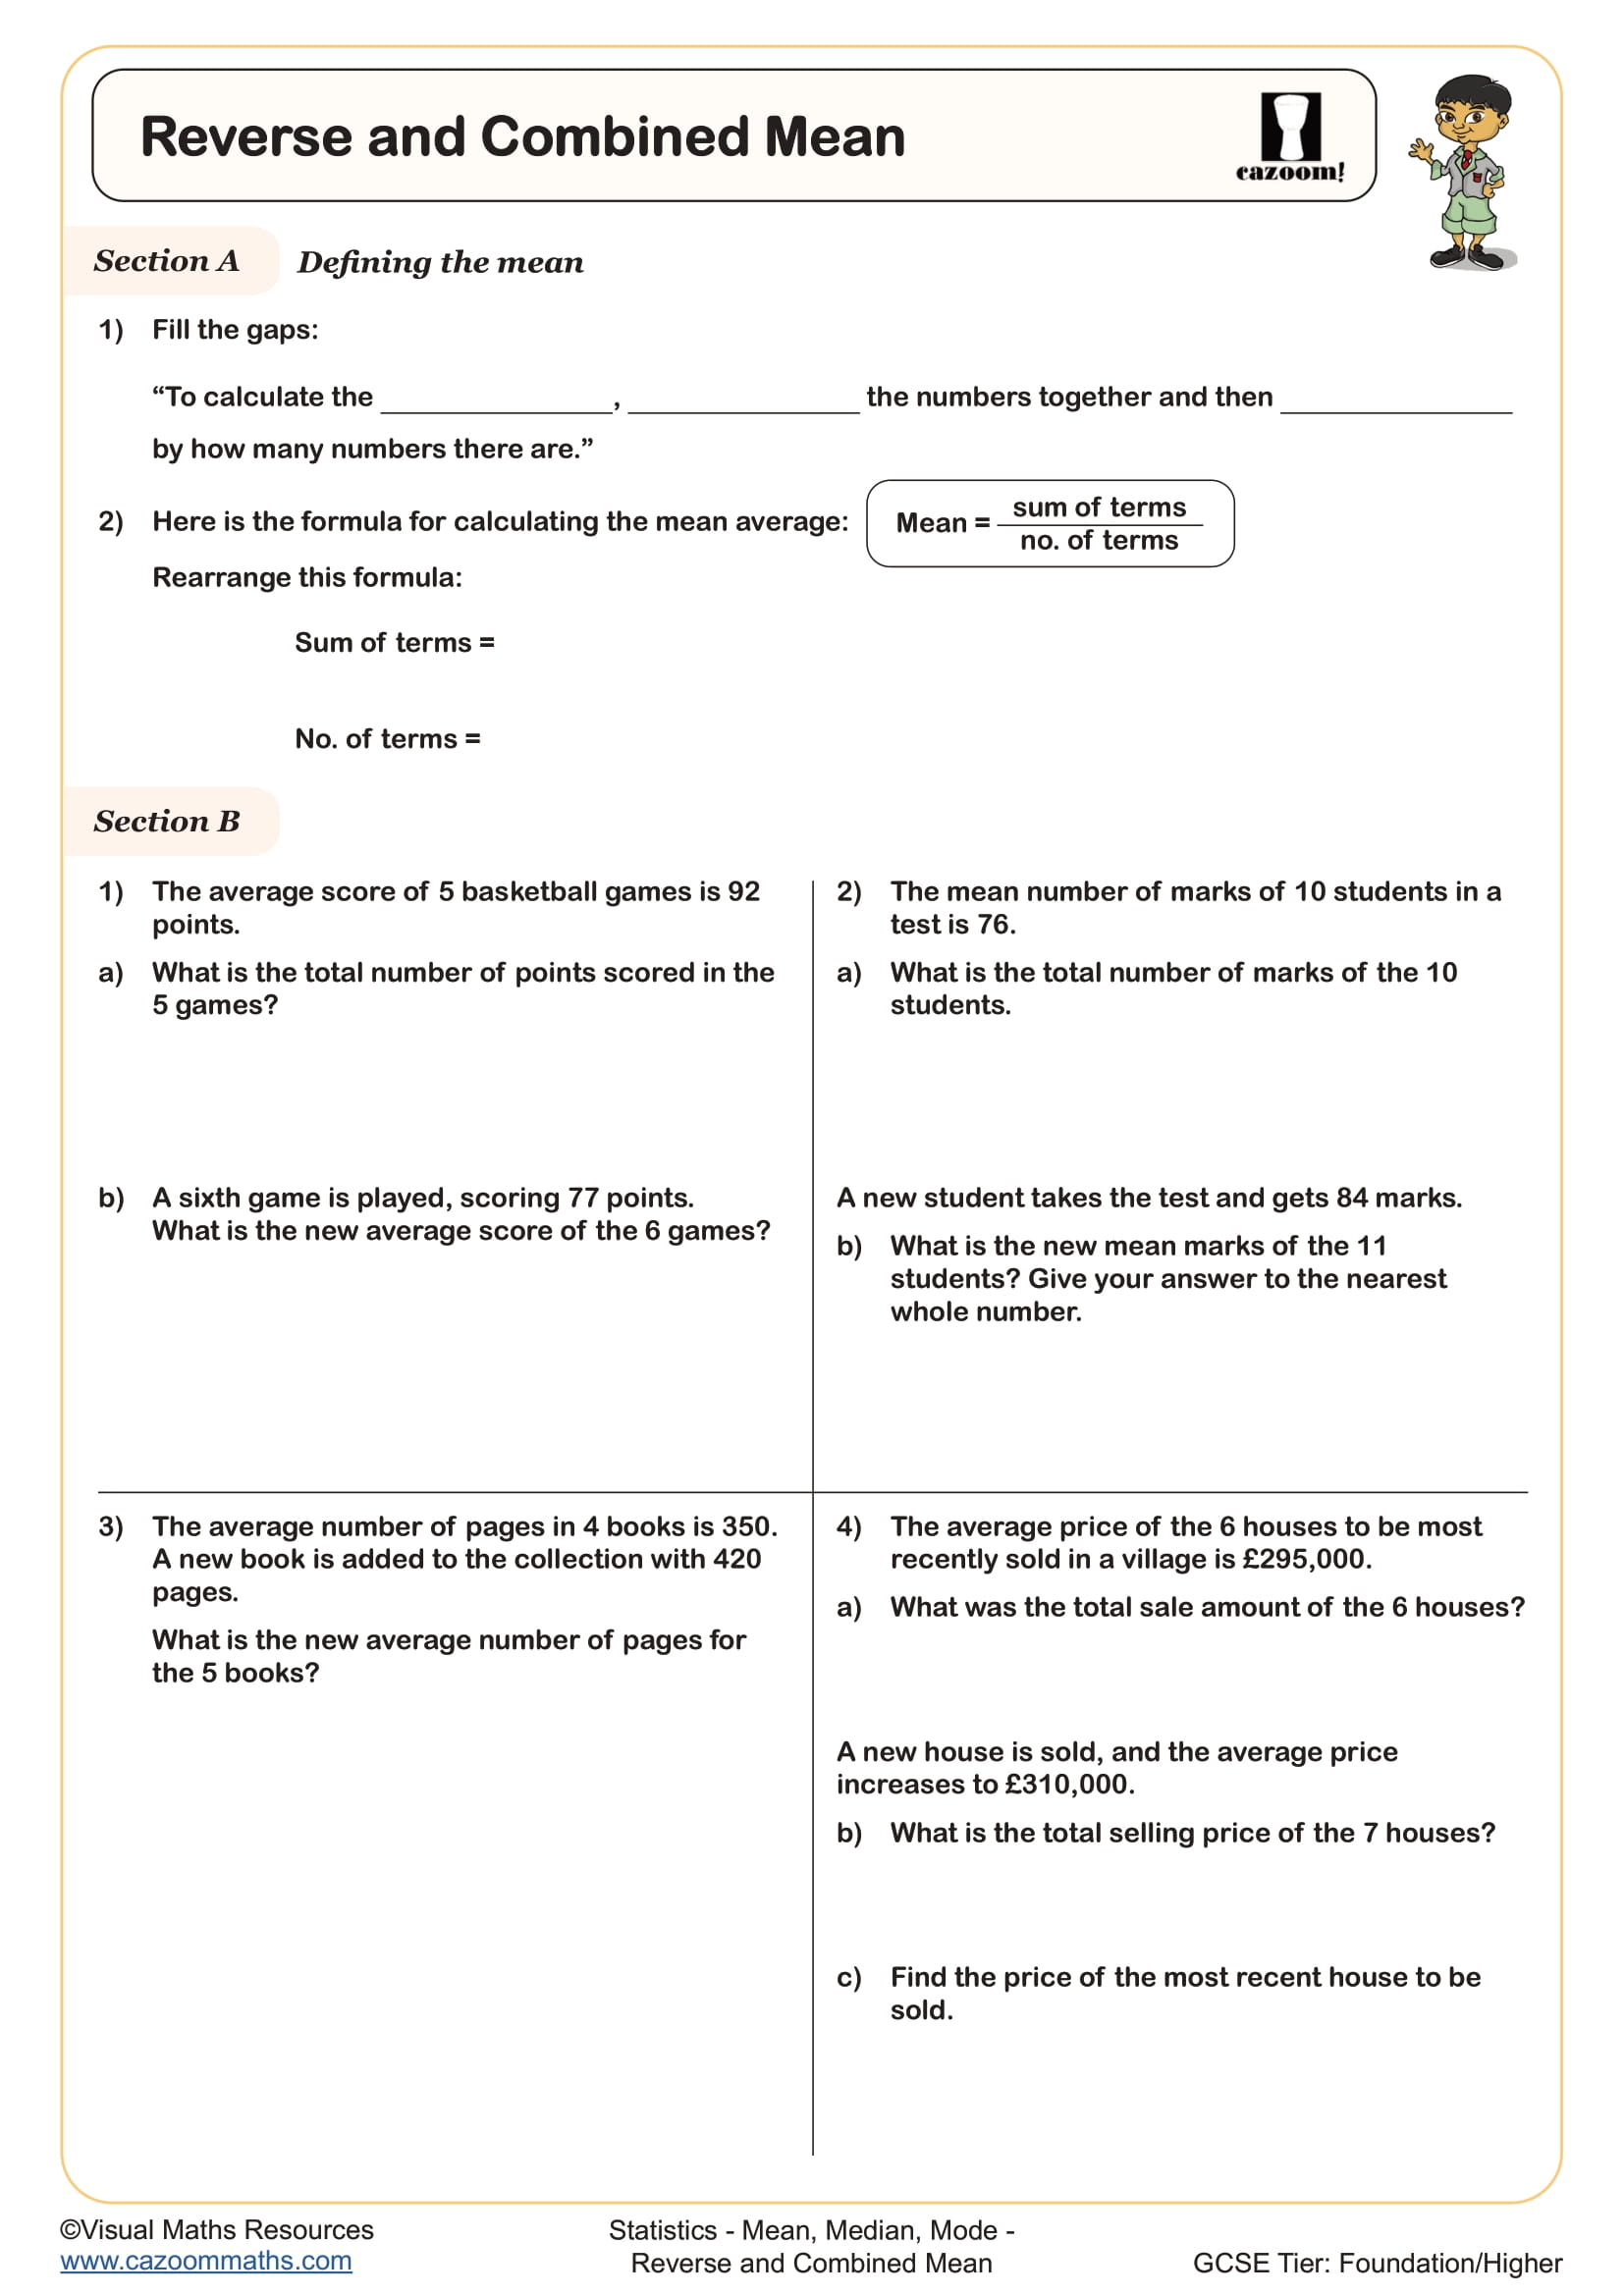
Reverse and Combined Mean
Year groups: 9, 10
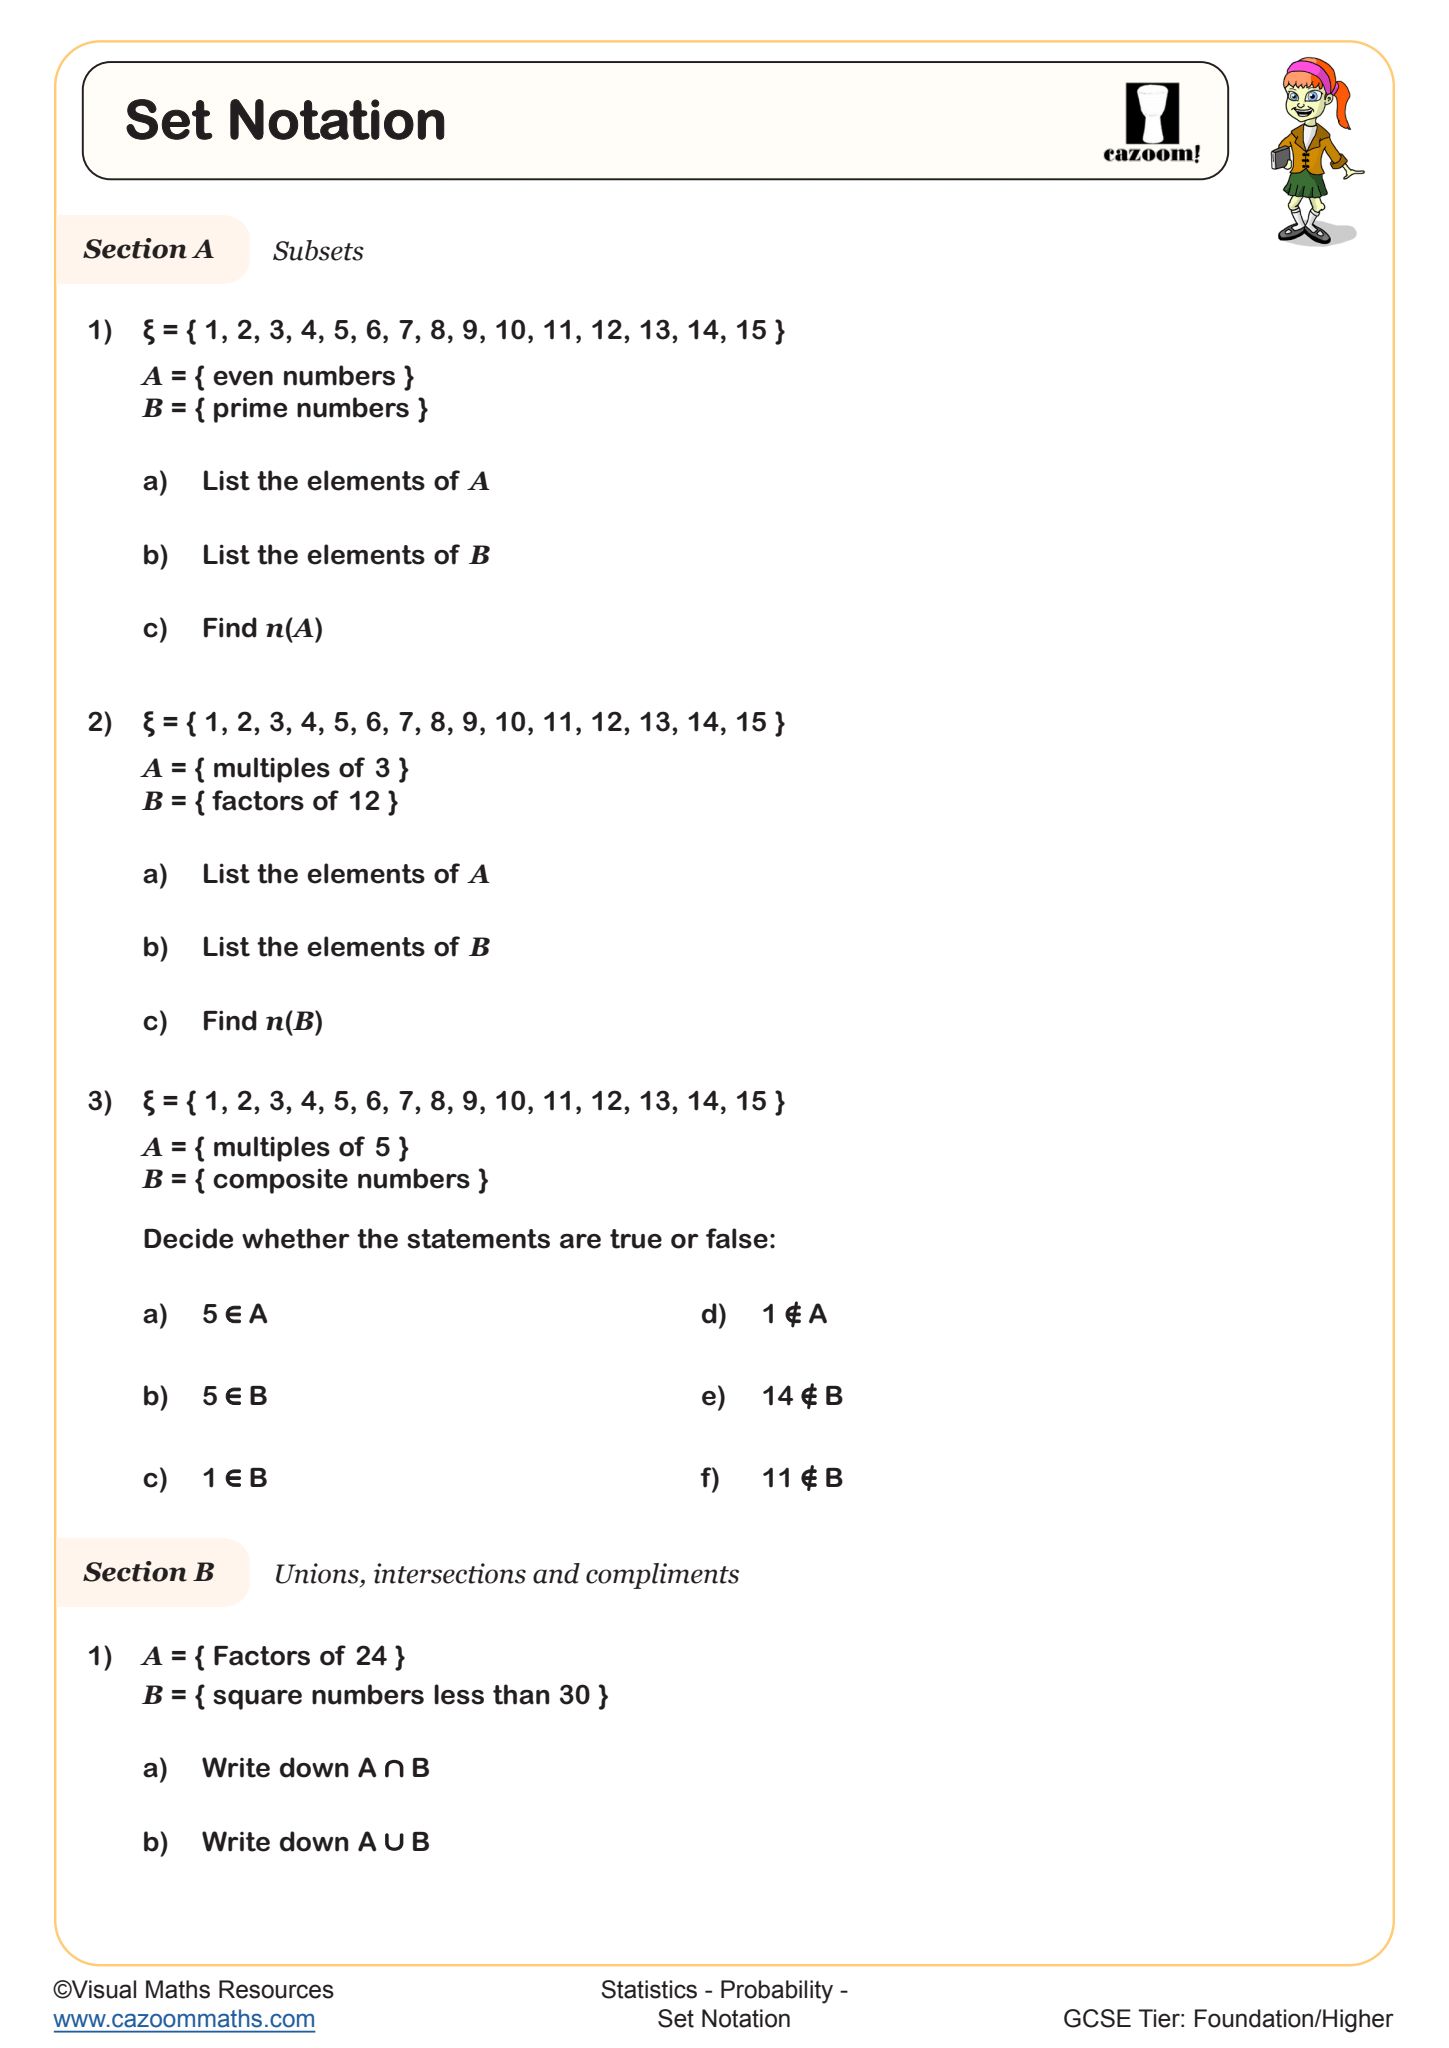
Set Notation
Year groups: 9, 10
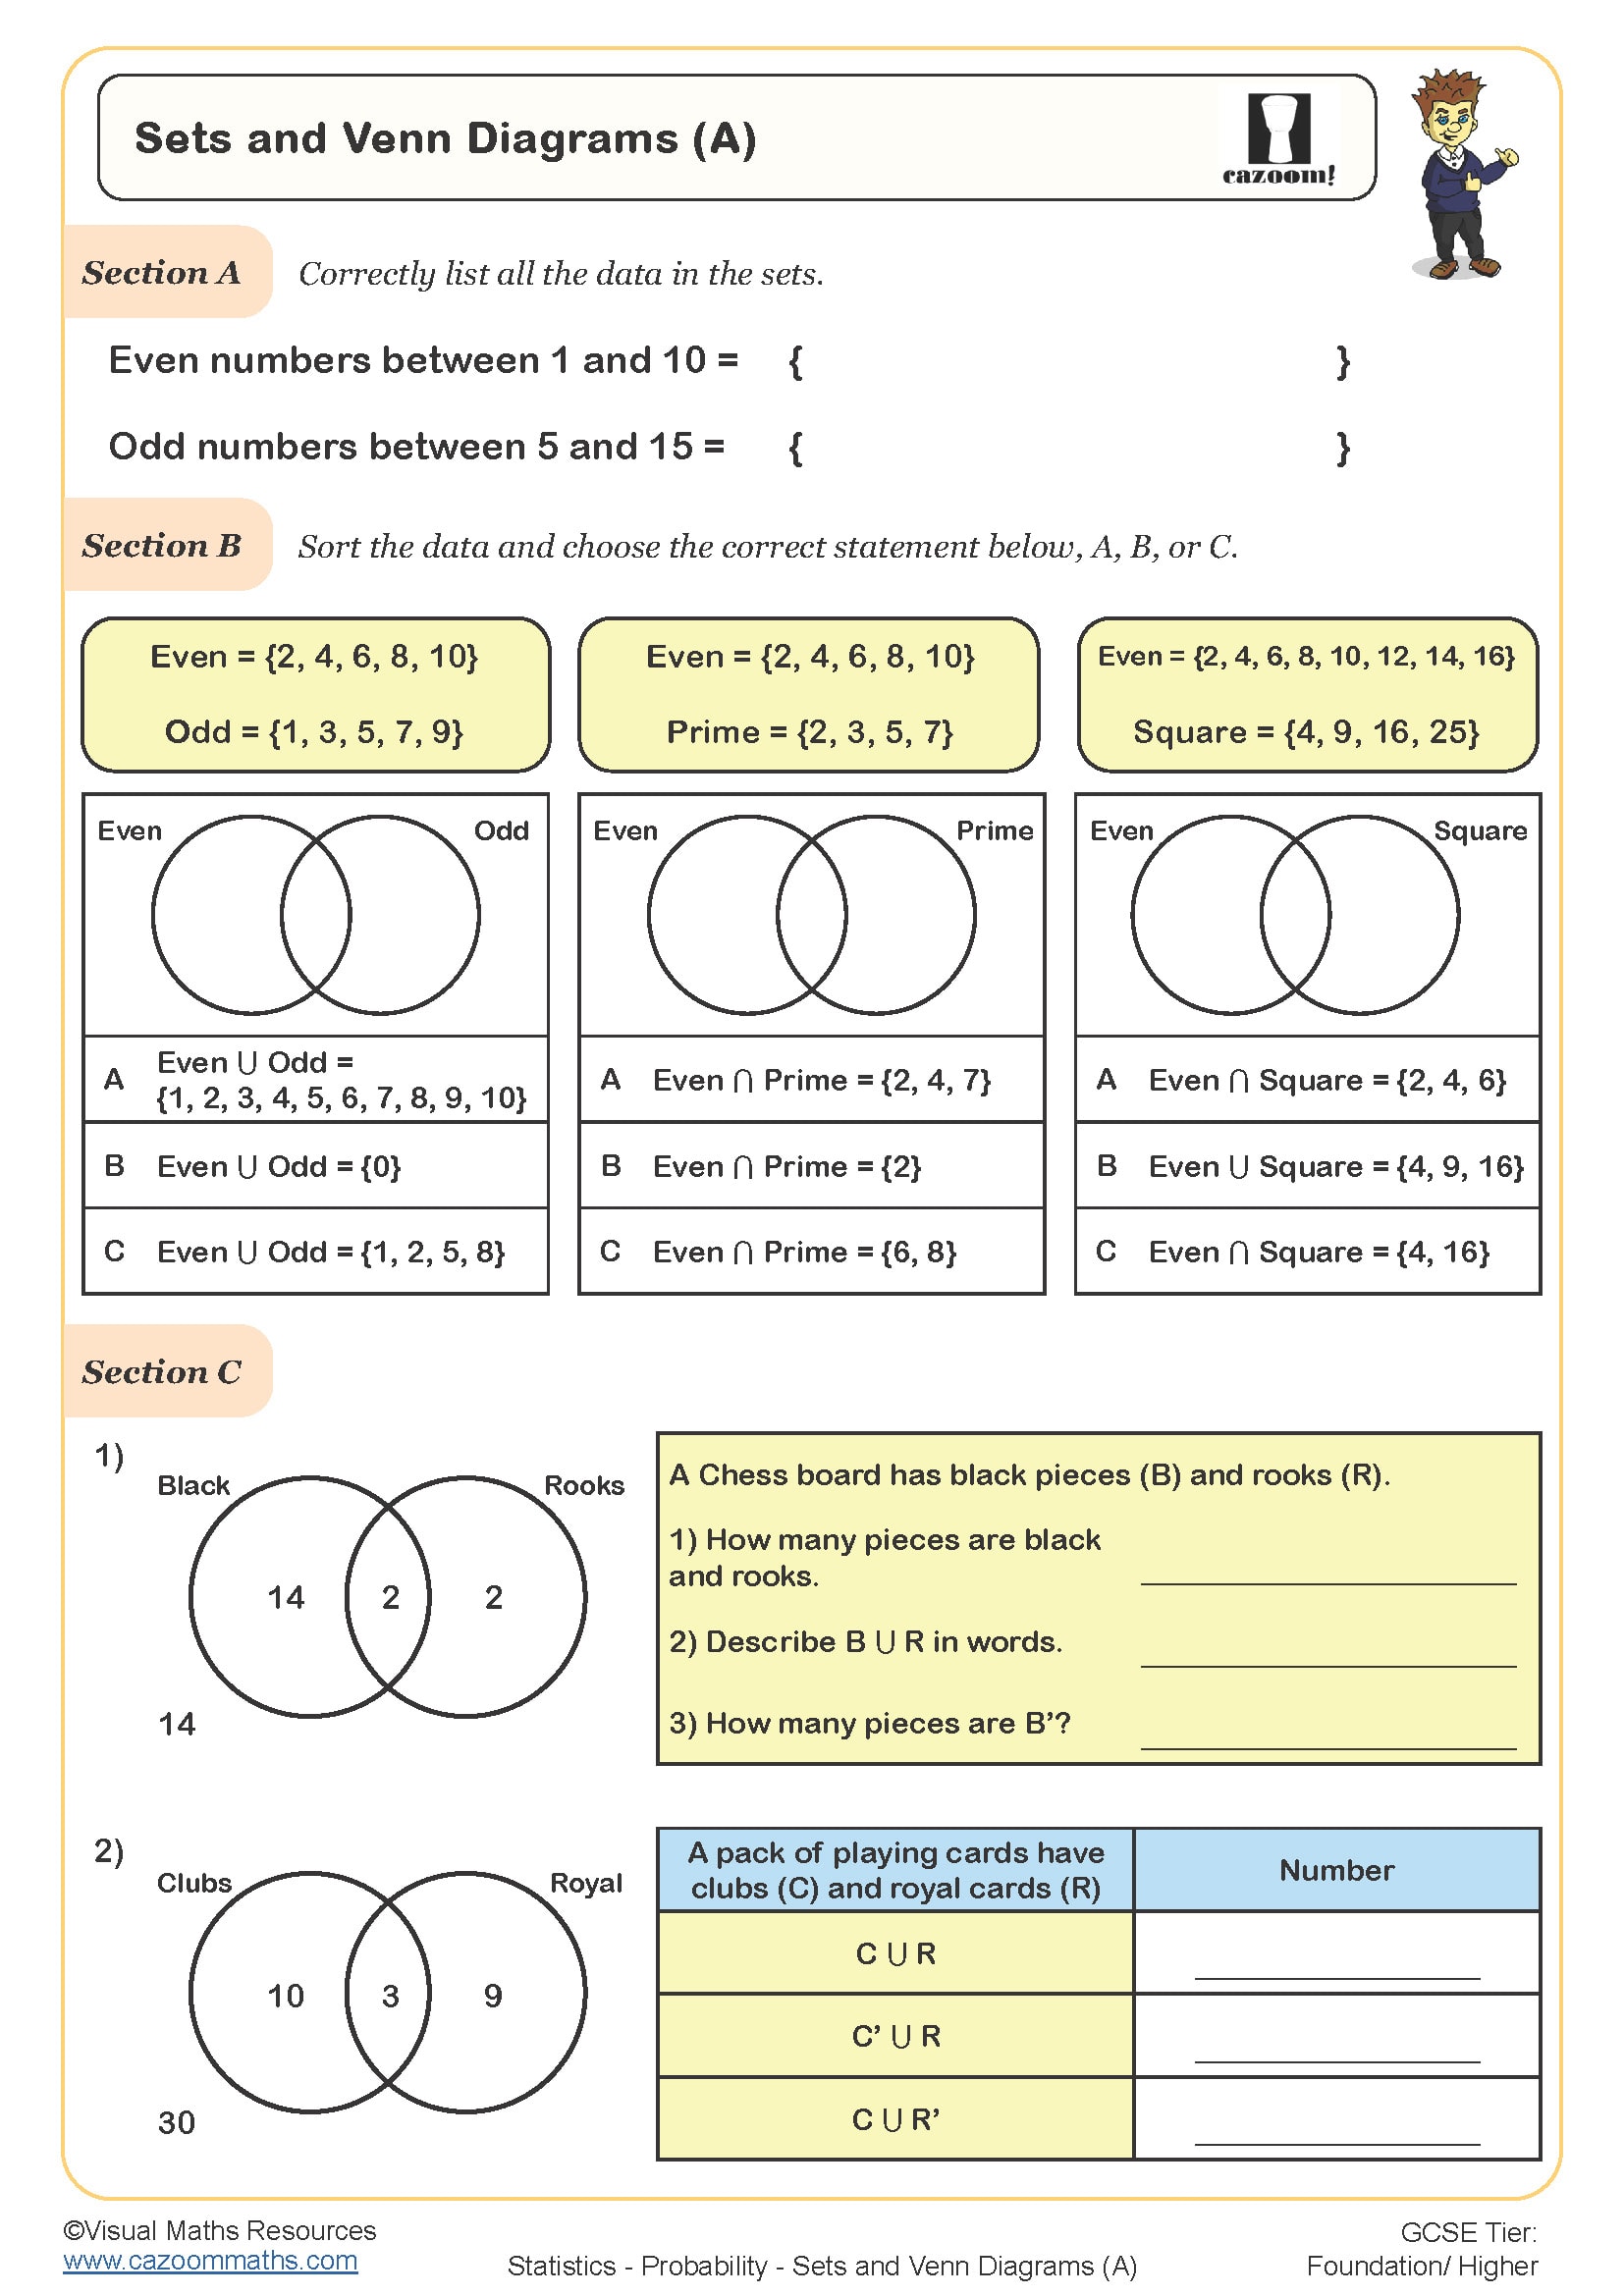
Sets and Venn Diagrams (A)
Year groups: 9, 10
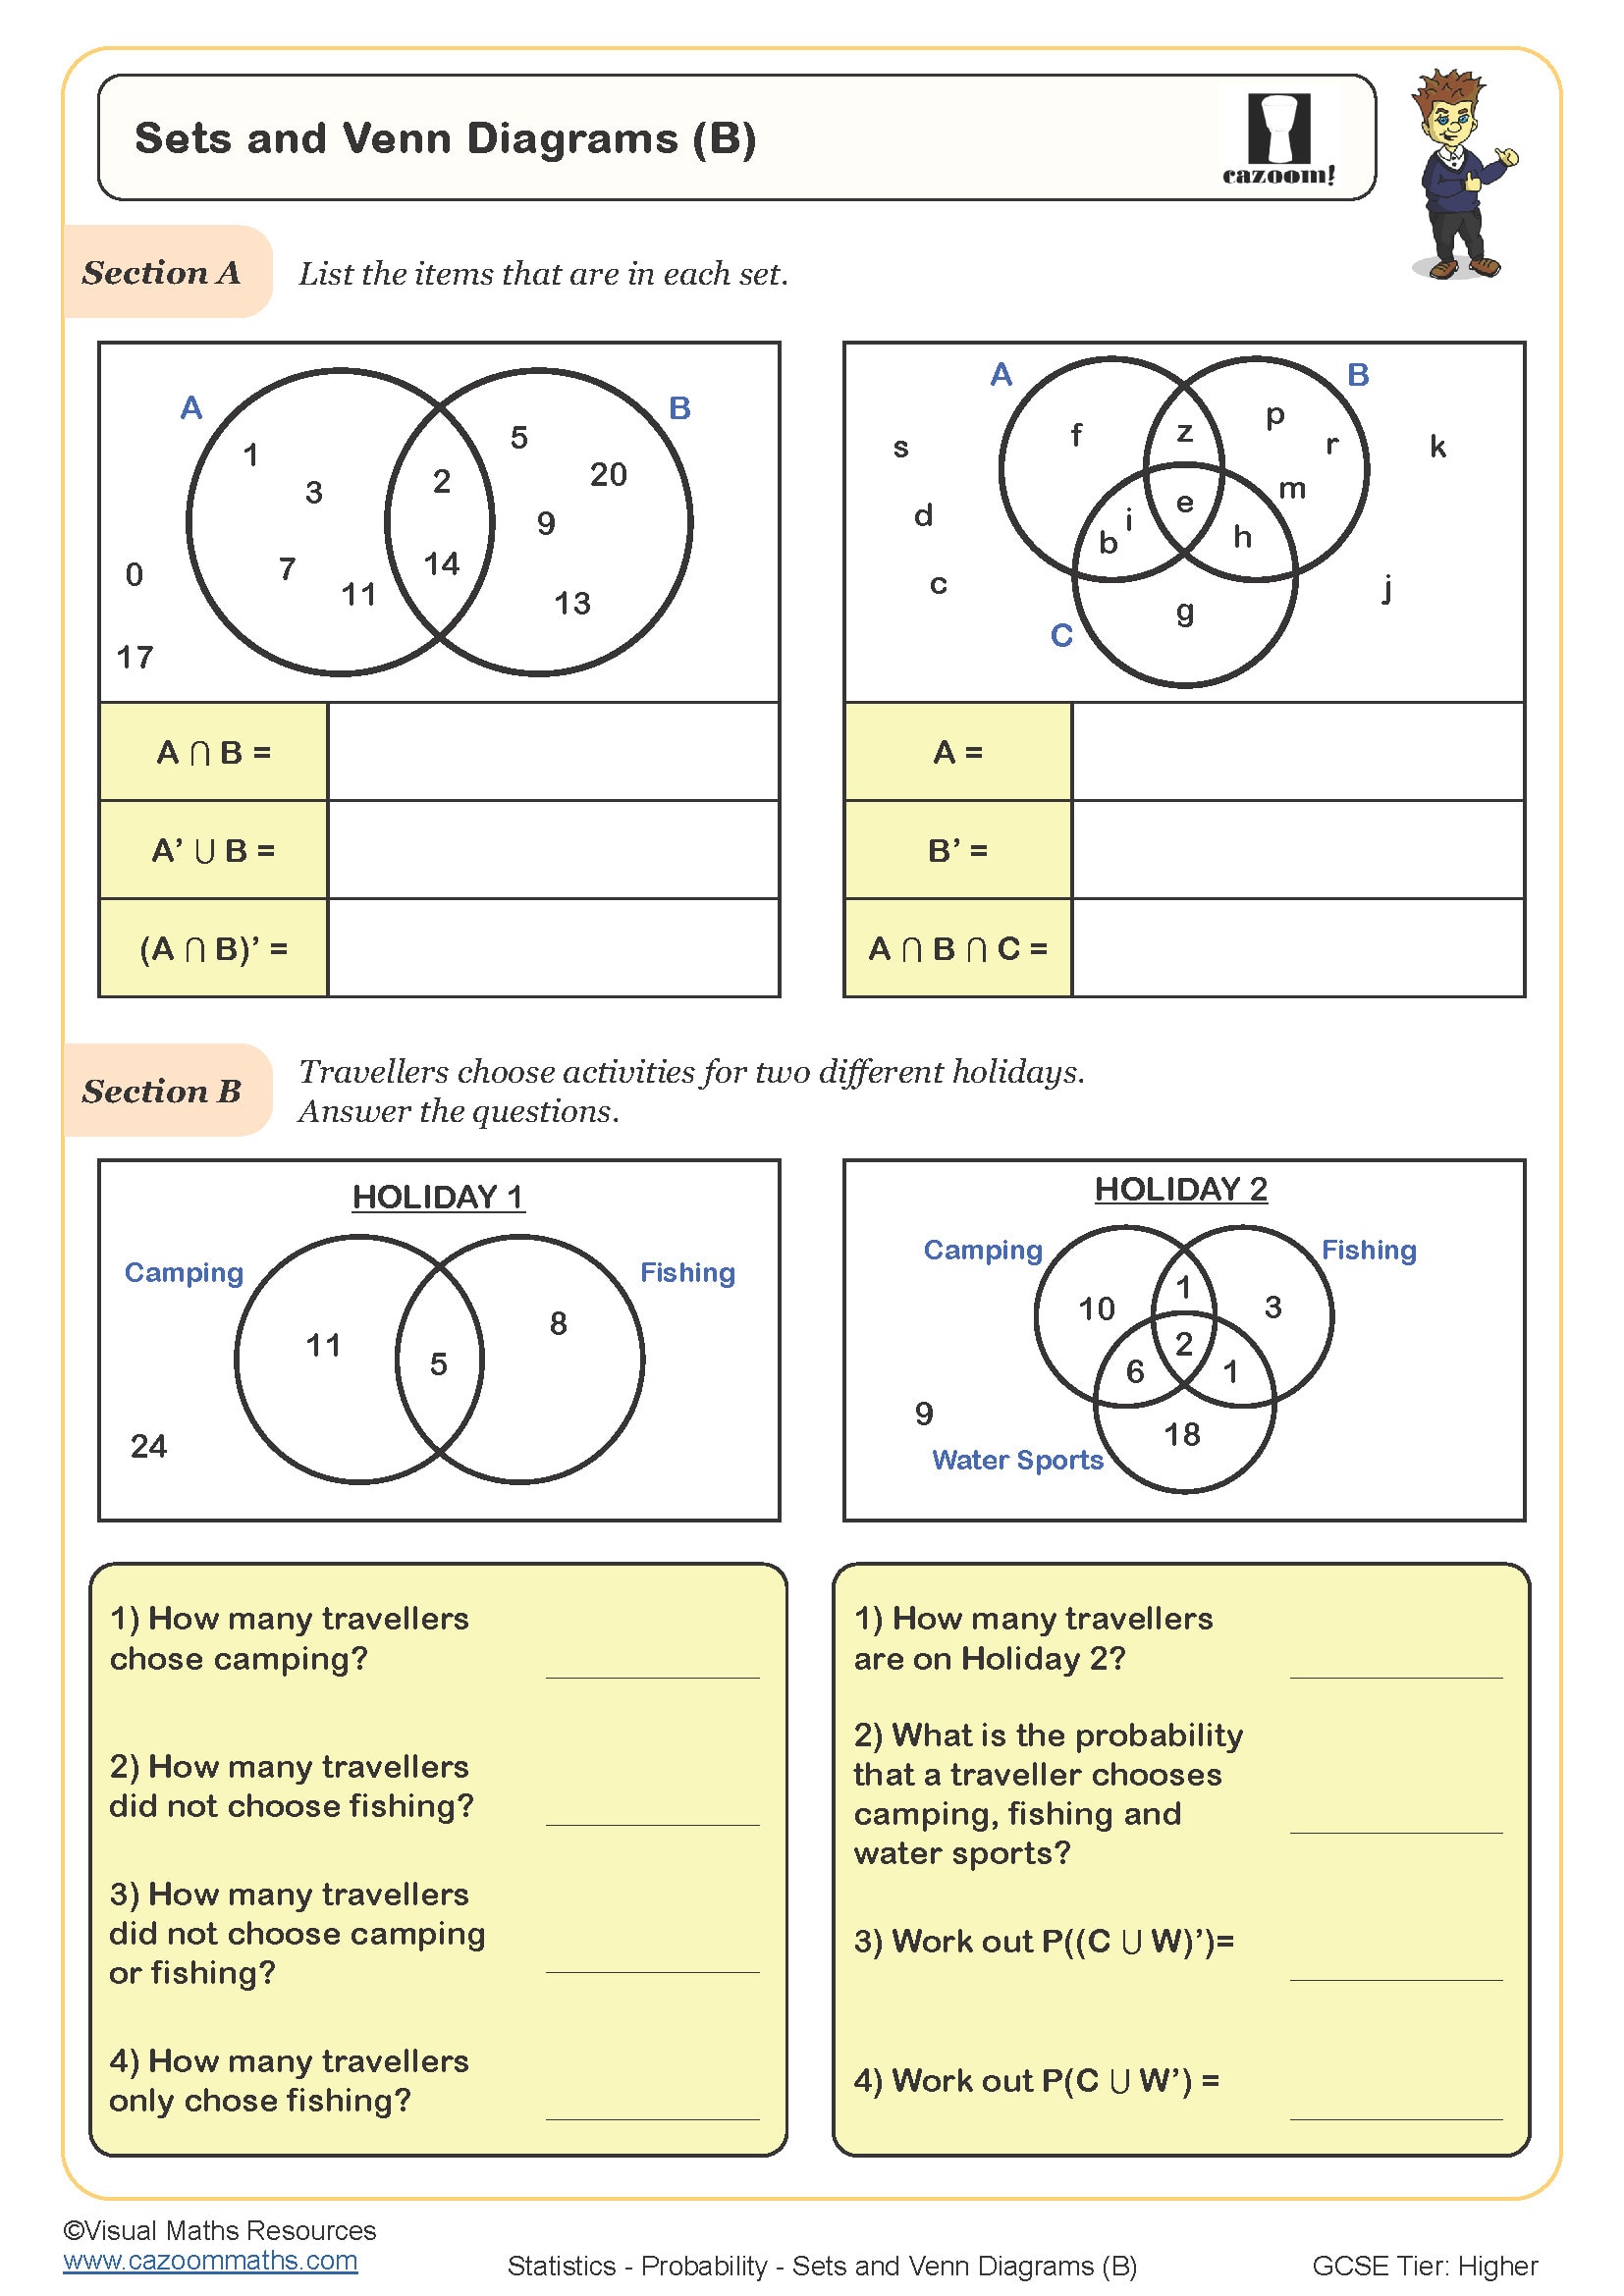
Sets and Venn Diagrams (B)
Year groups: 9, 10
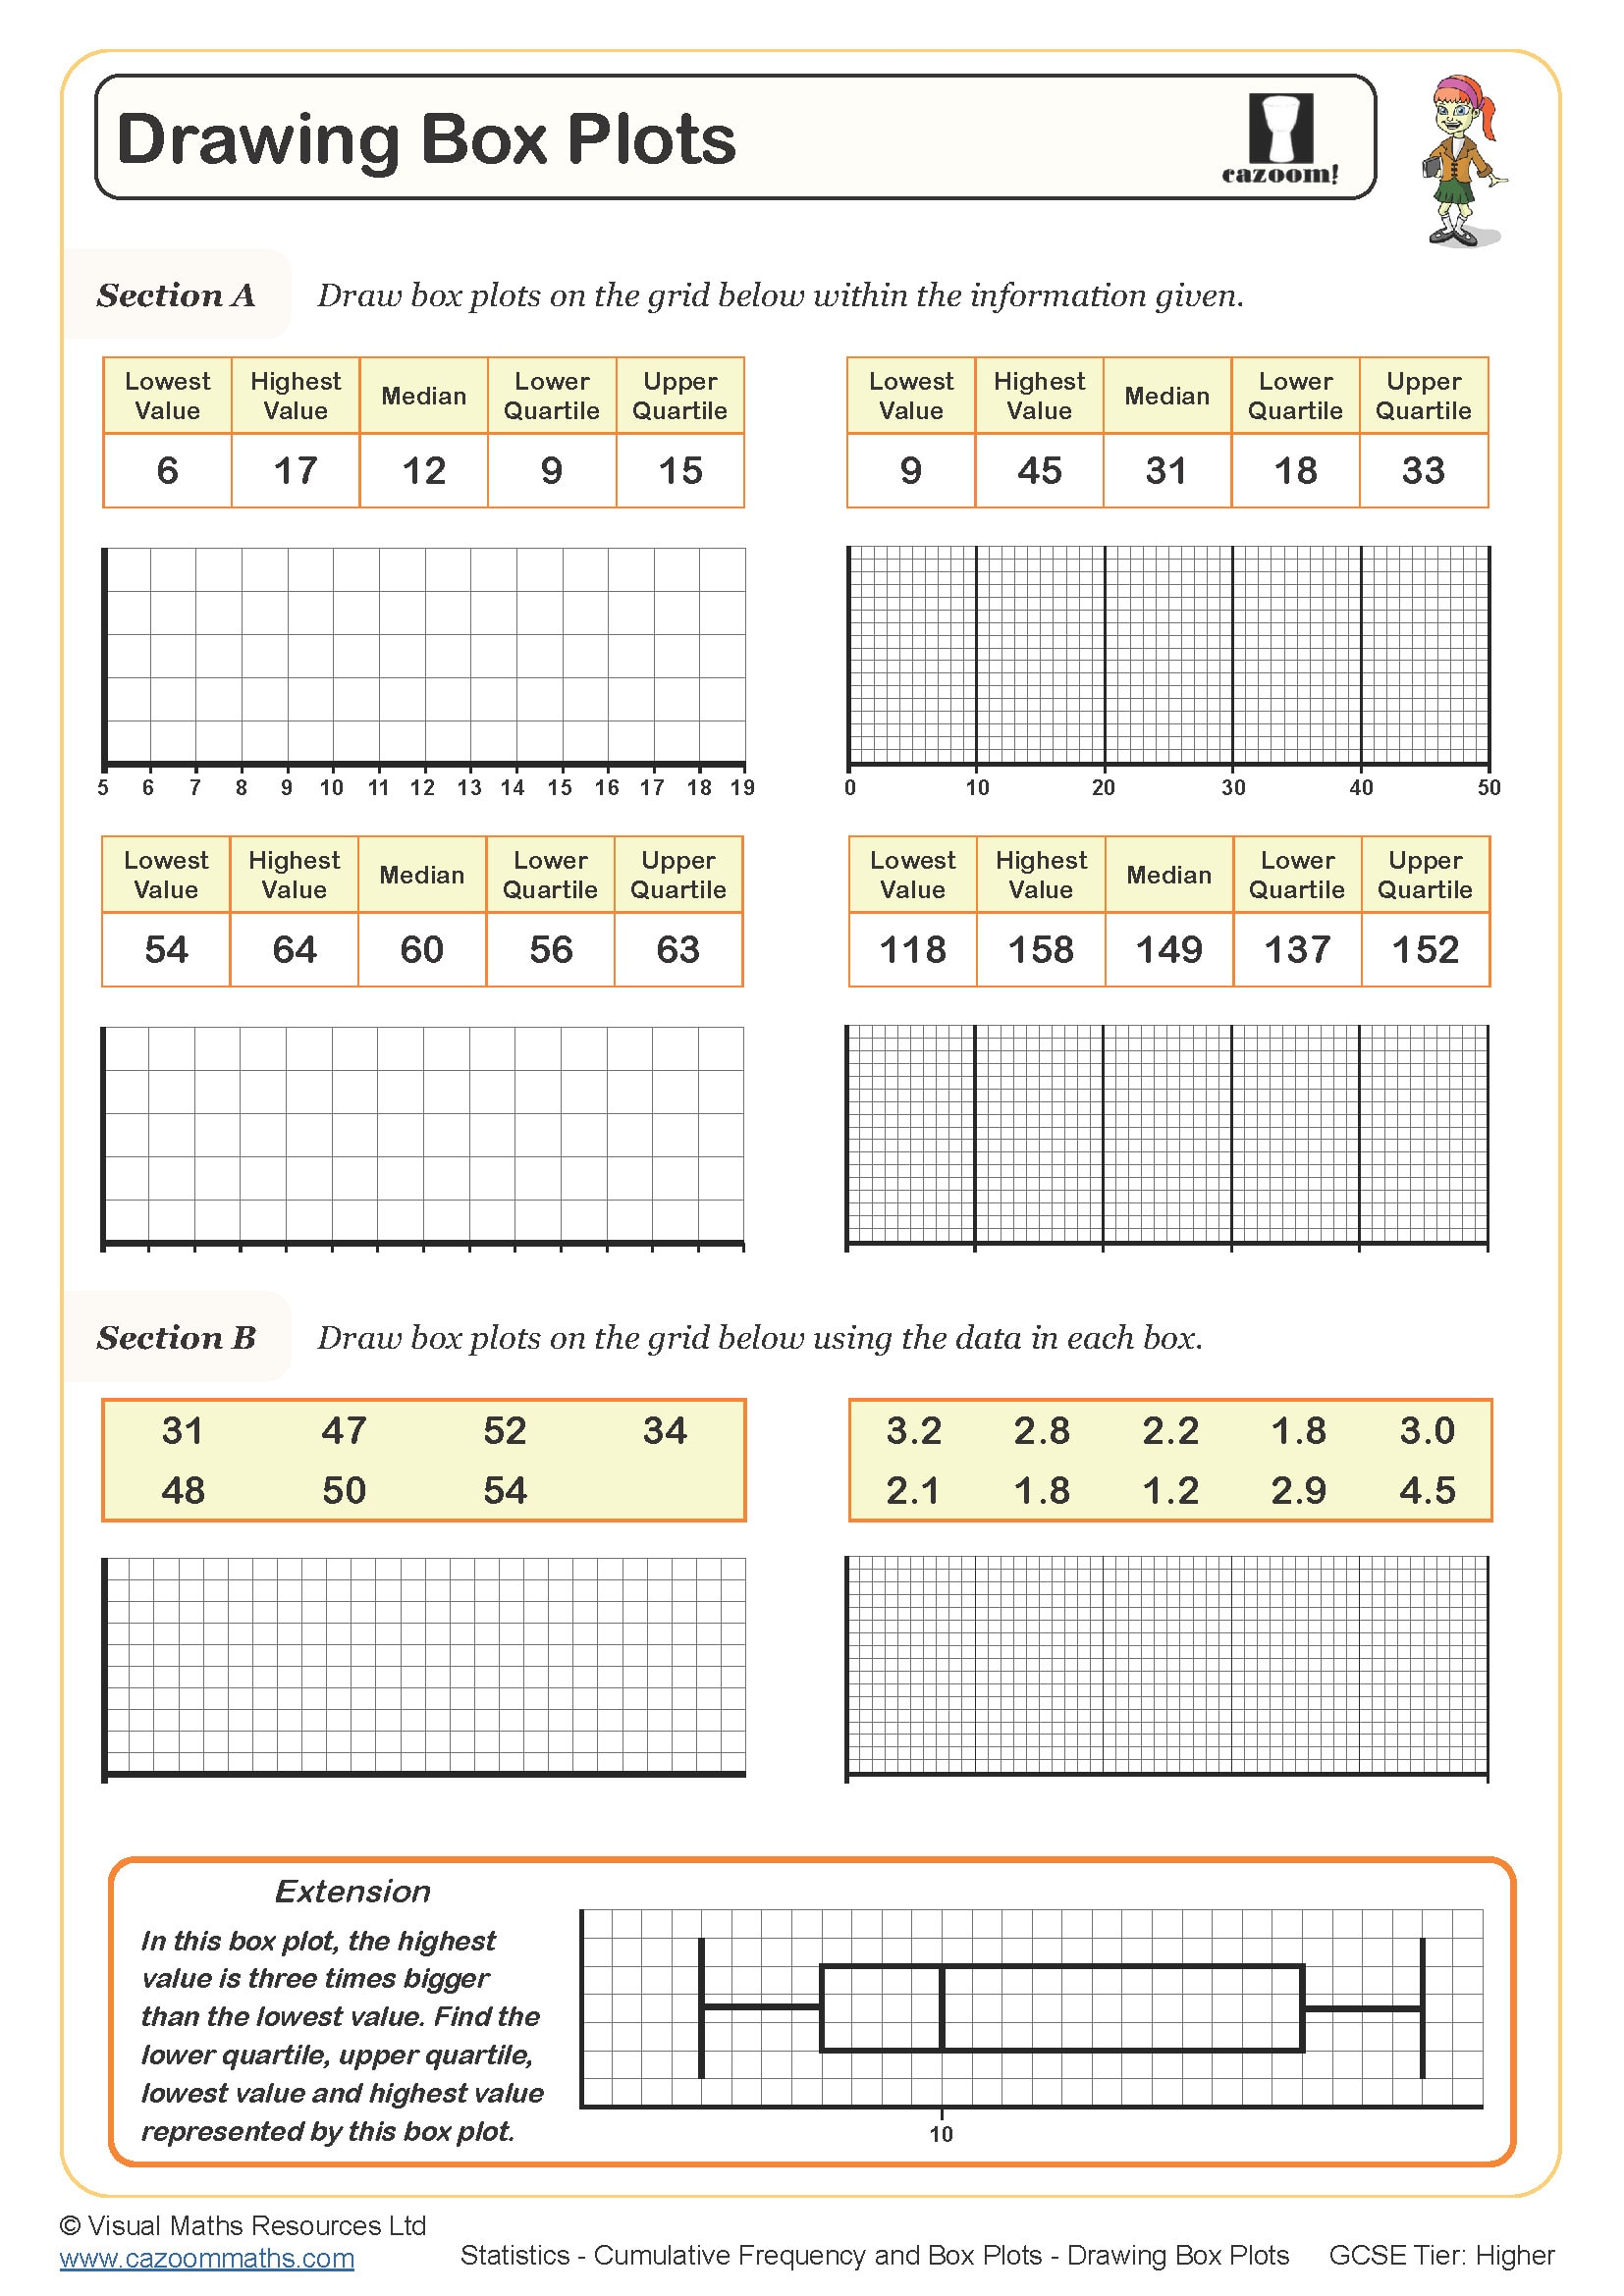
Drawing Box Plots
Year groups: 10, 11
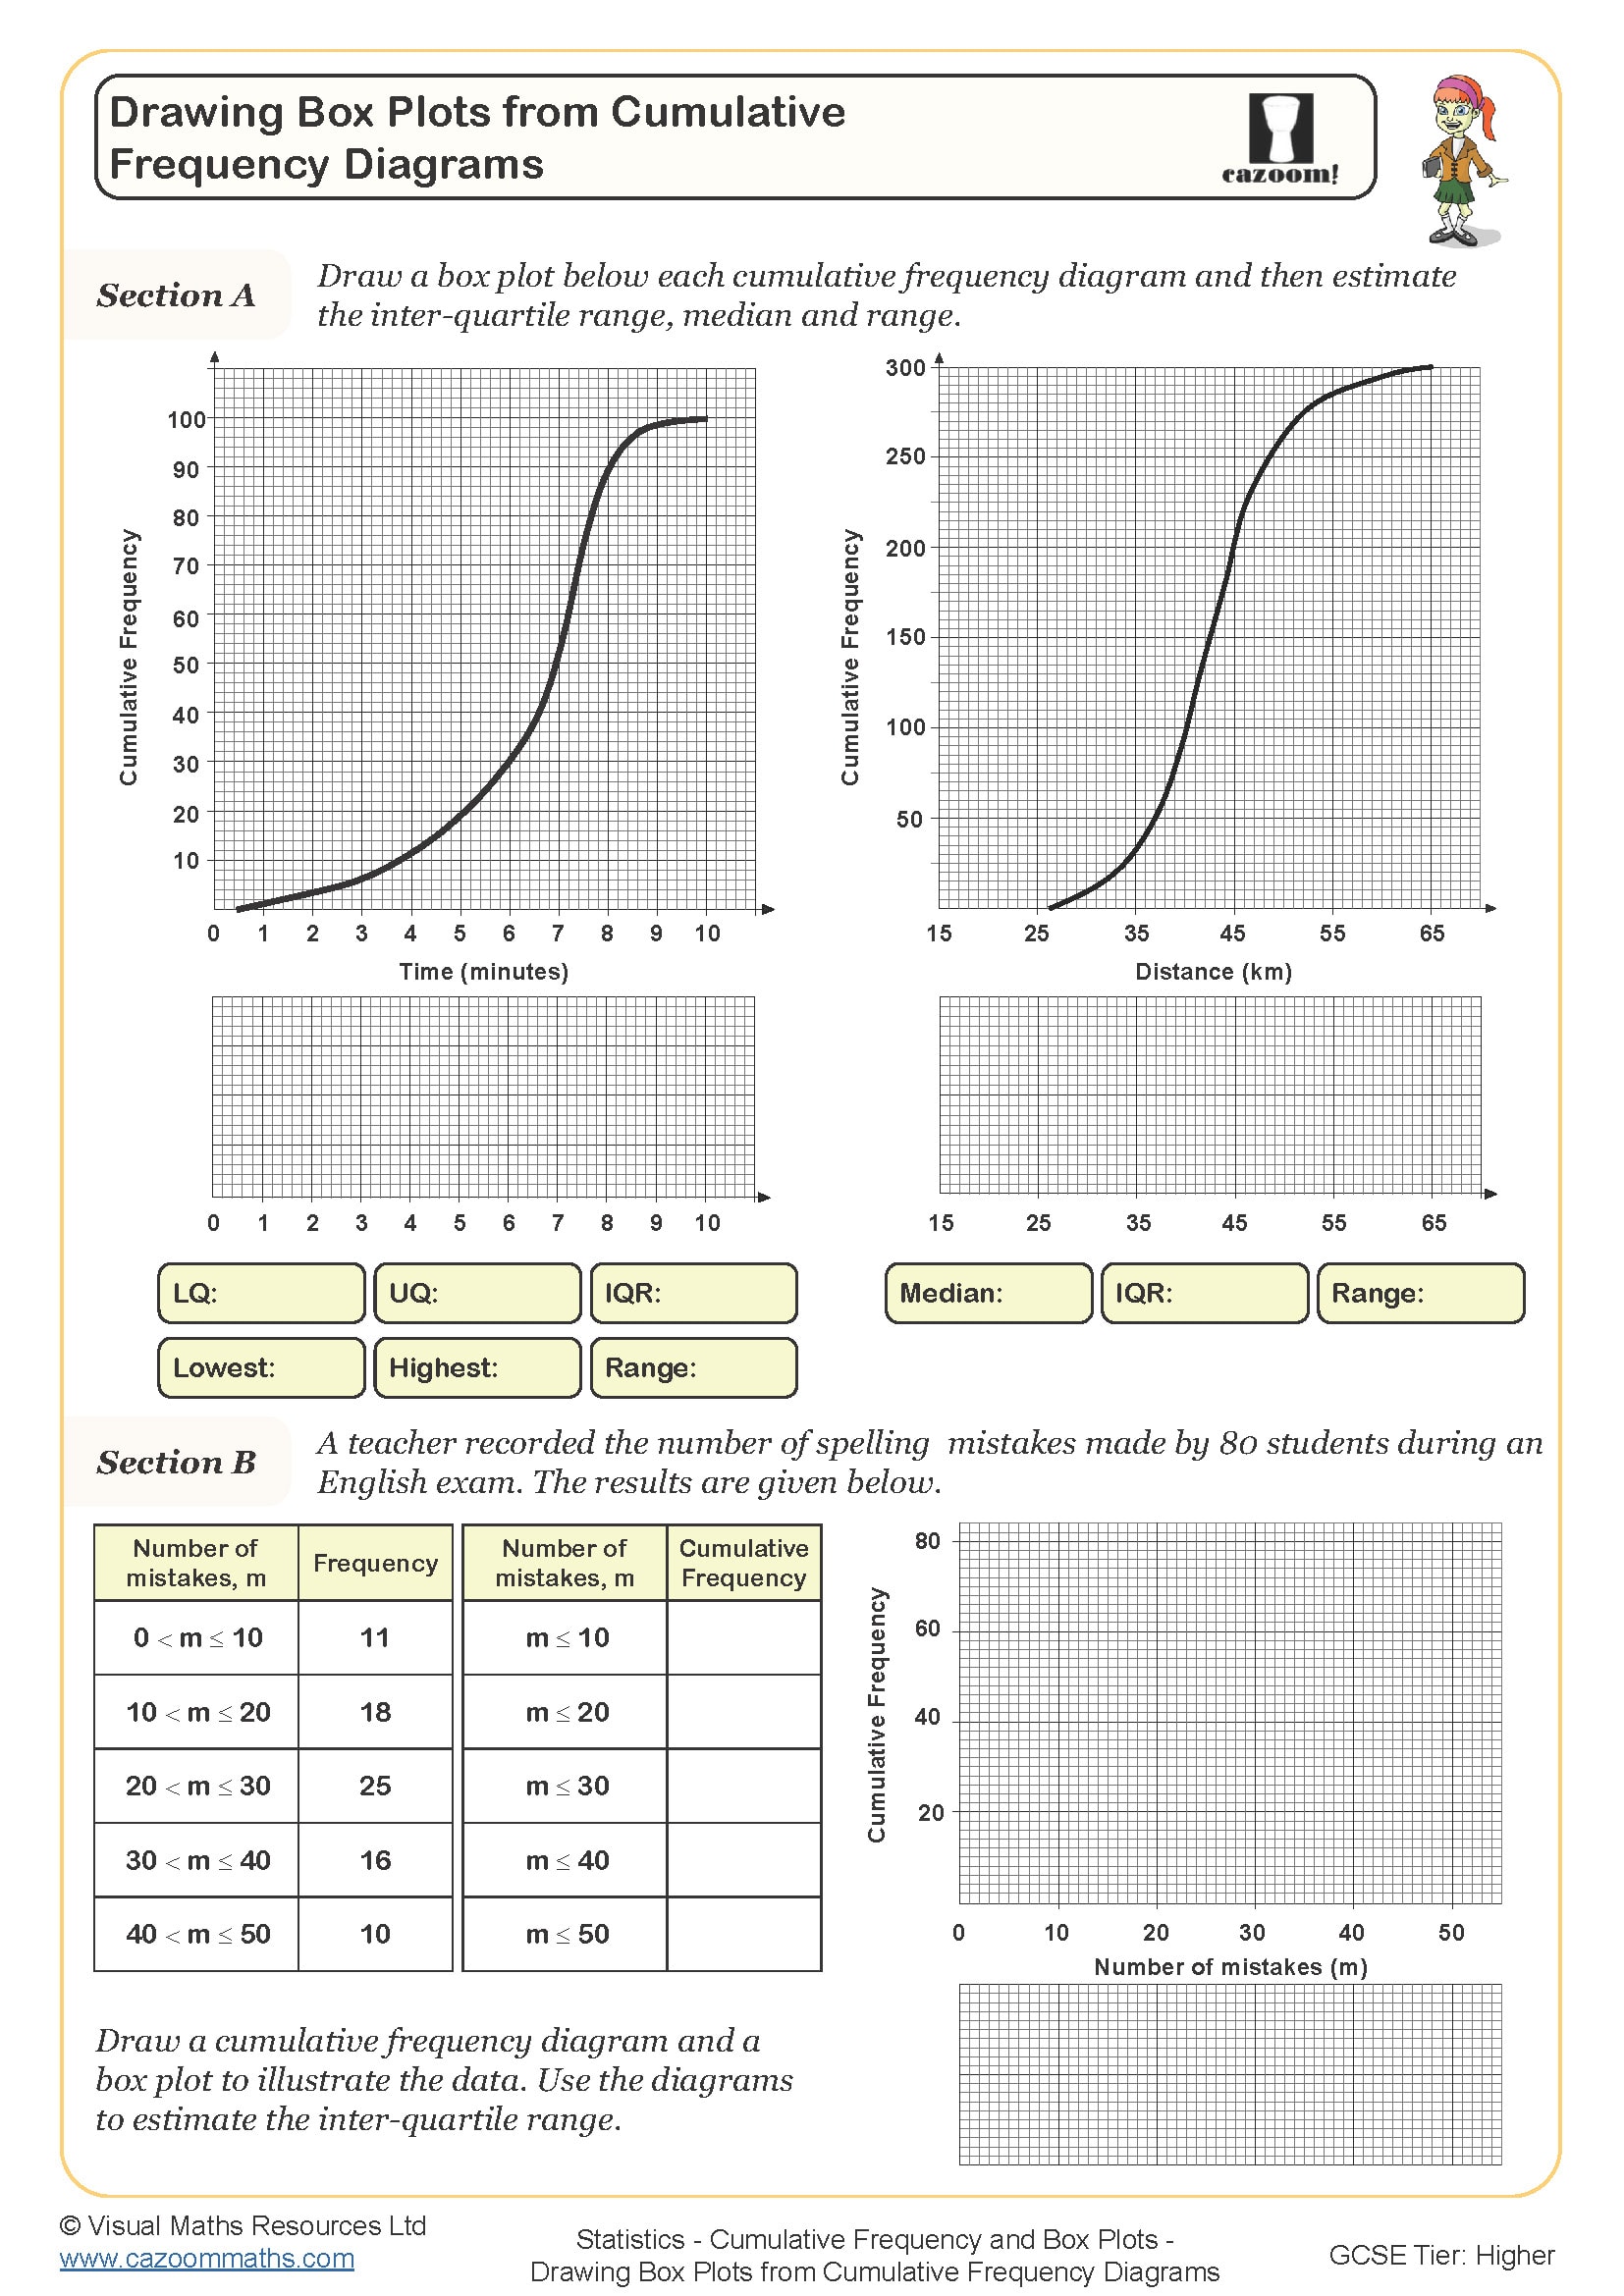
Drawing Box Plots from Cumulative Frequency Diagrams
Year groups: 10, 11
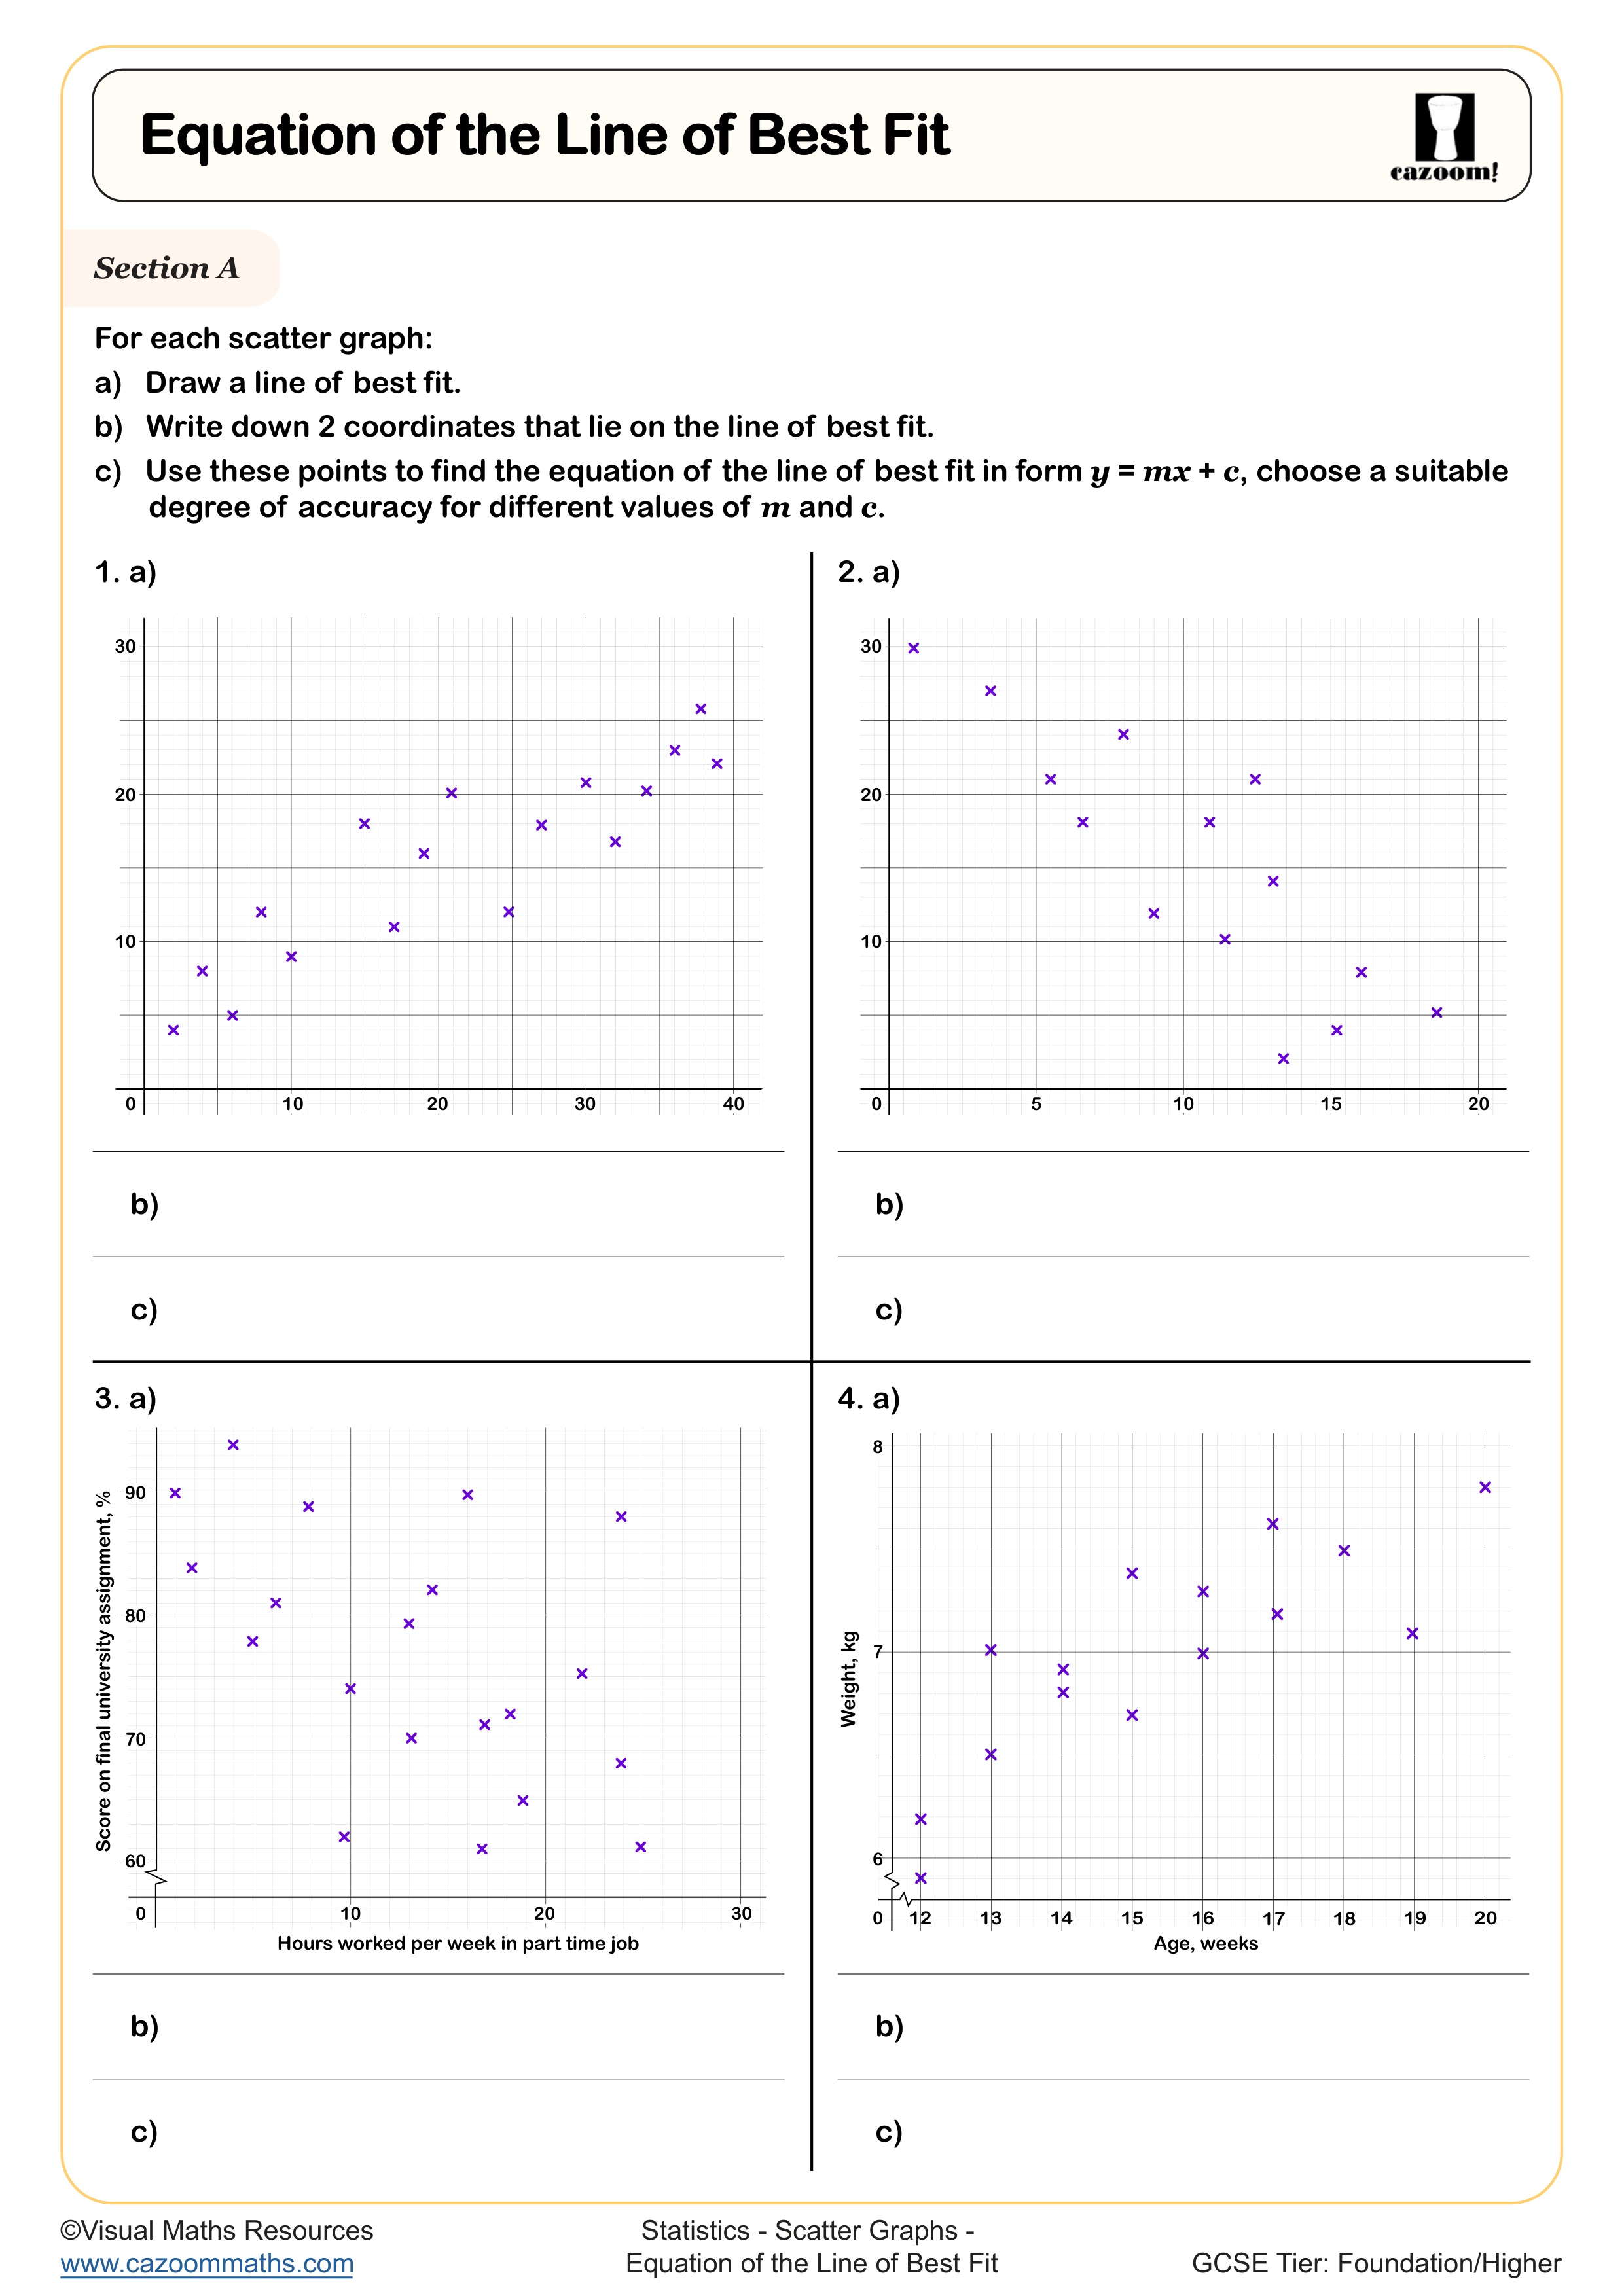
Equation of the Line of Best Fit
Year groups: 10, 11
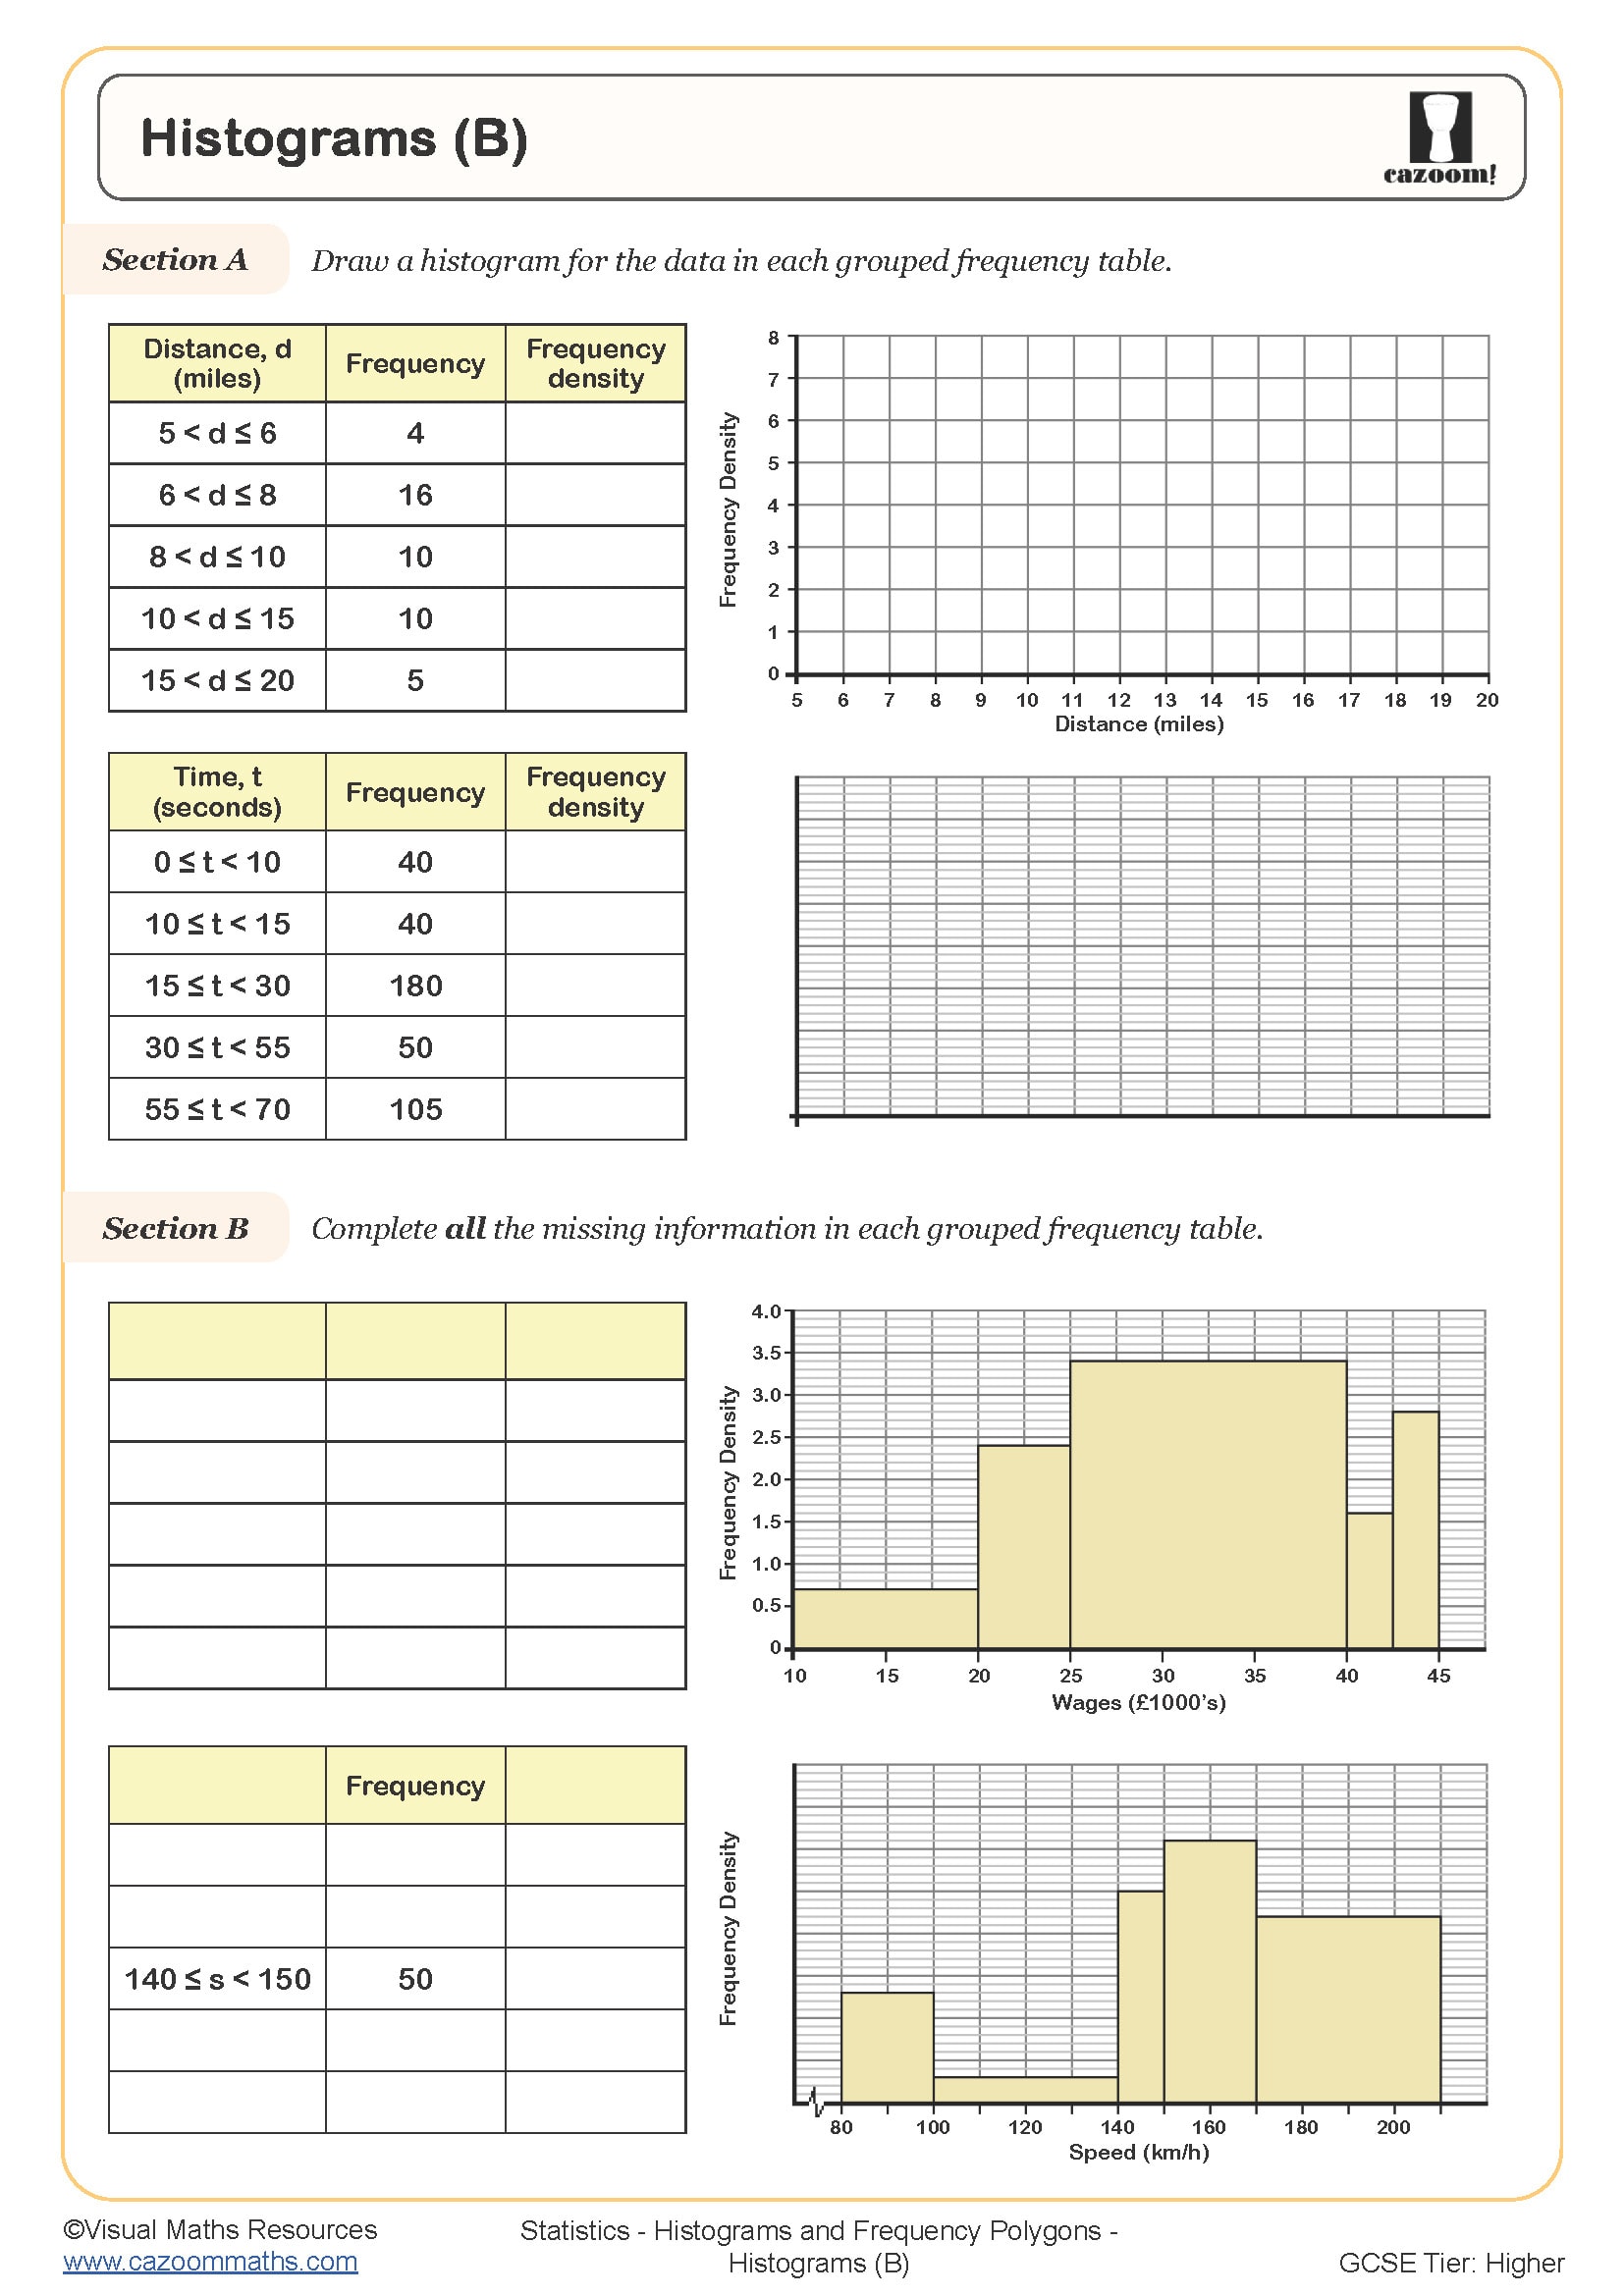
Histograms (B)
Year groups: 10, 11
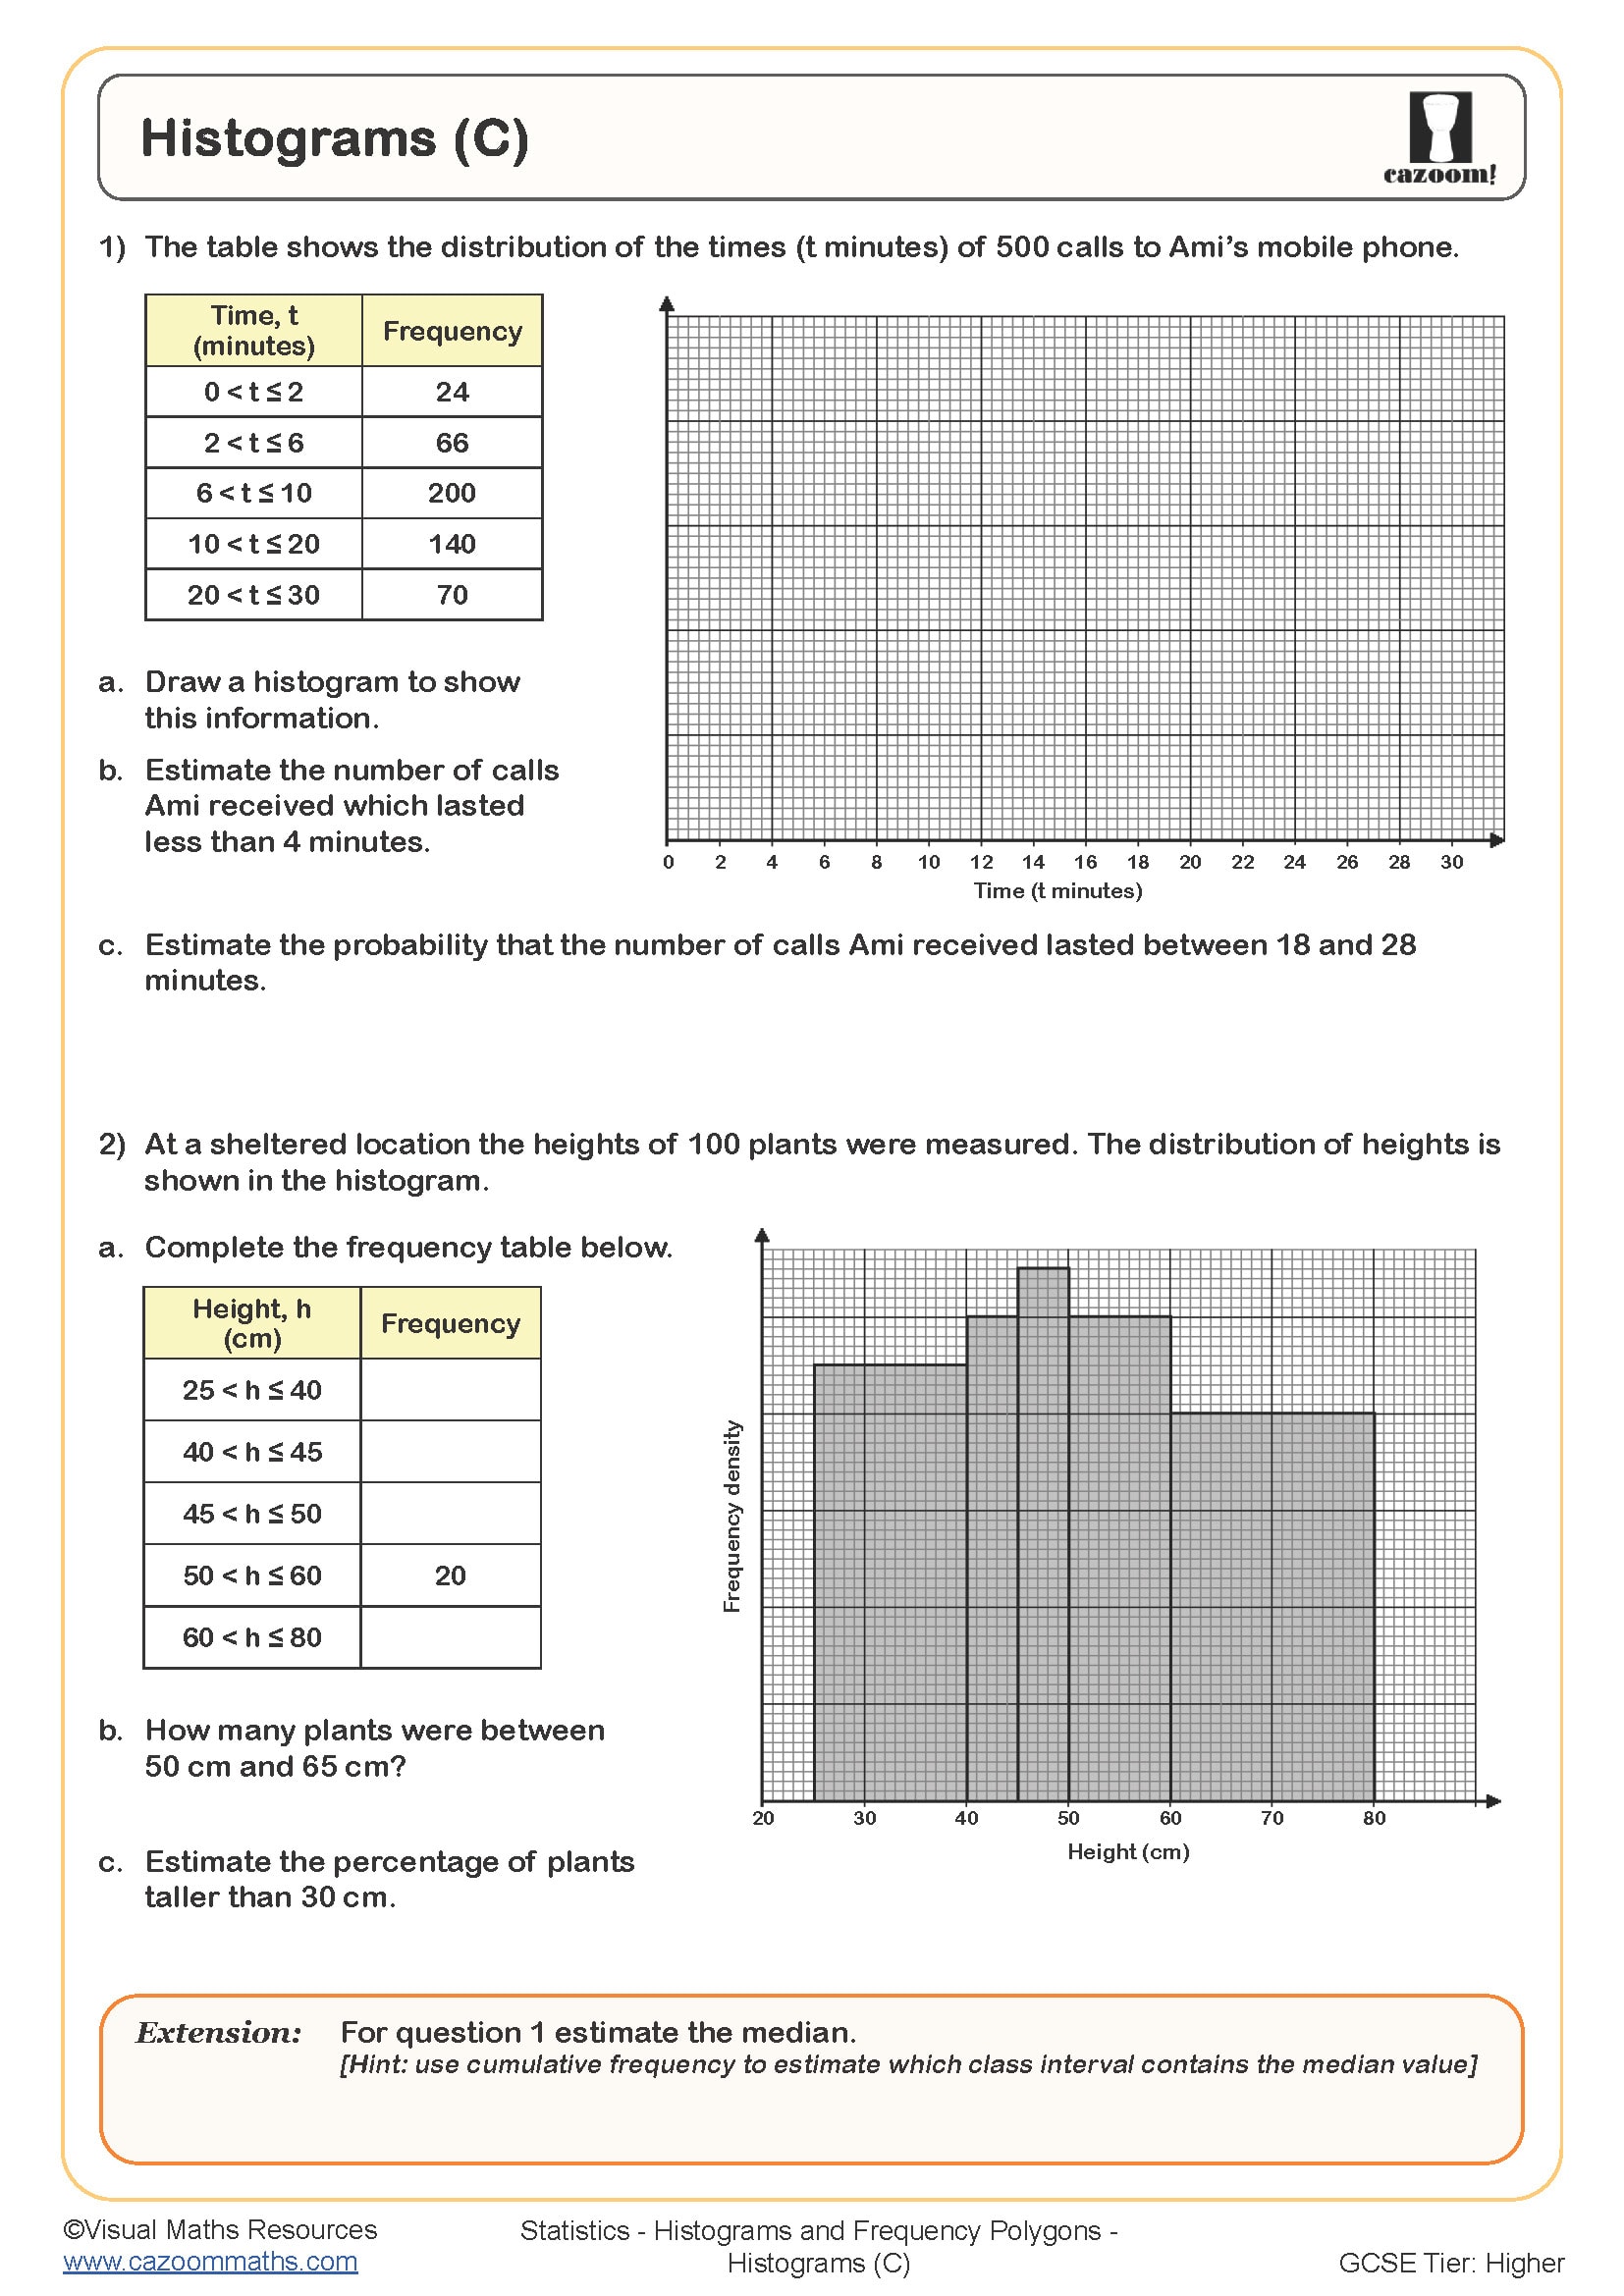
Histograms (C)
Year groups: 10, 11
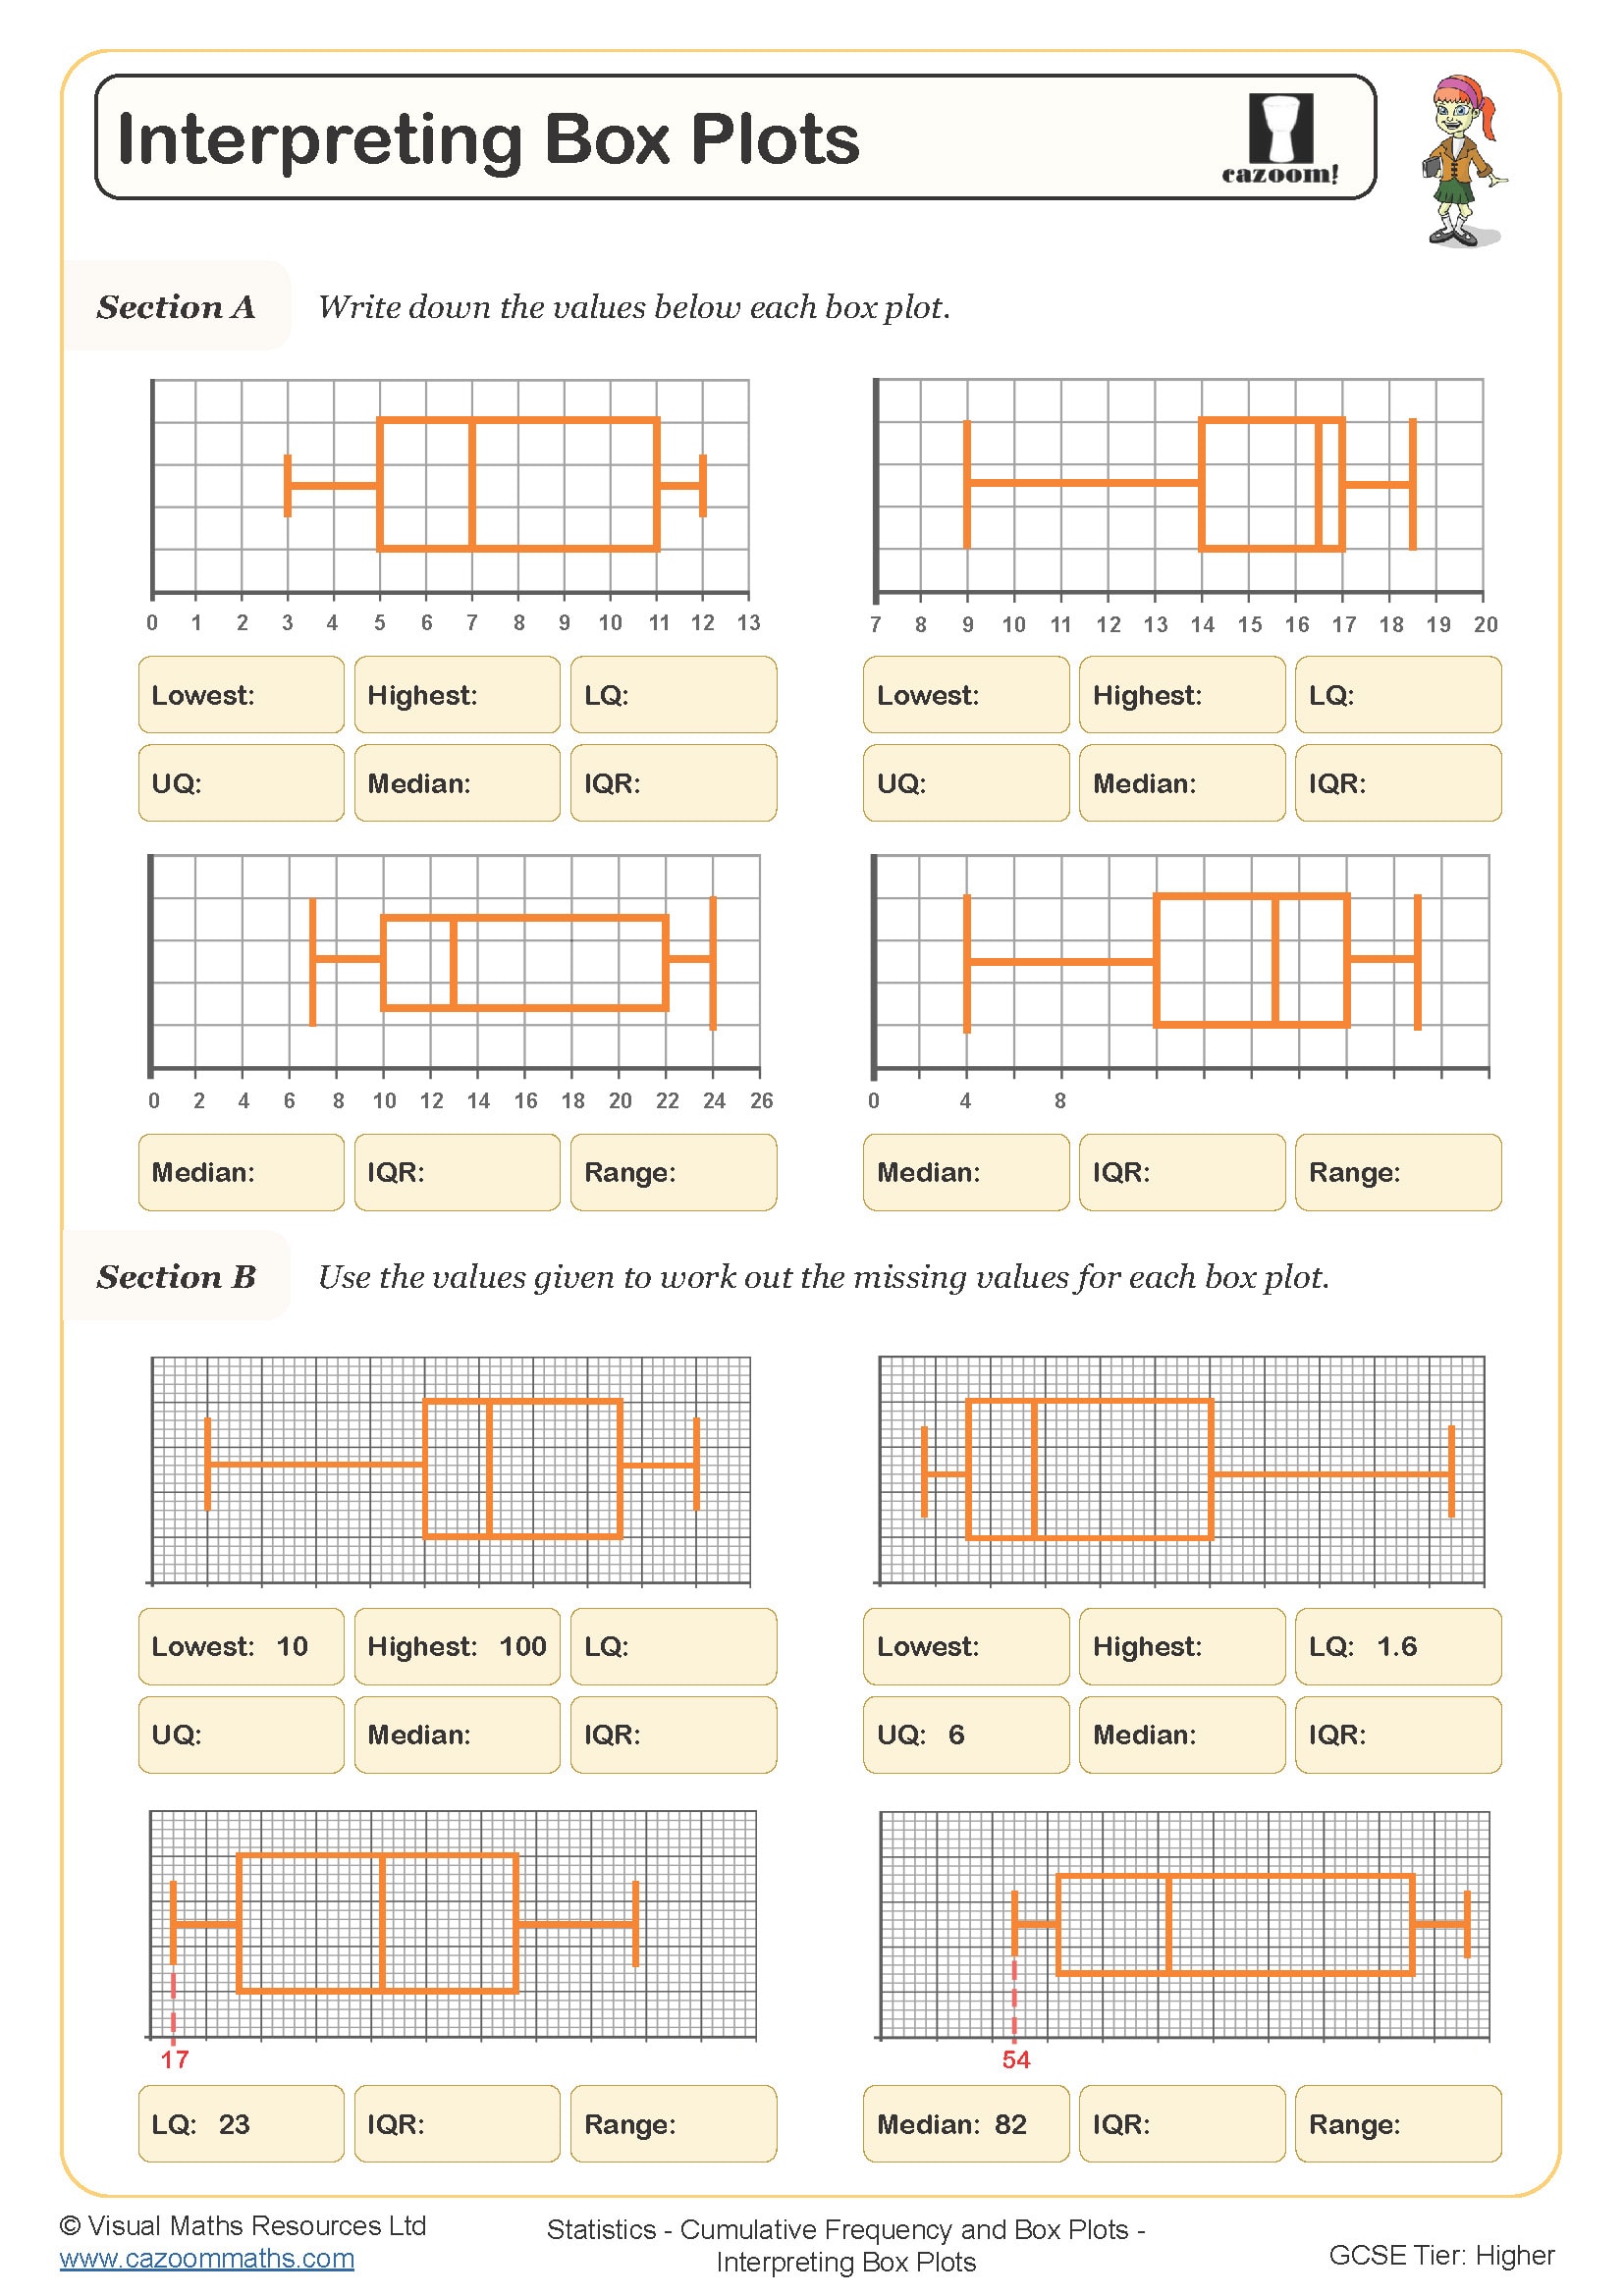
Interpreting Box Plots
Year groups: 10, 11
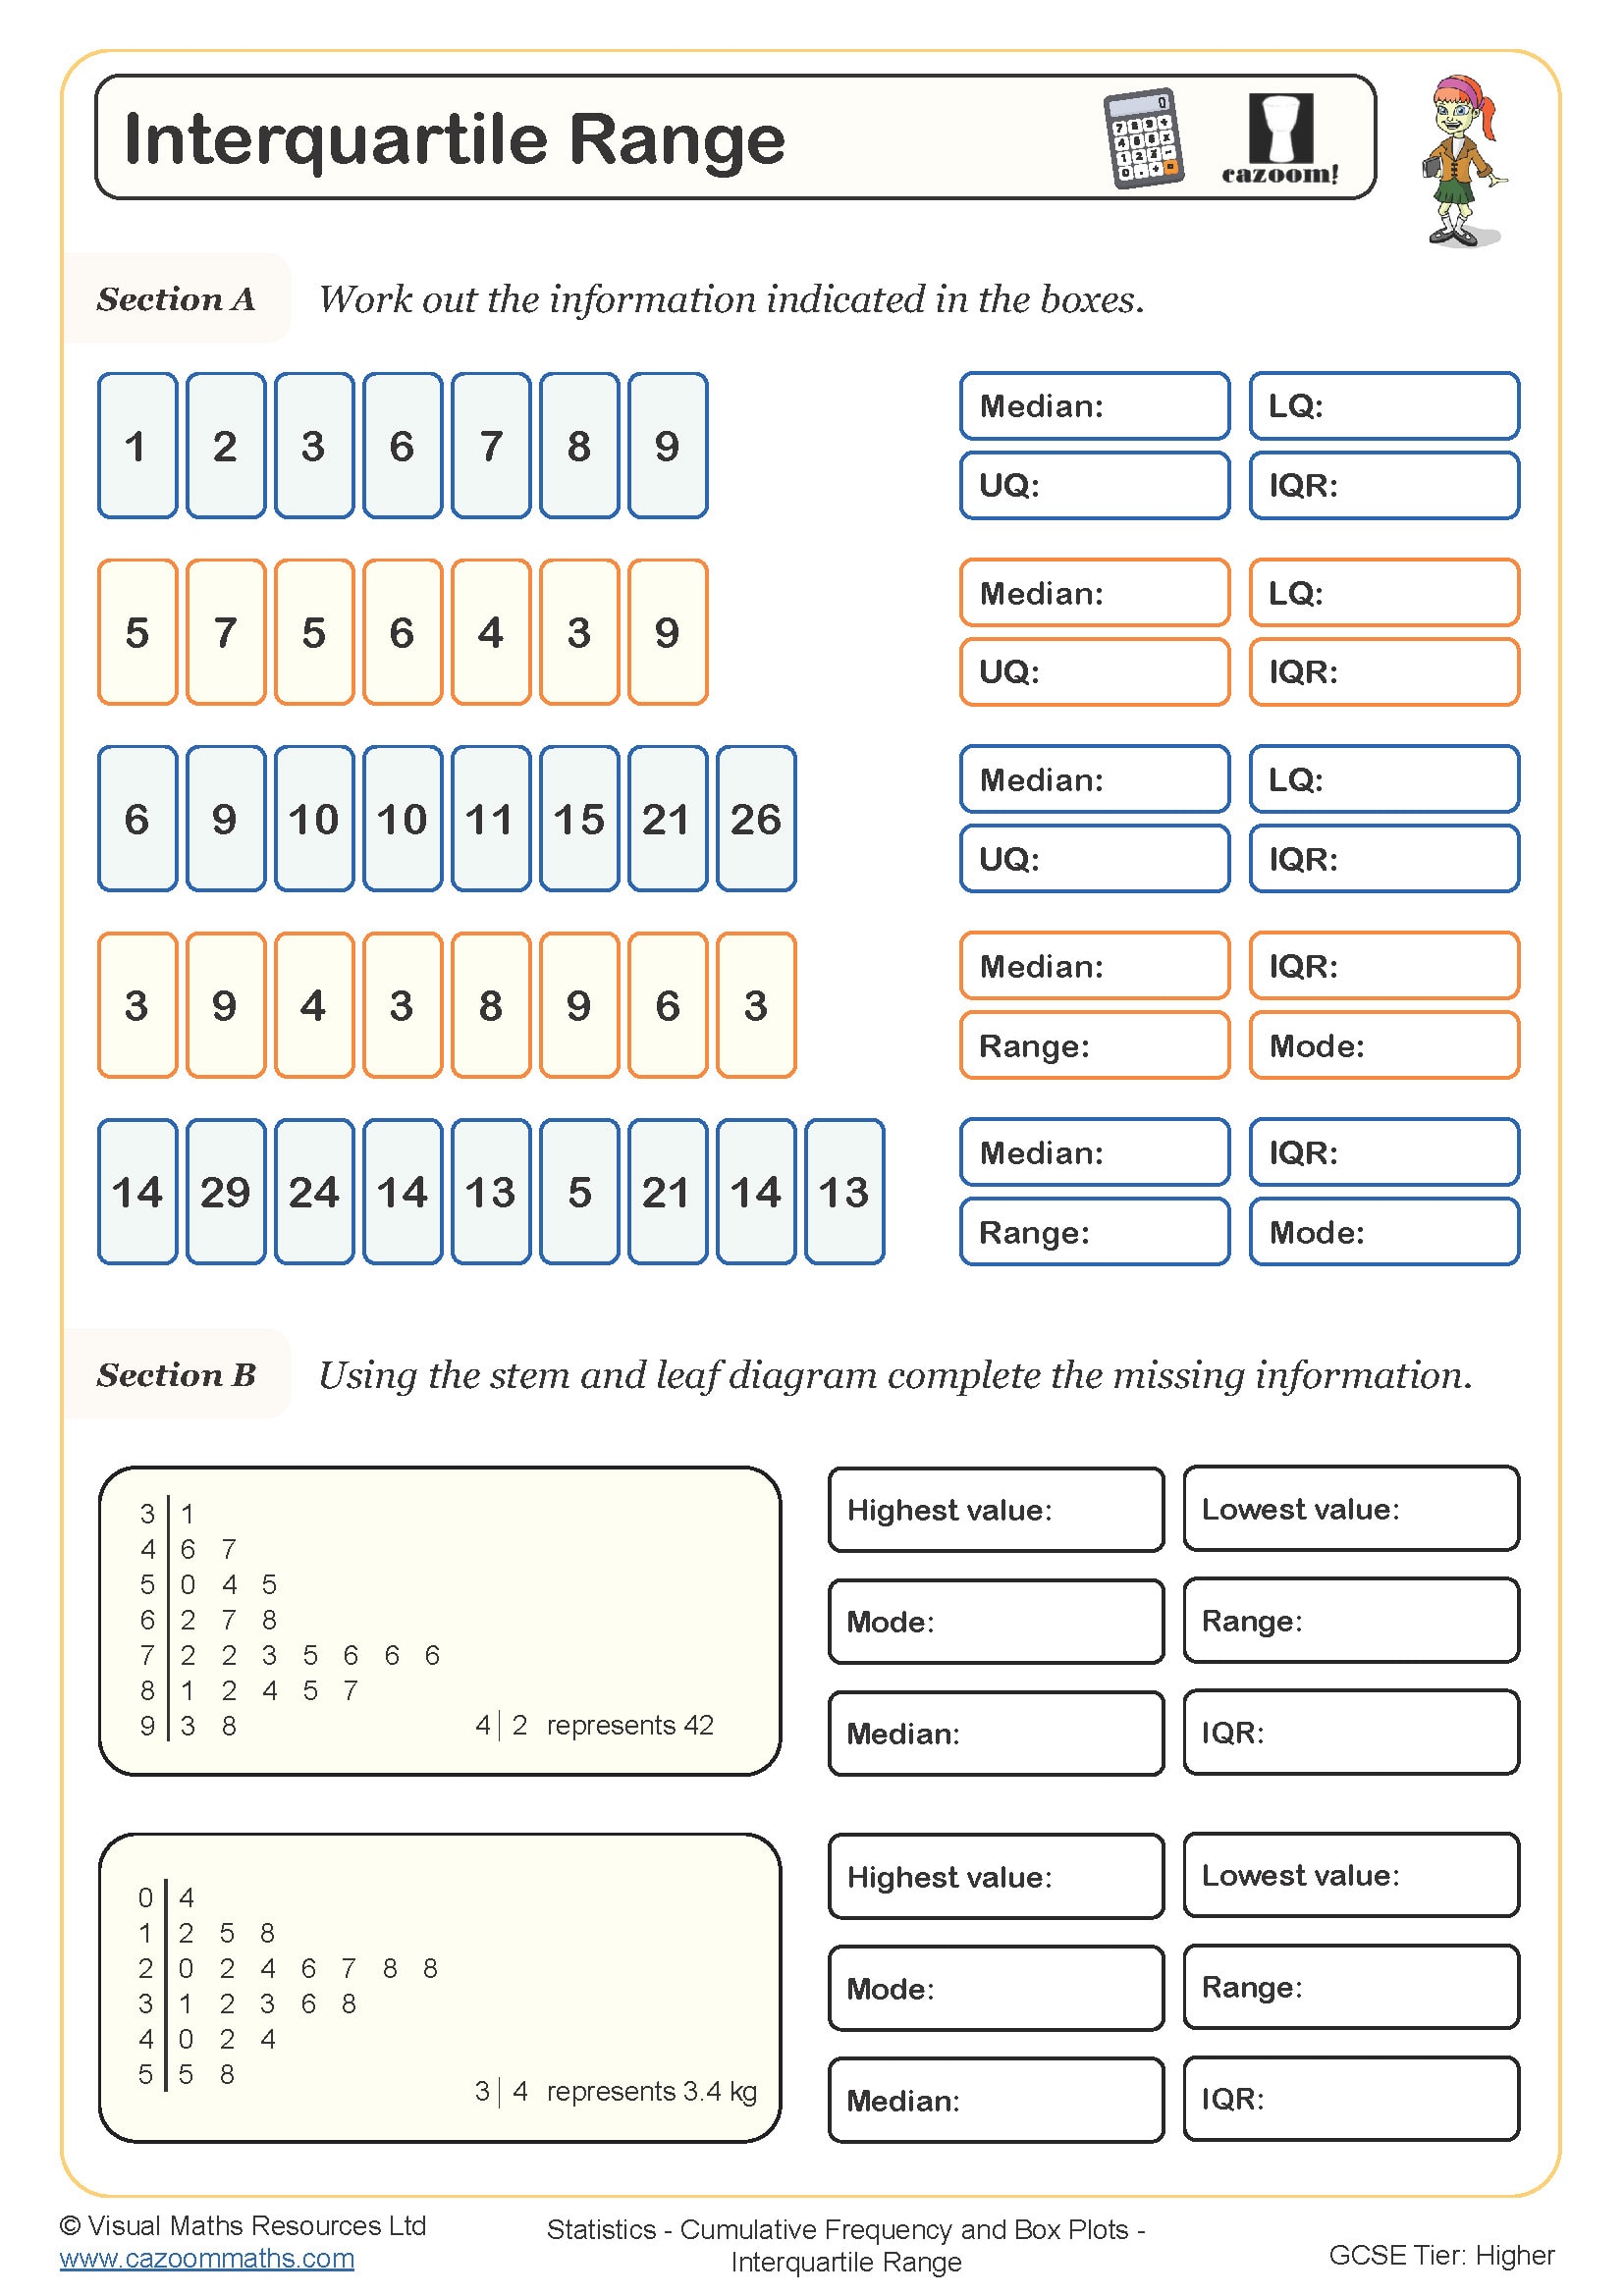
Interquartile Range
Year groups: 10, 11
Introducing Tree Diagrams for Independent Events (Fractions)
Year groups: 10, 11
-Questions-Worksheet.jpg?w=3840)
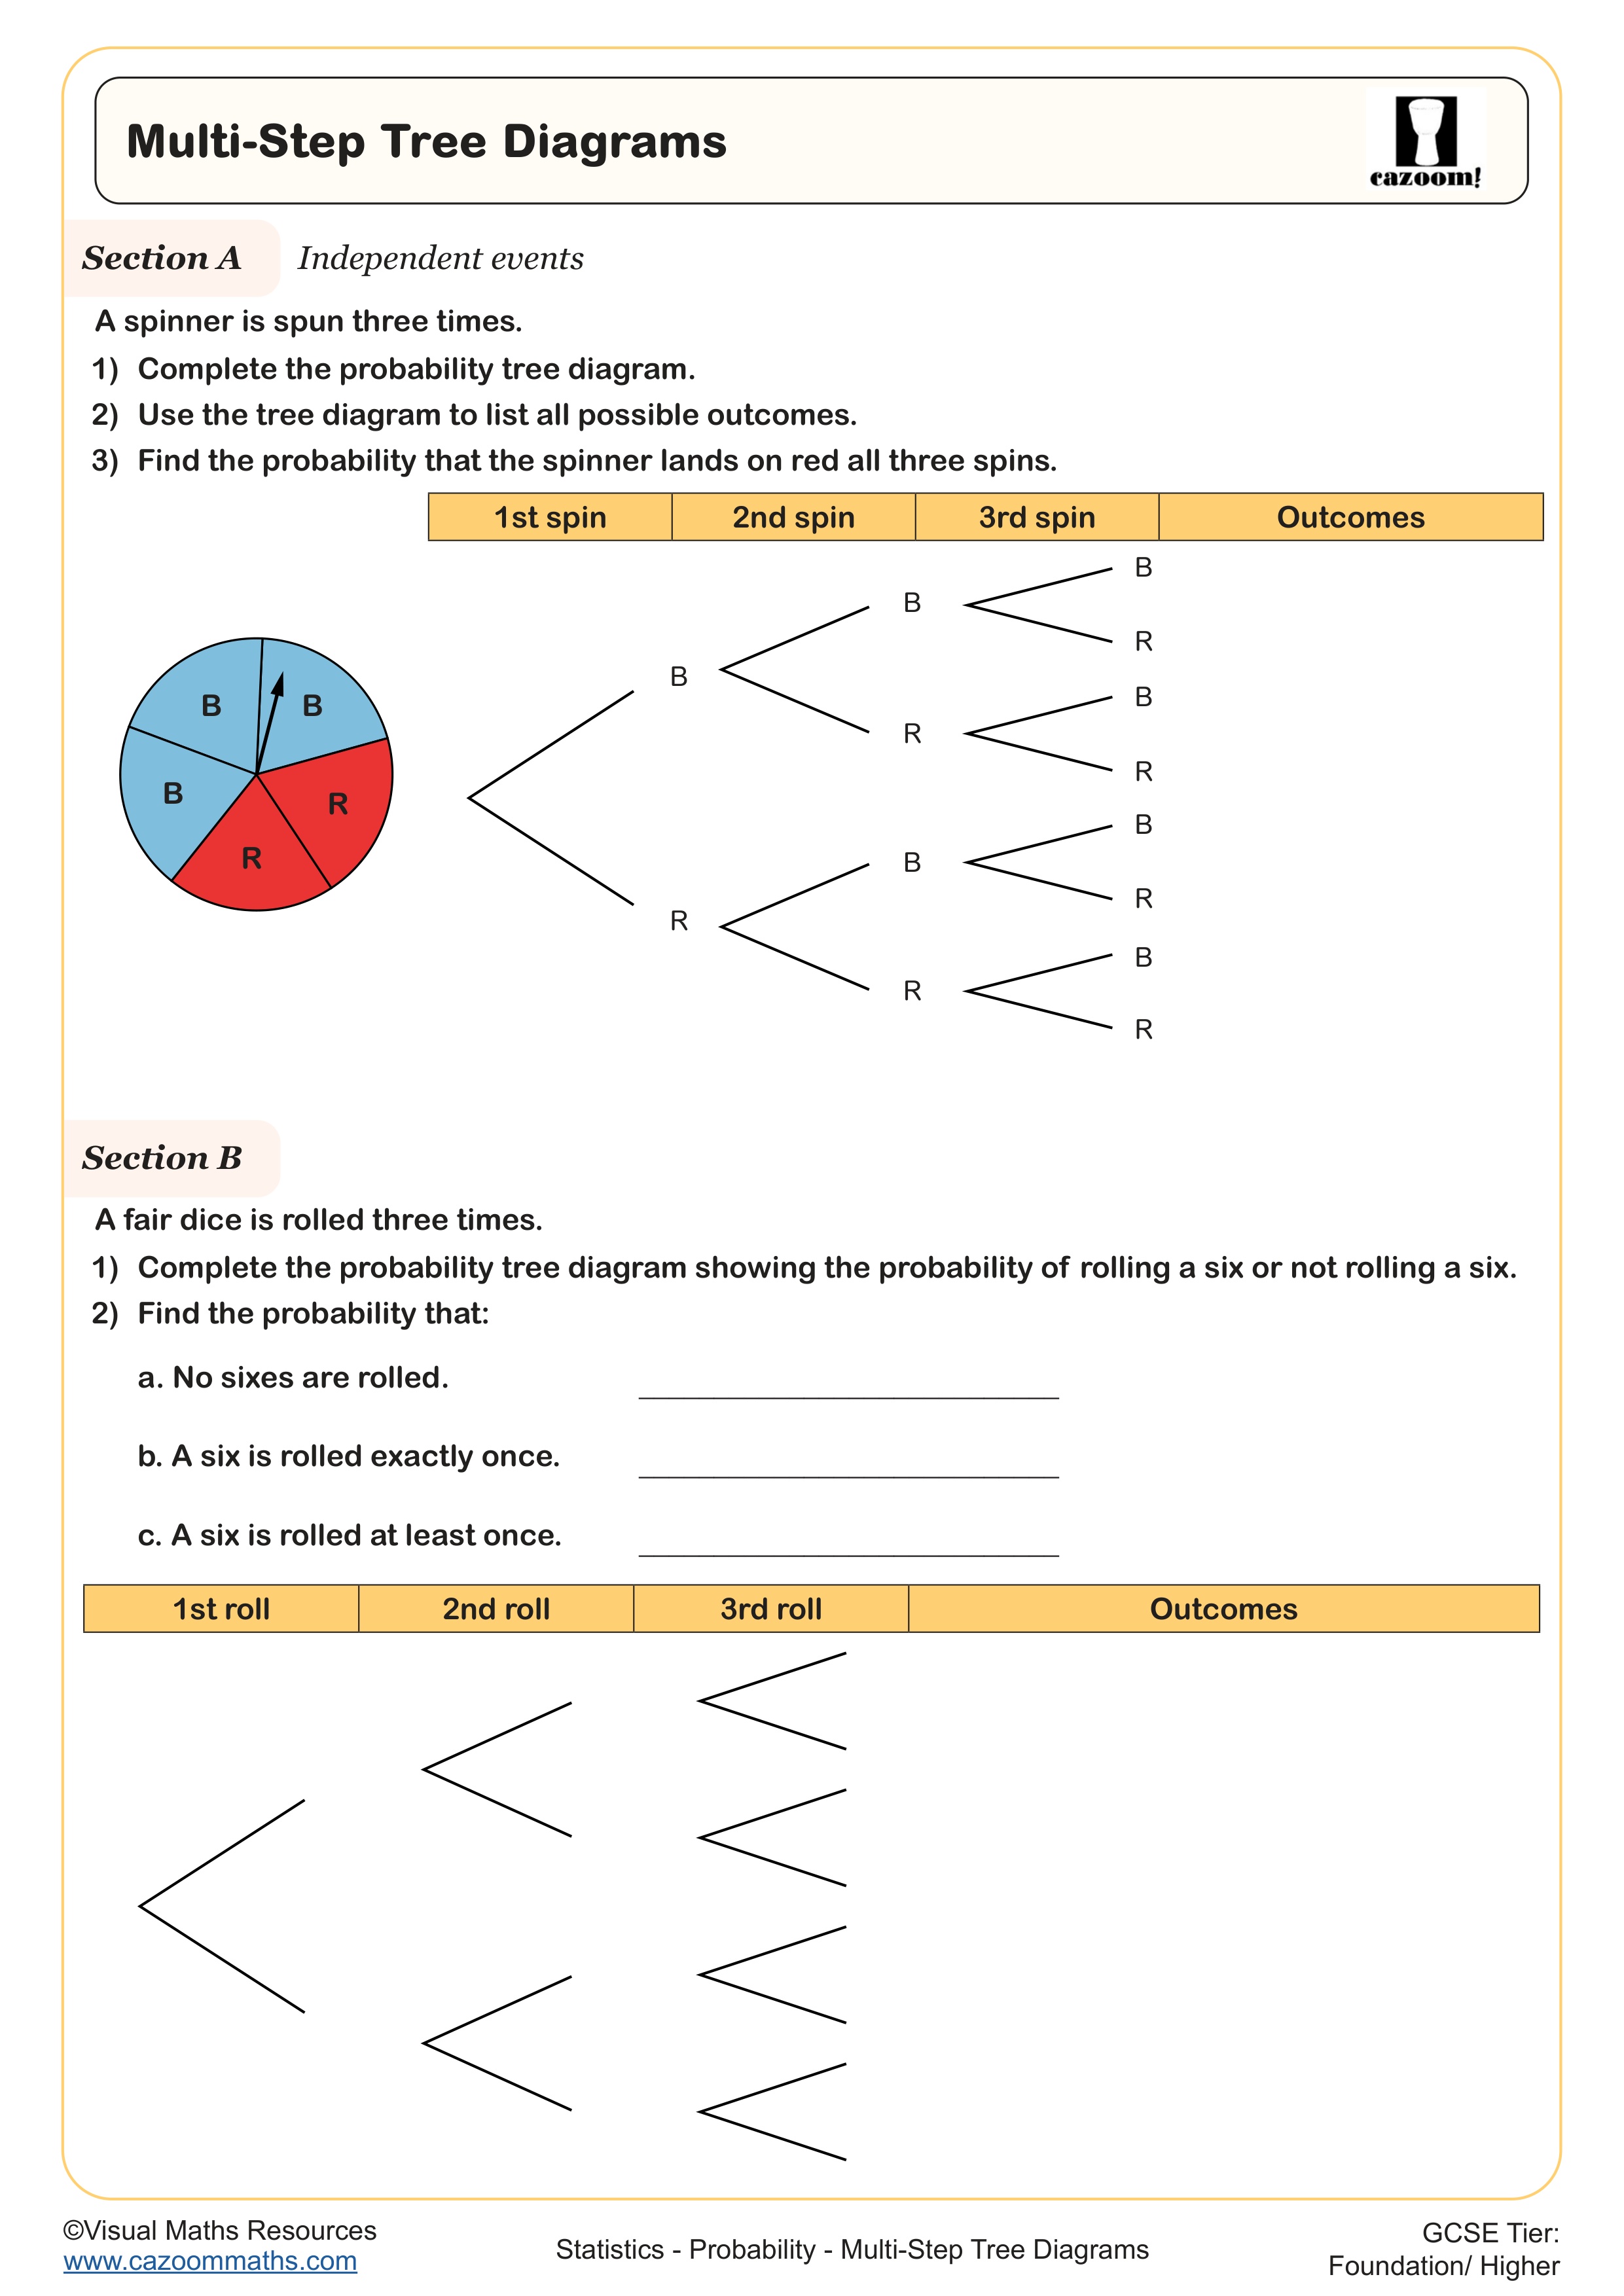
Multi-Step Tree Diagrams
Year groups: 10, 11
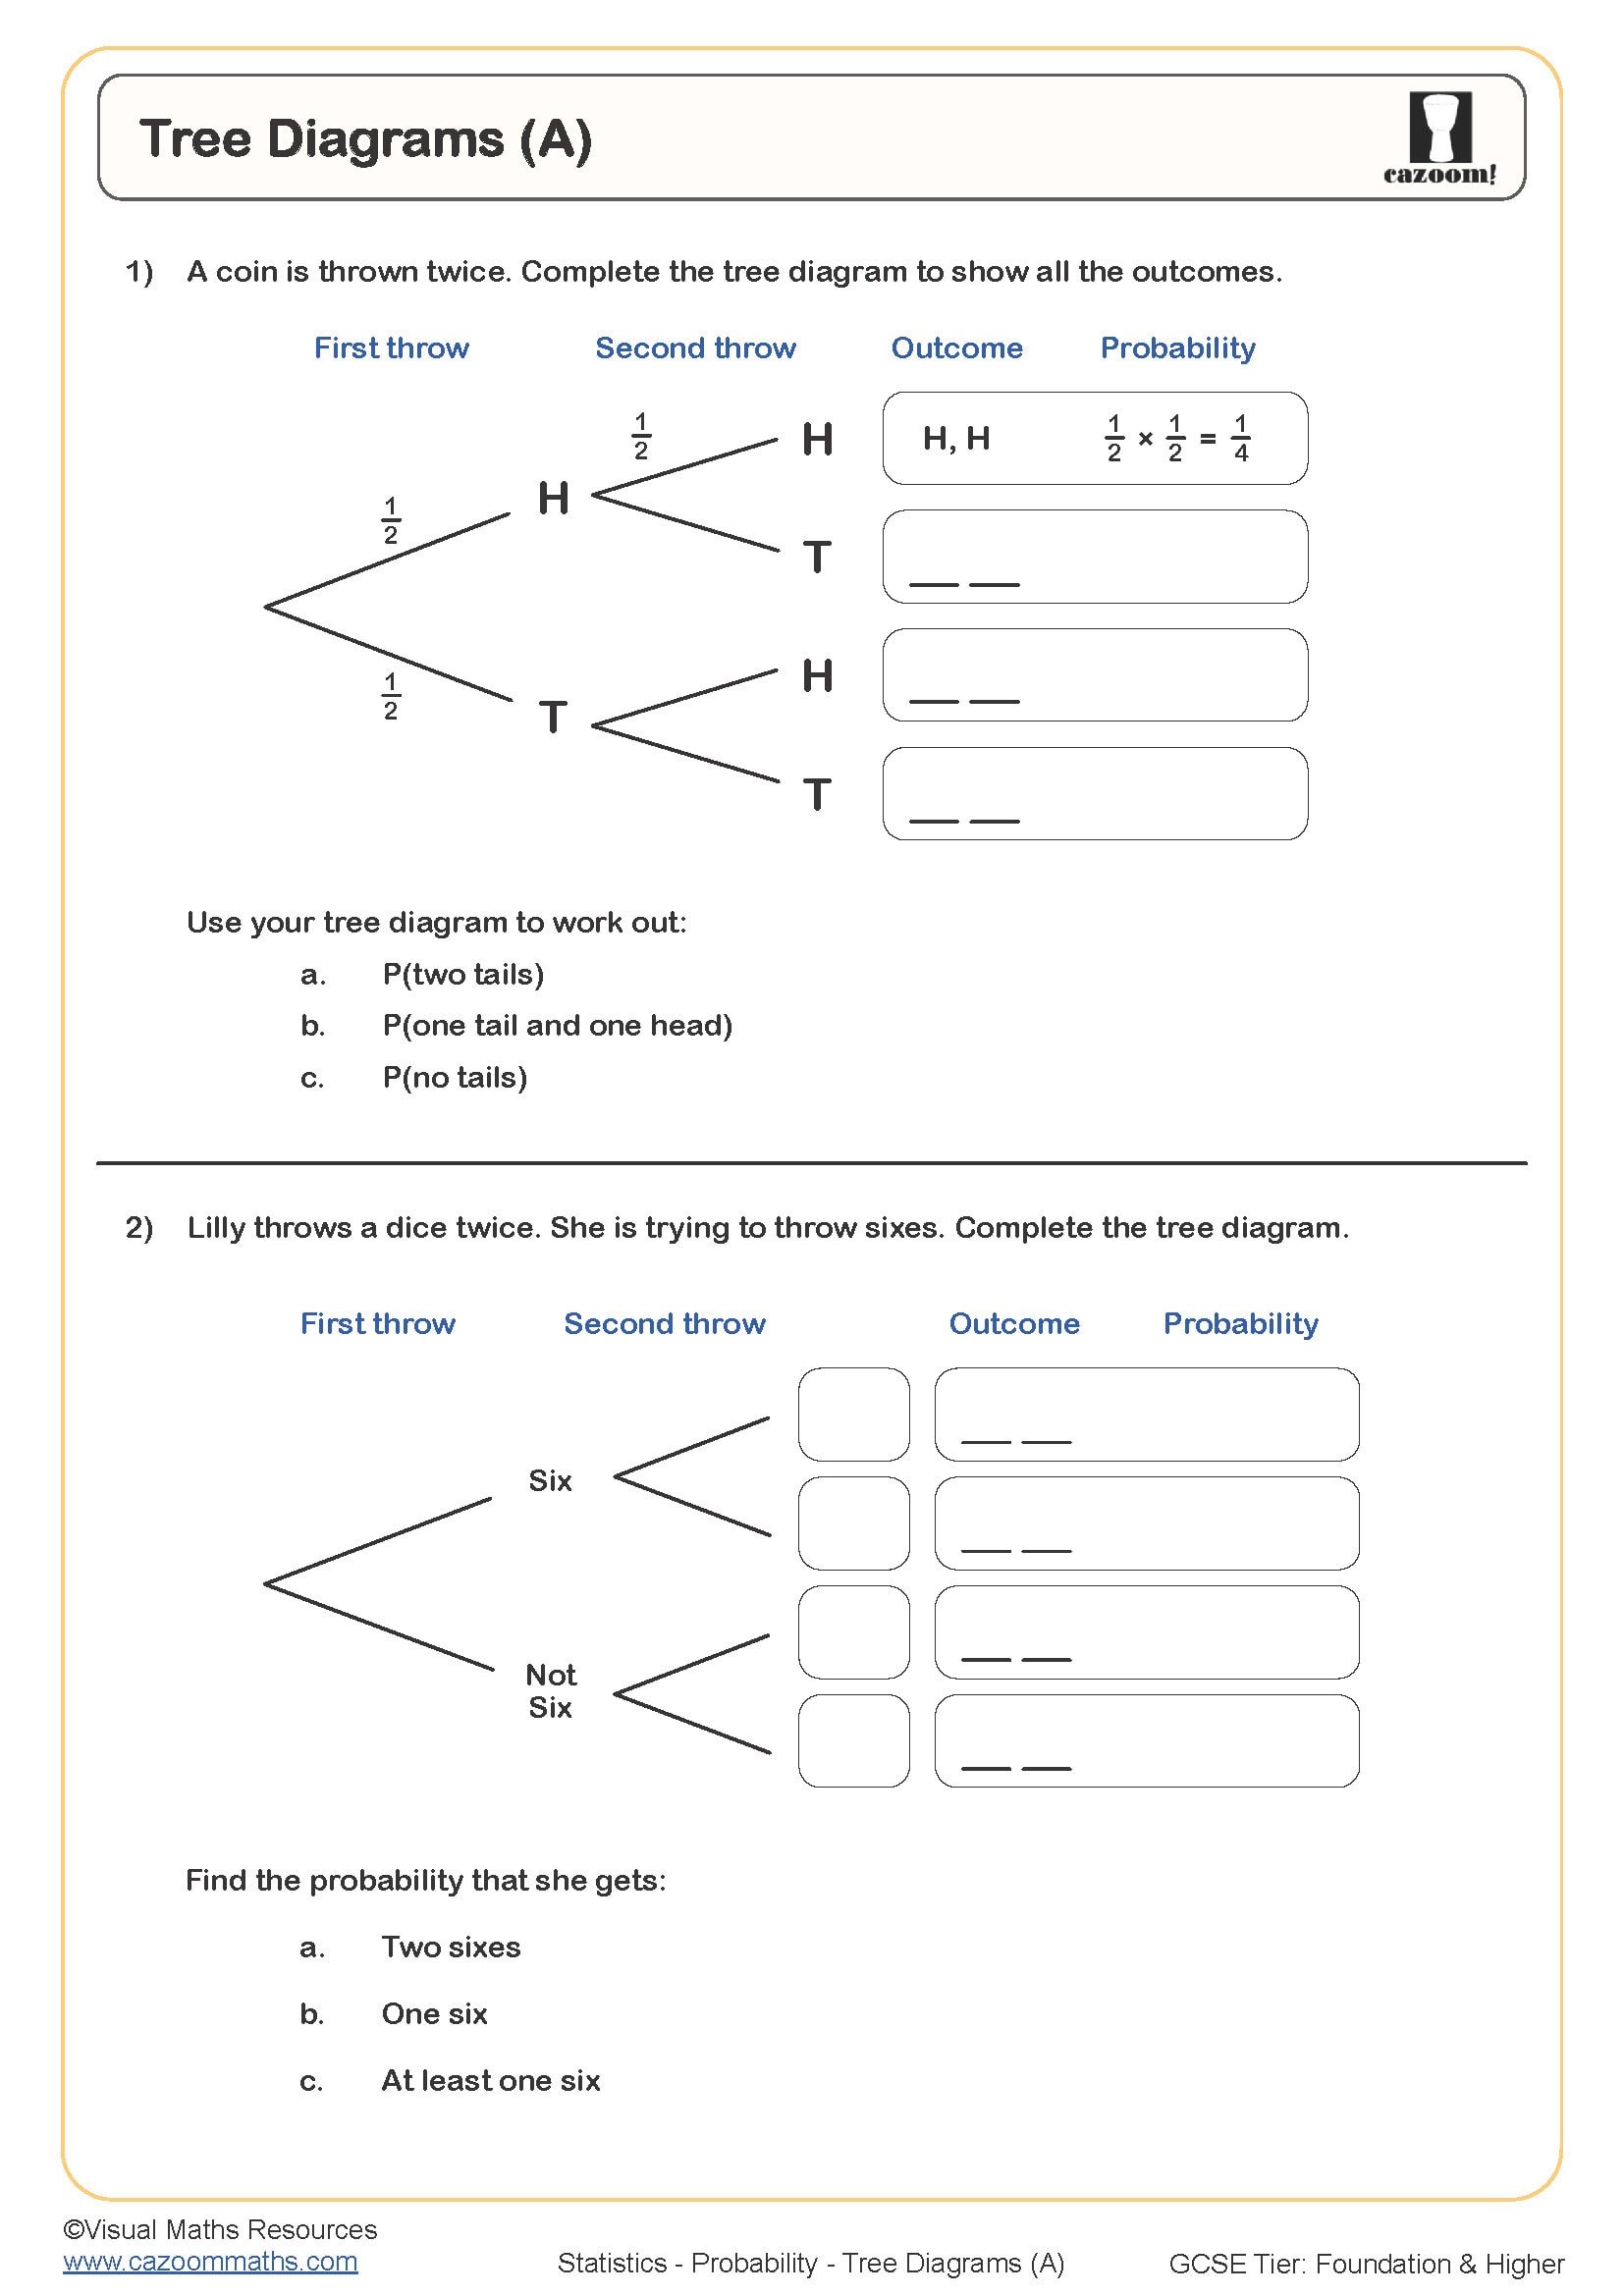
Tree Diagrams (A)
Year groups: 10, 11
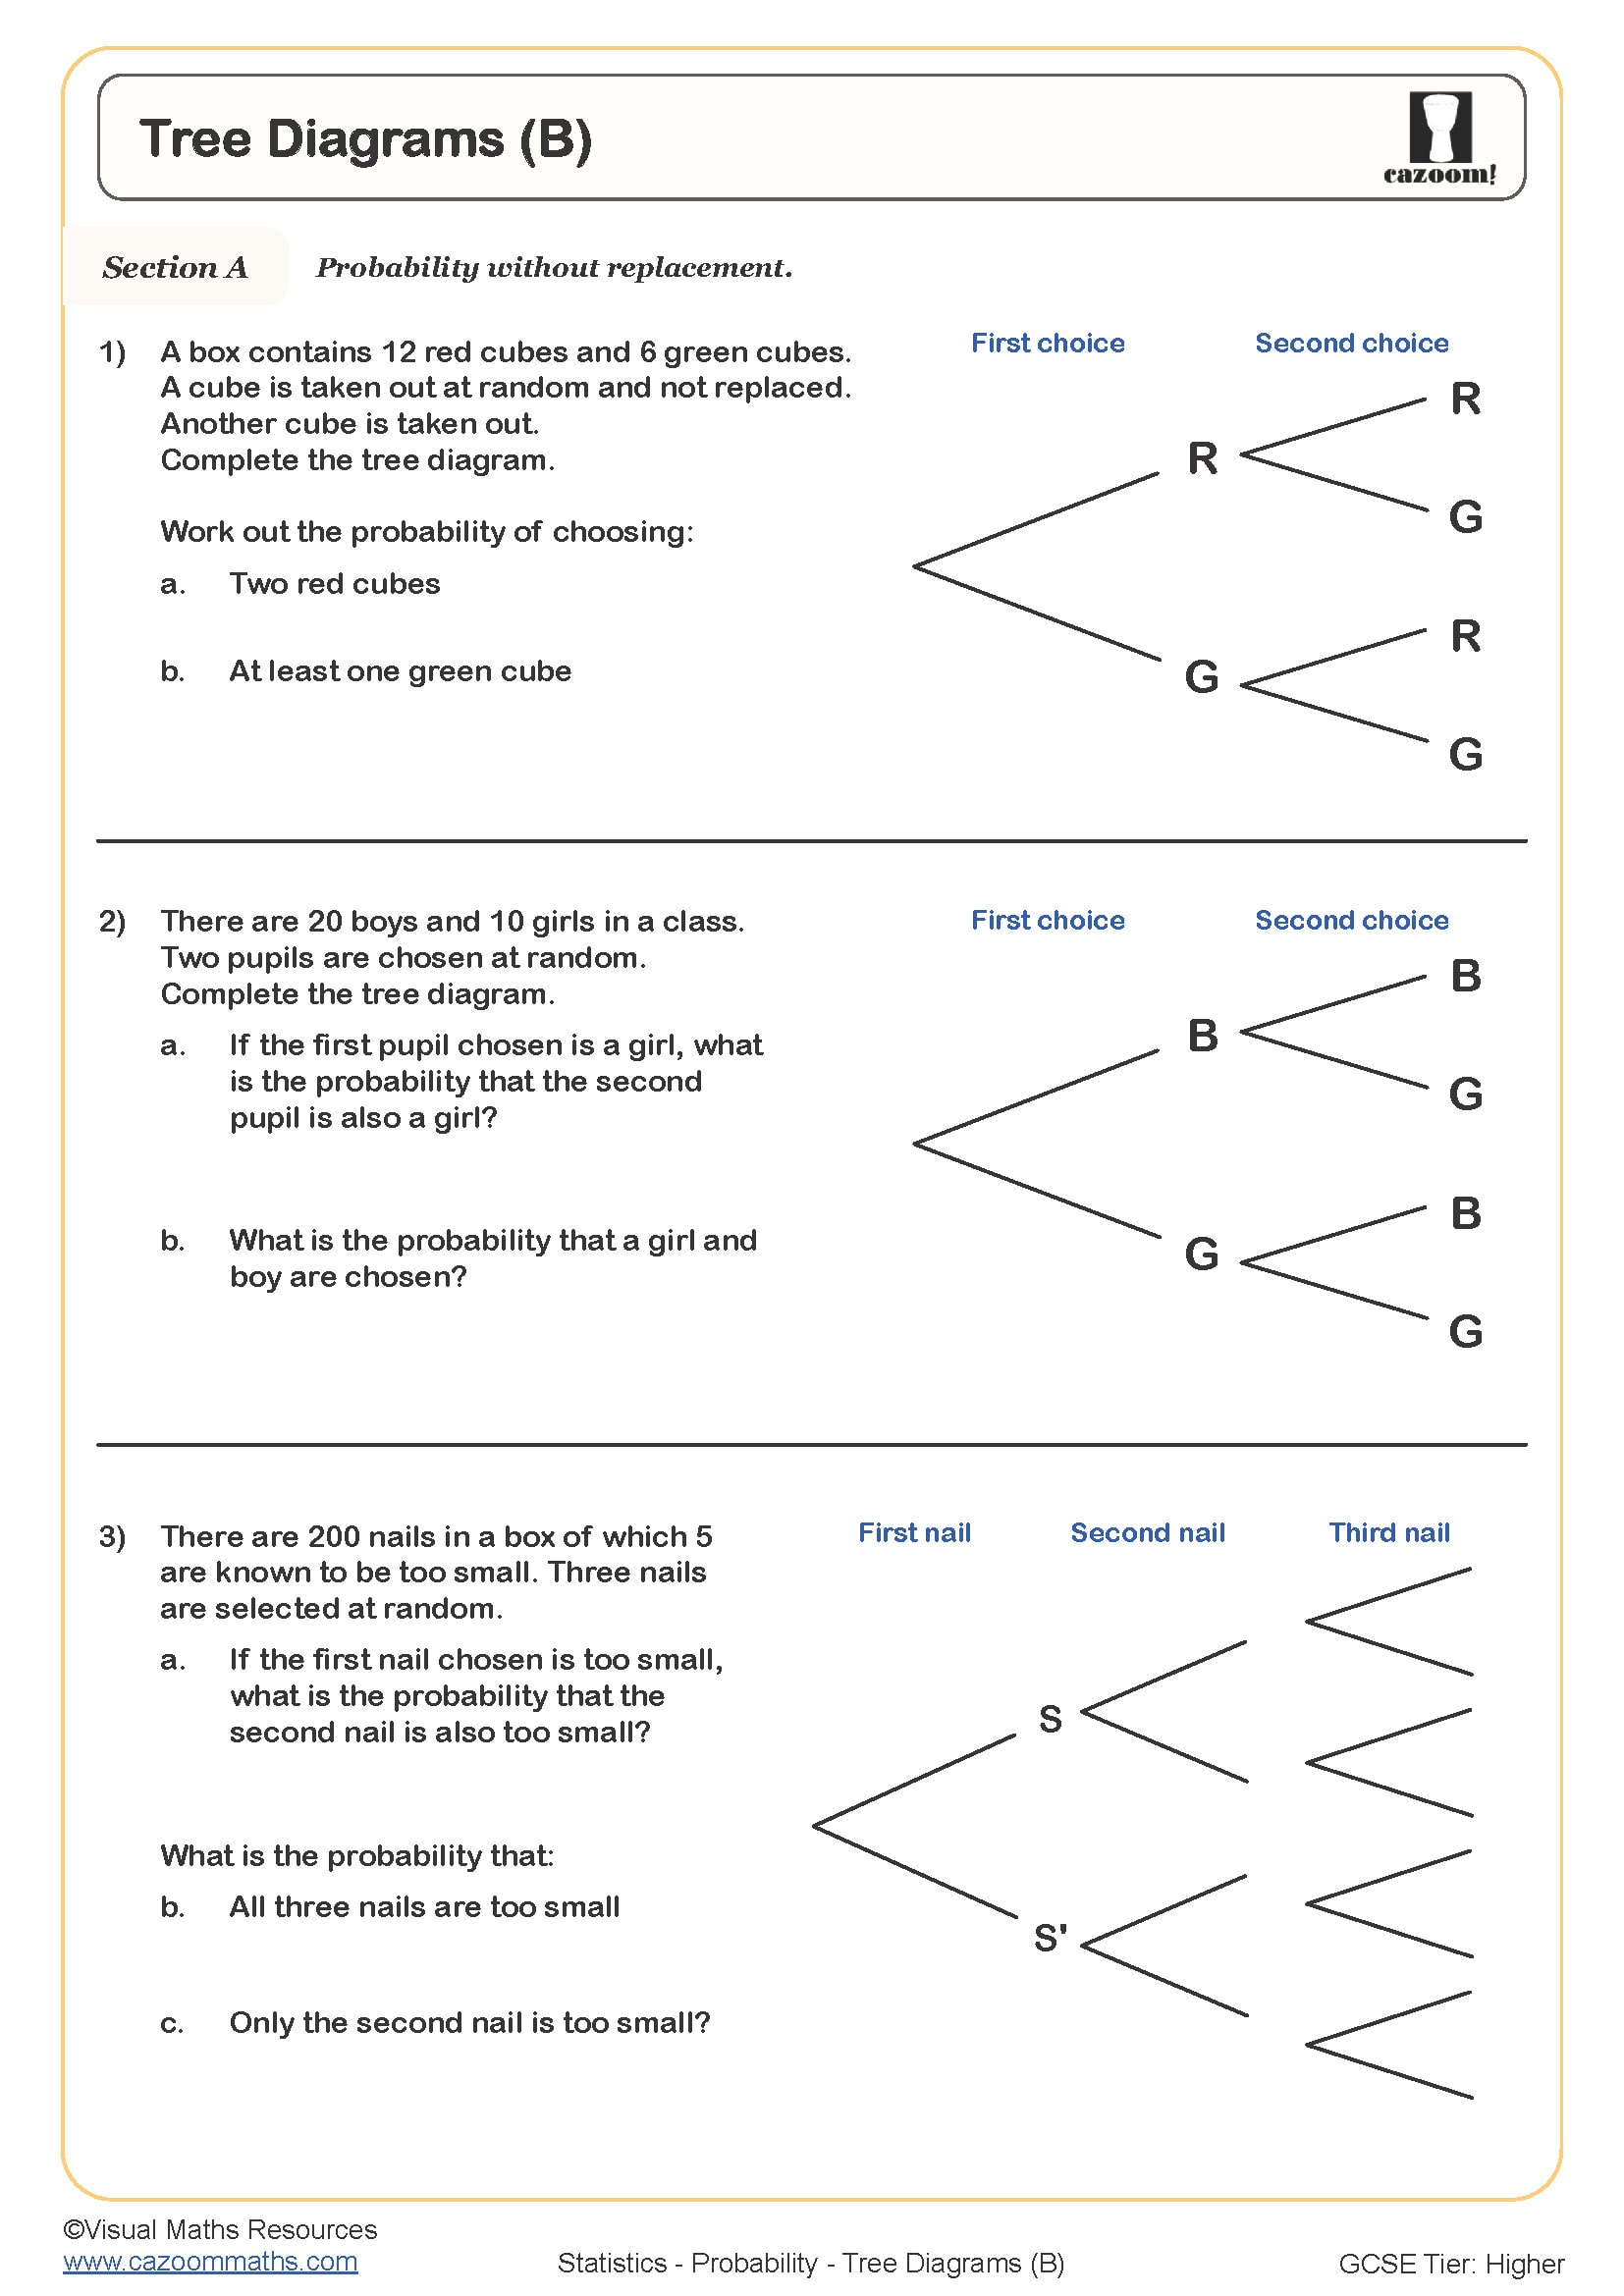
Tree Diagrams (B)
Year groups: 10, 11
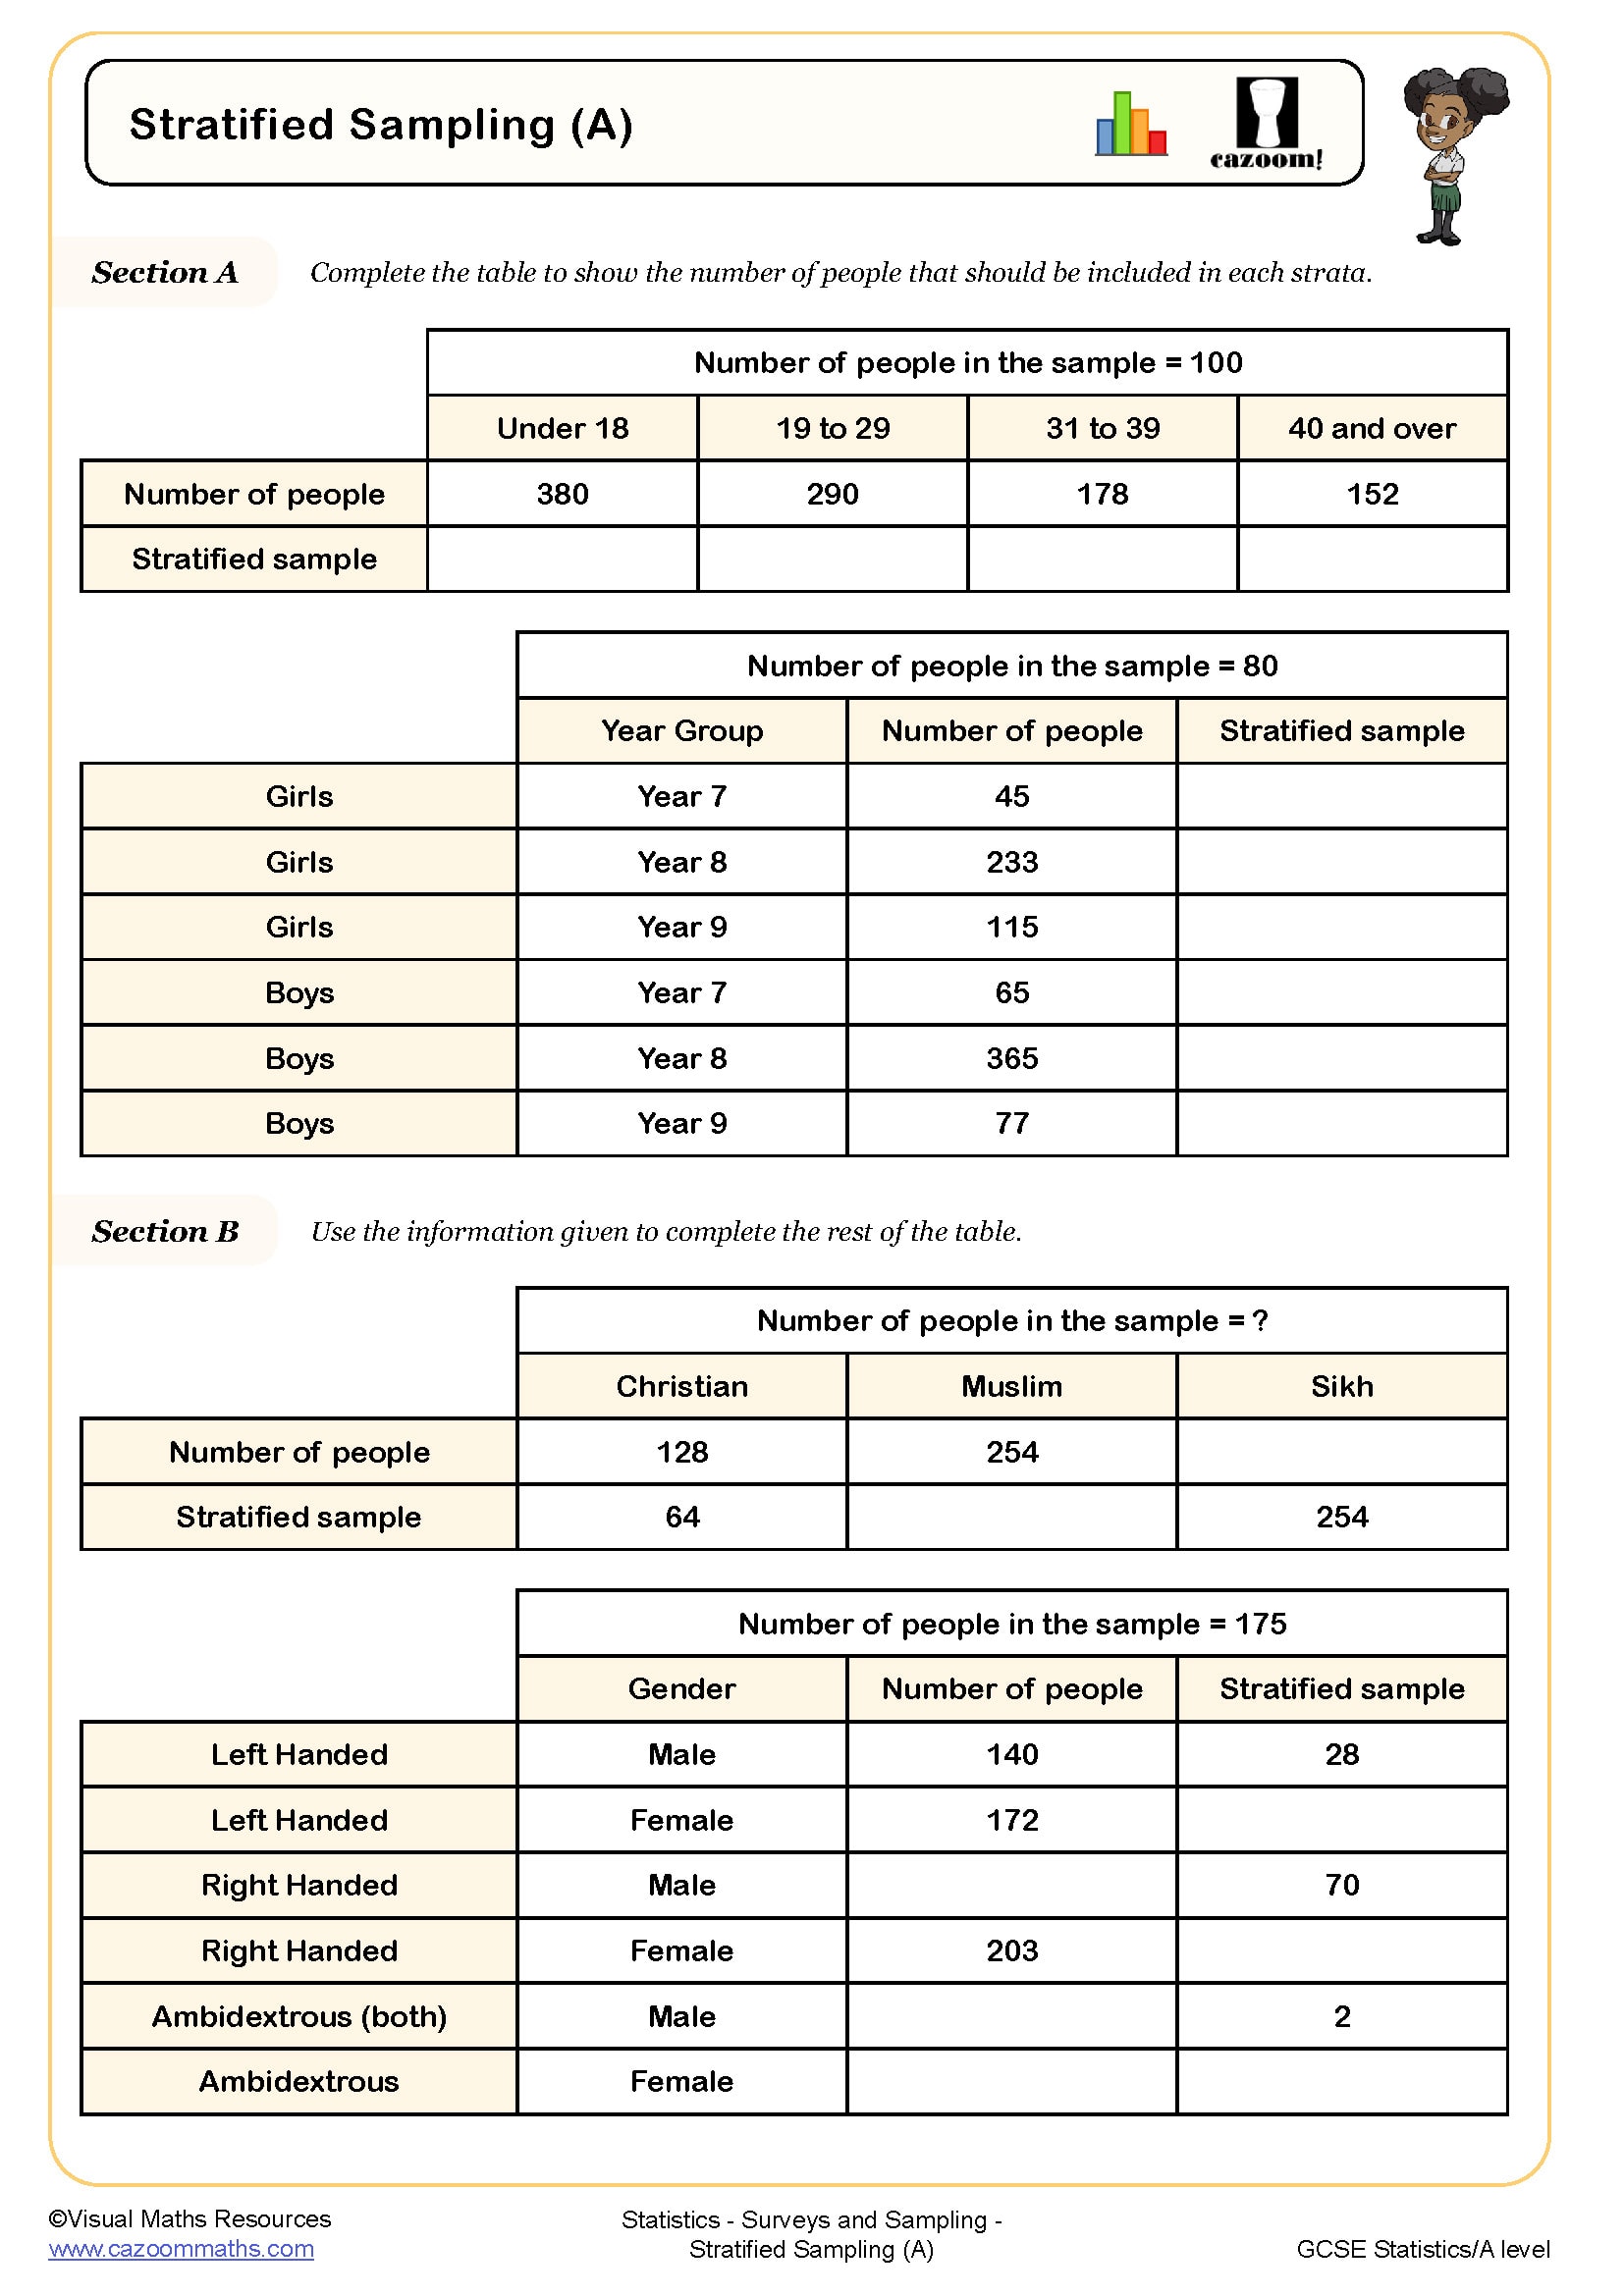
Stratified Sampling (A)
Year groups: 11
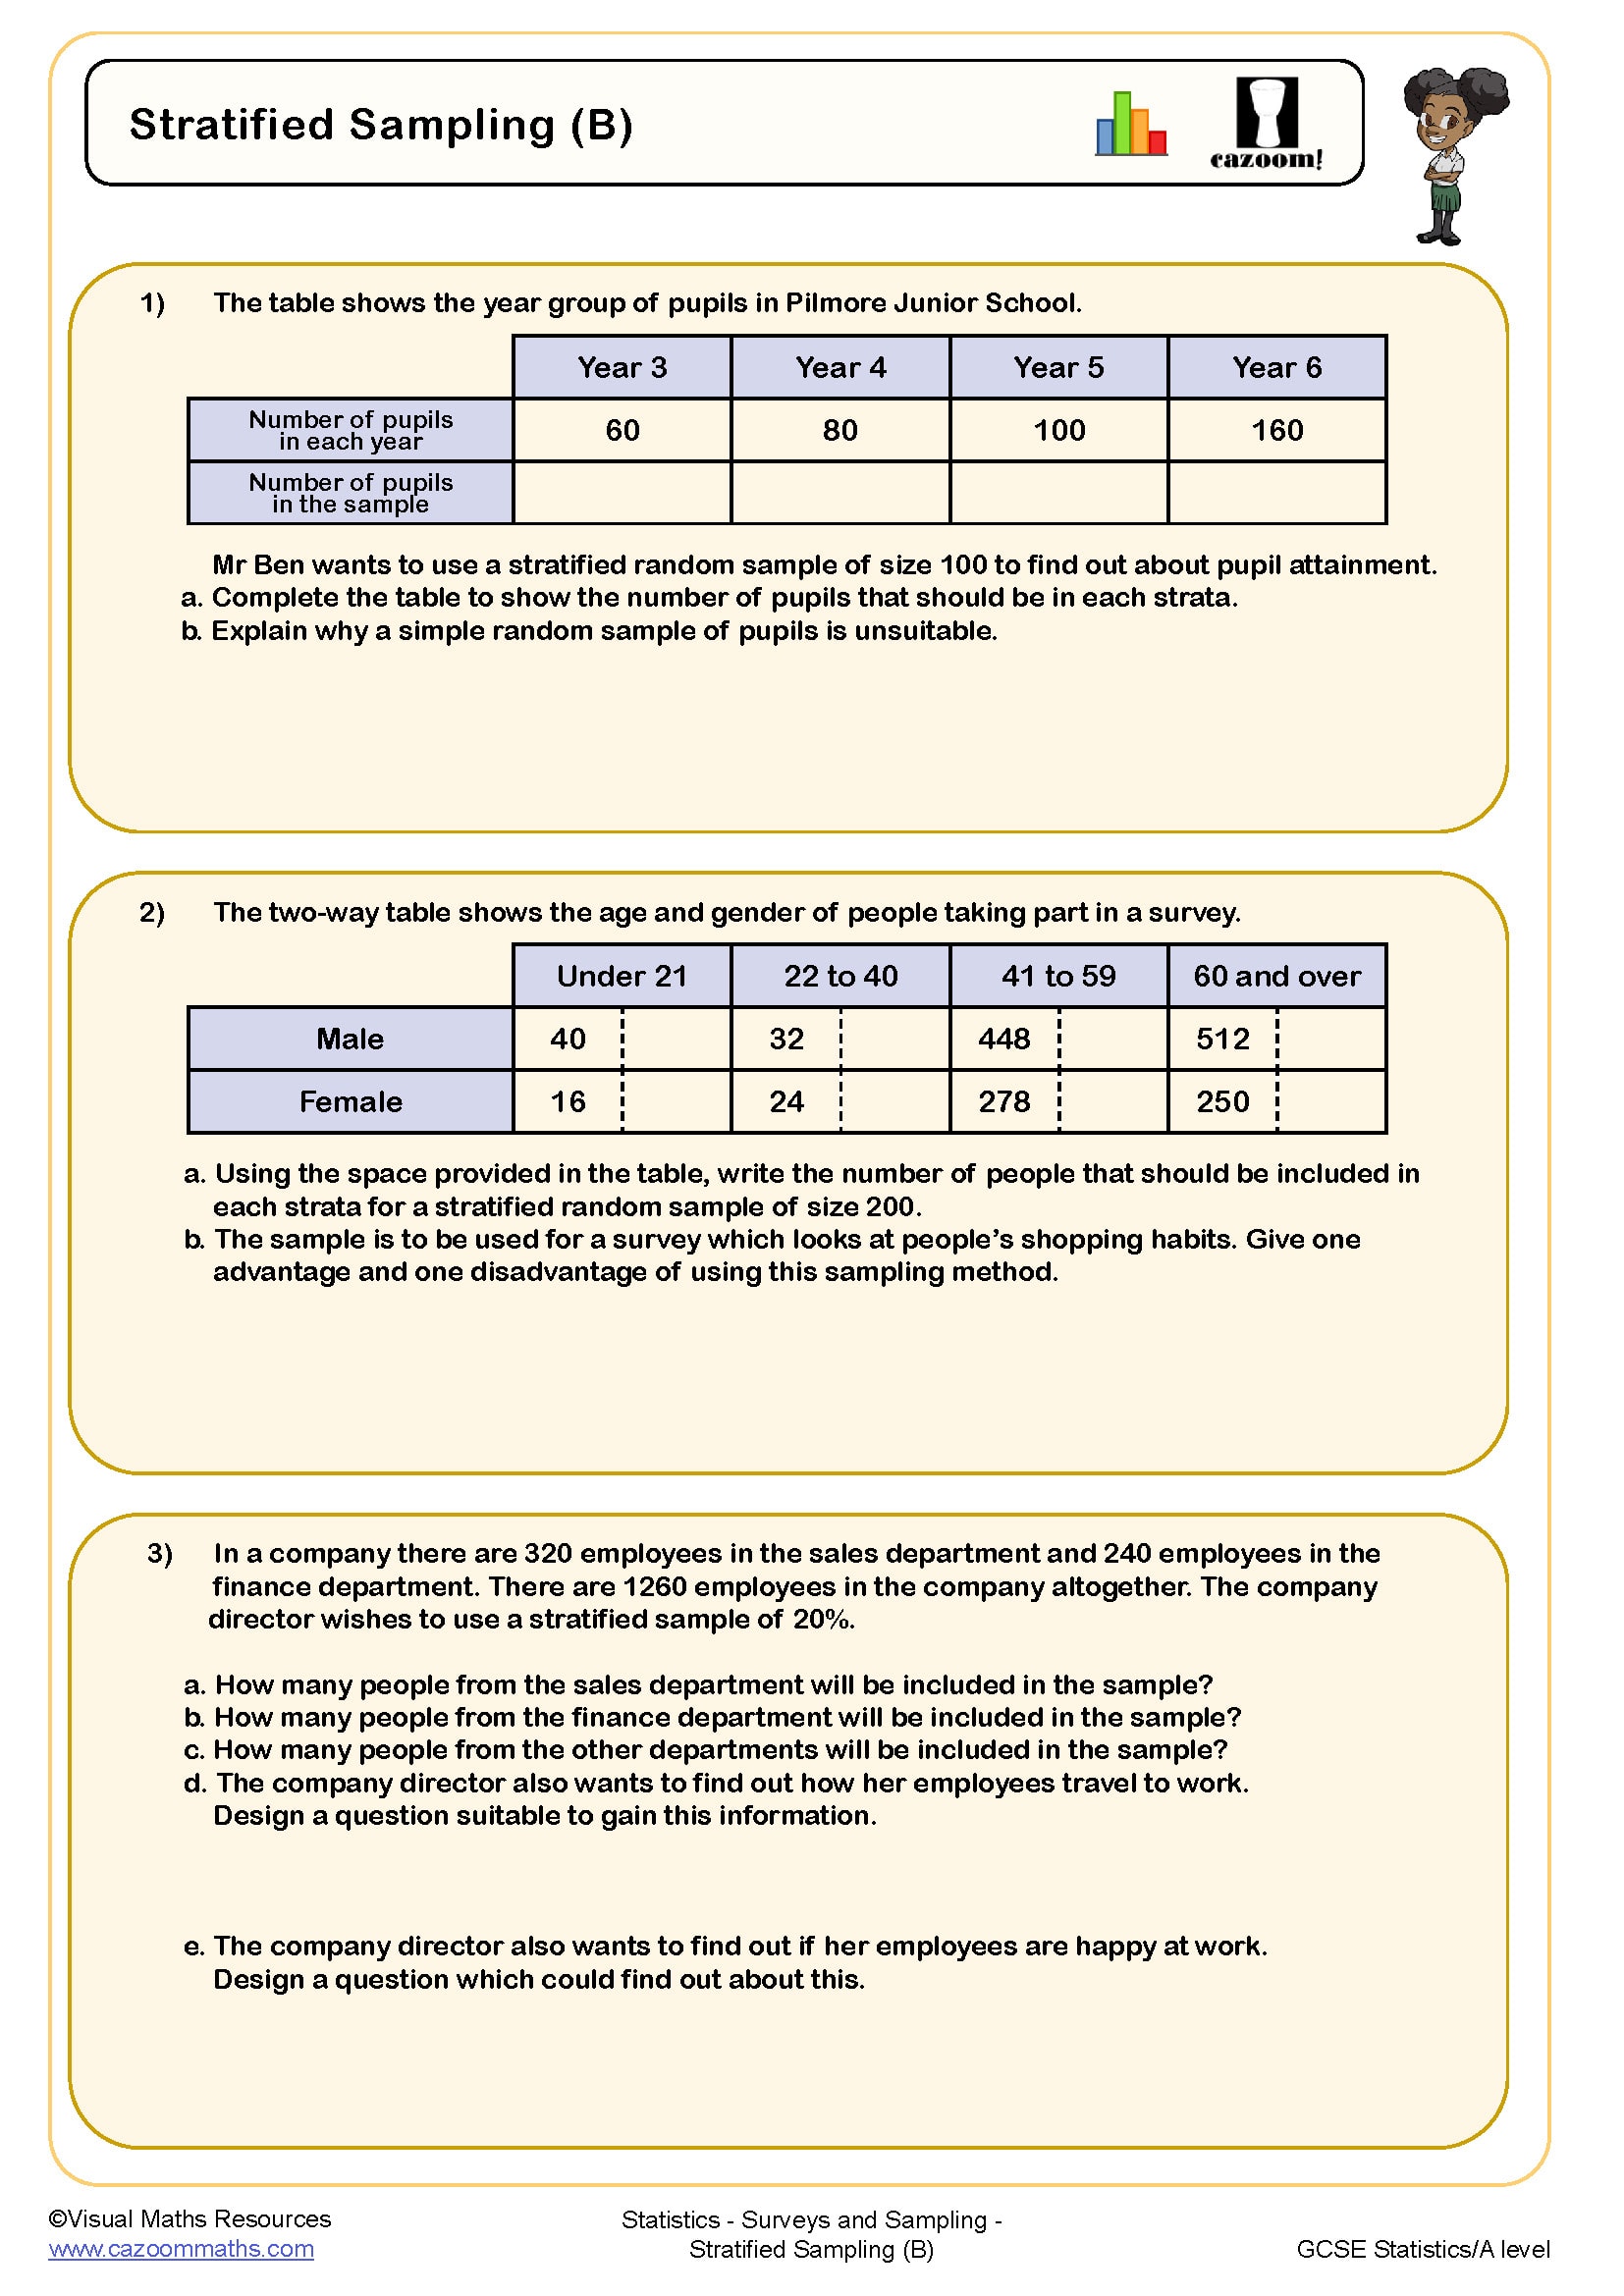
Stratified Sampling (B)
Year groups: 11
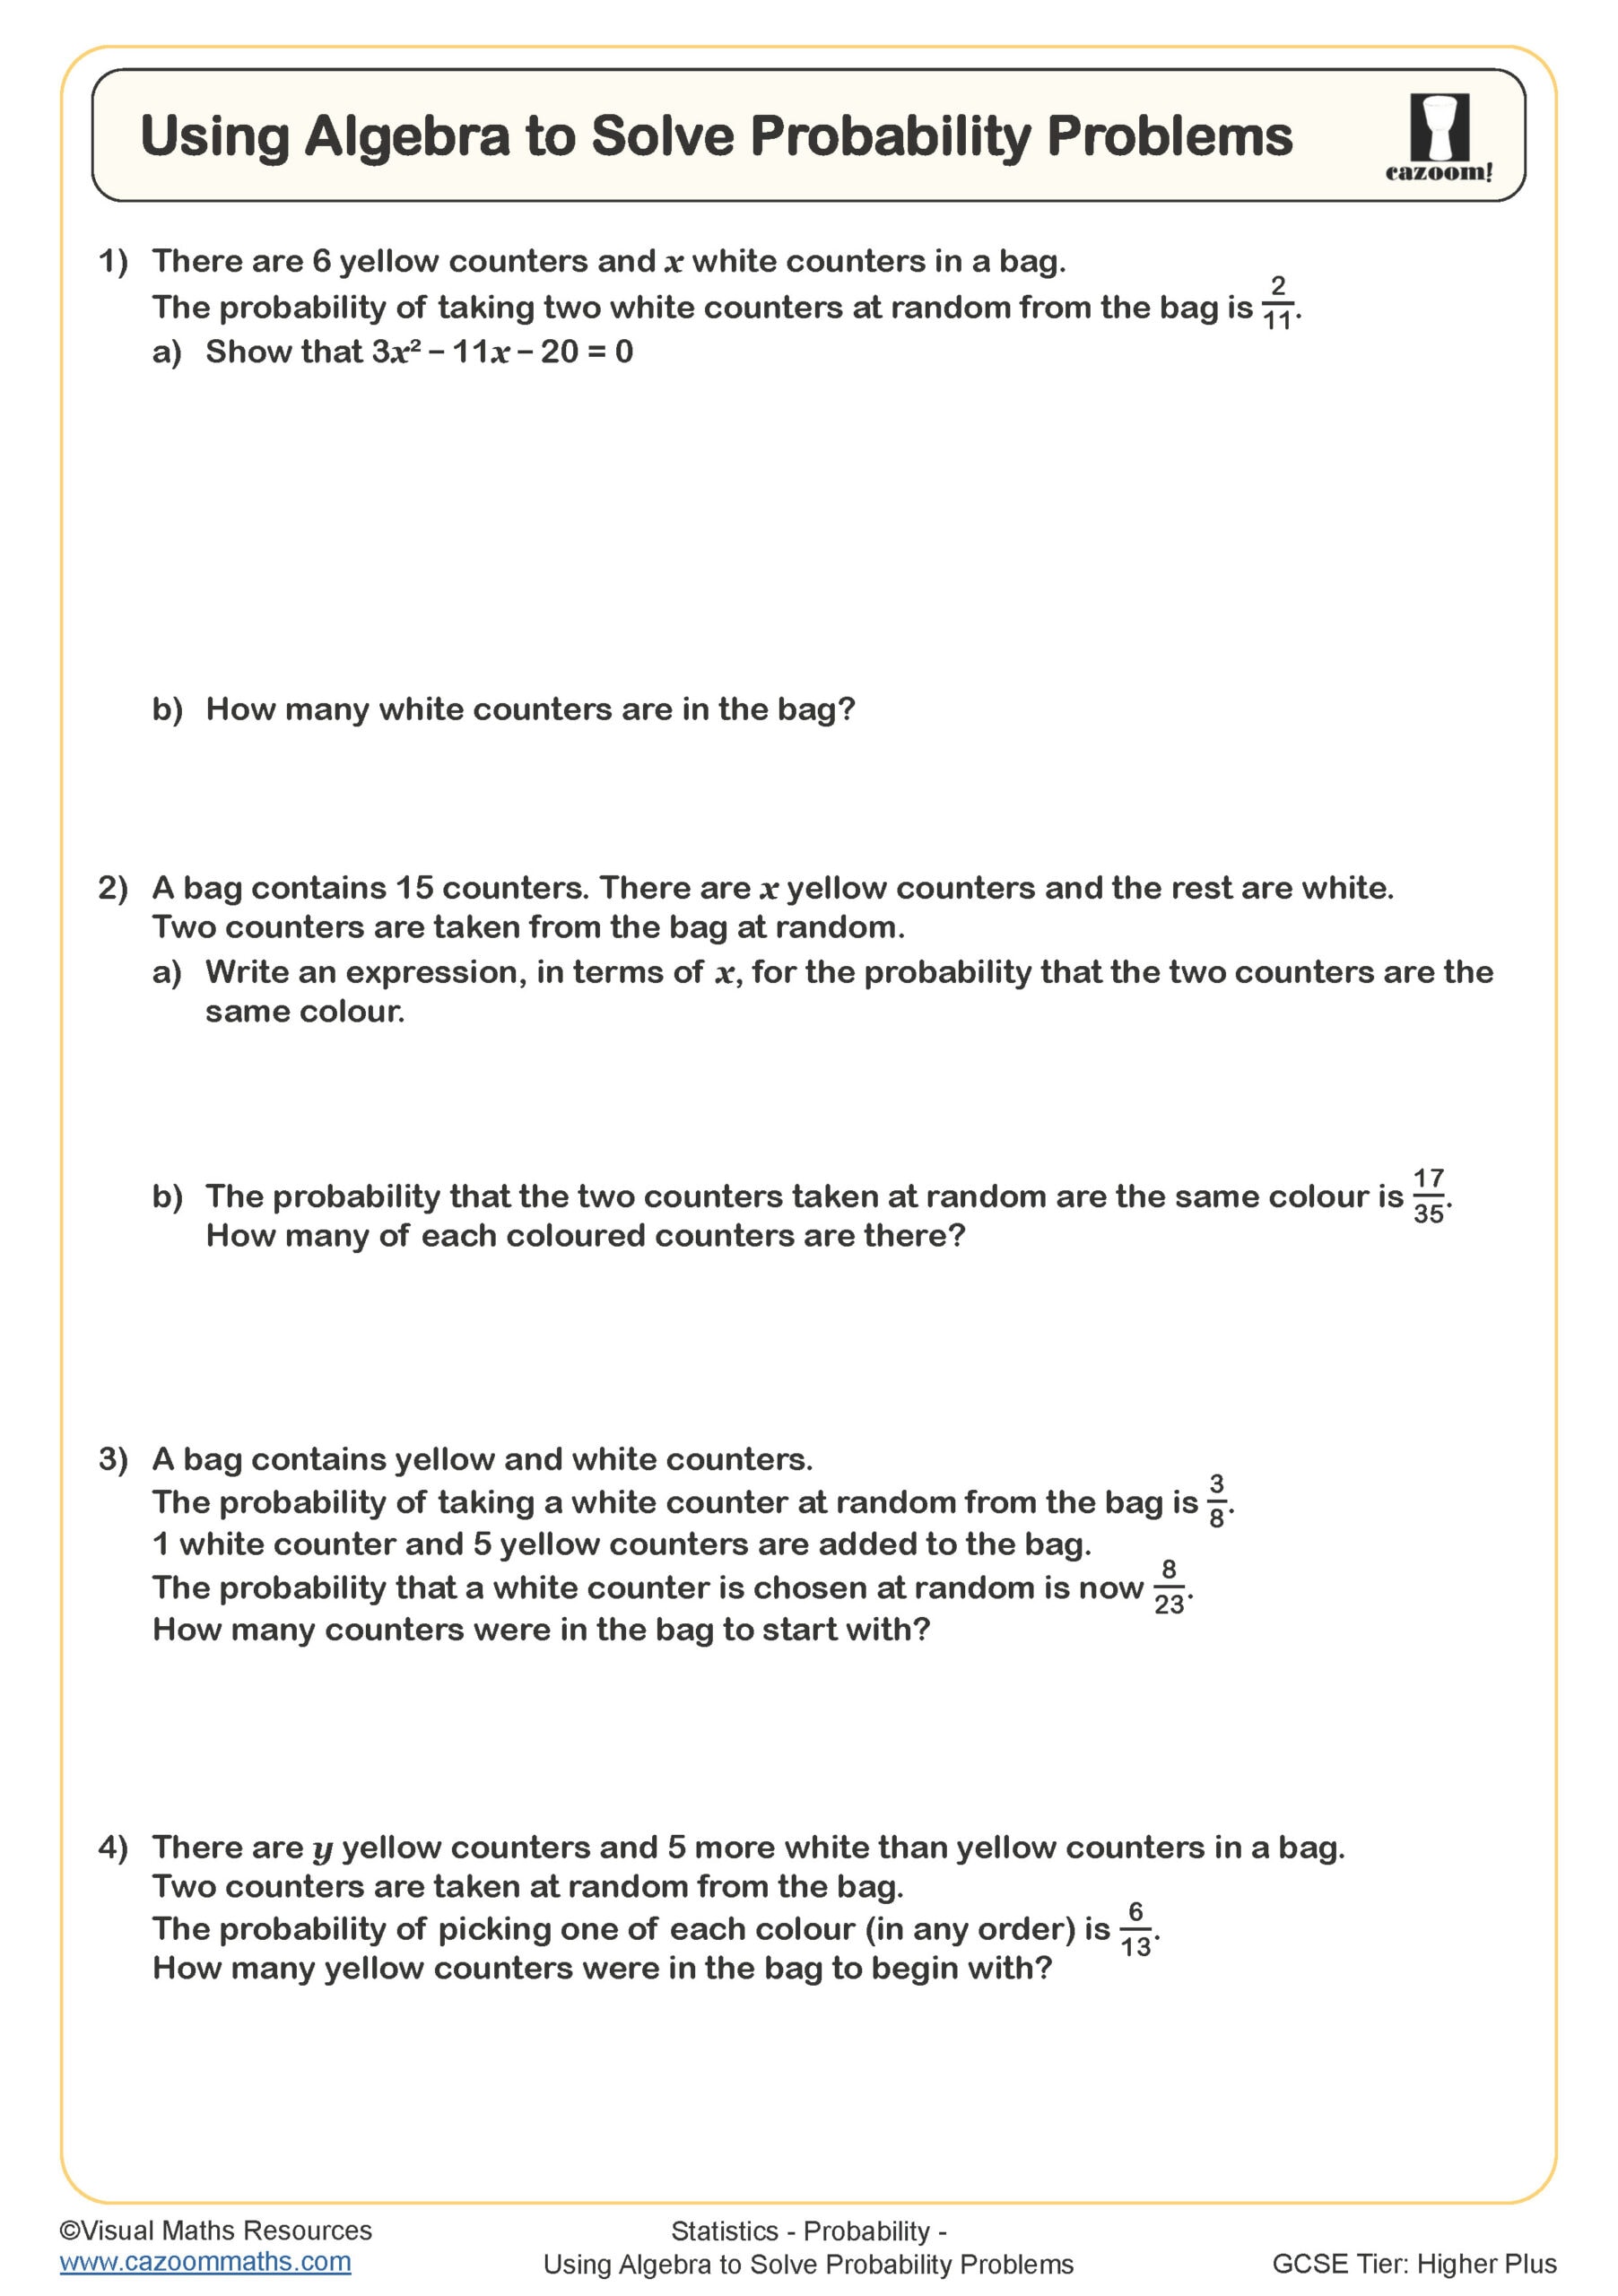
Using Algebra to Solve Probability Problems
Year groups: 11
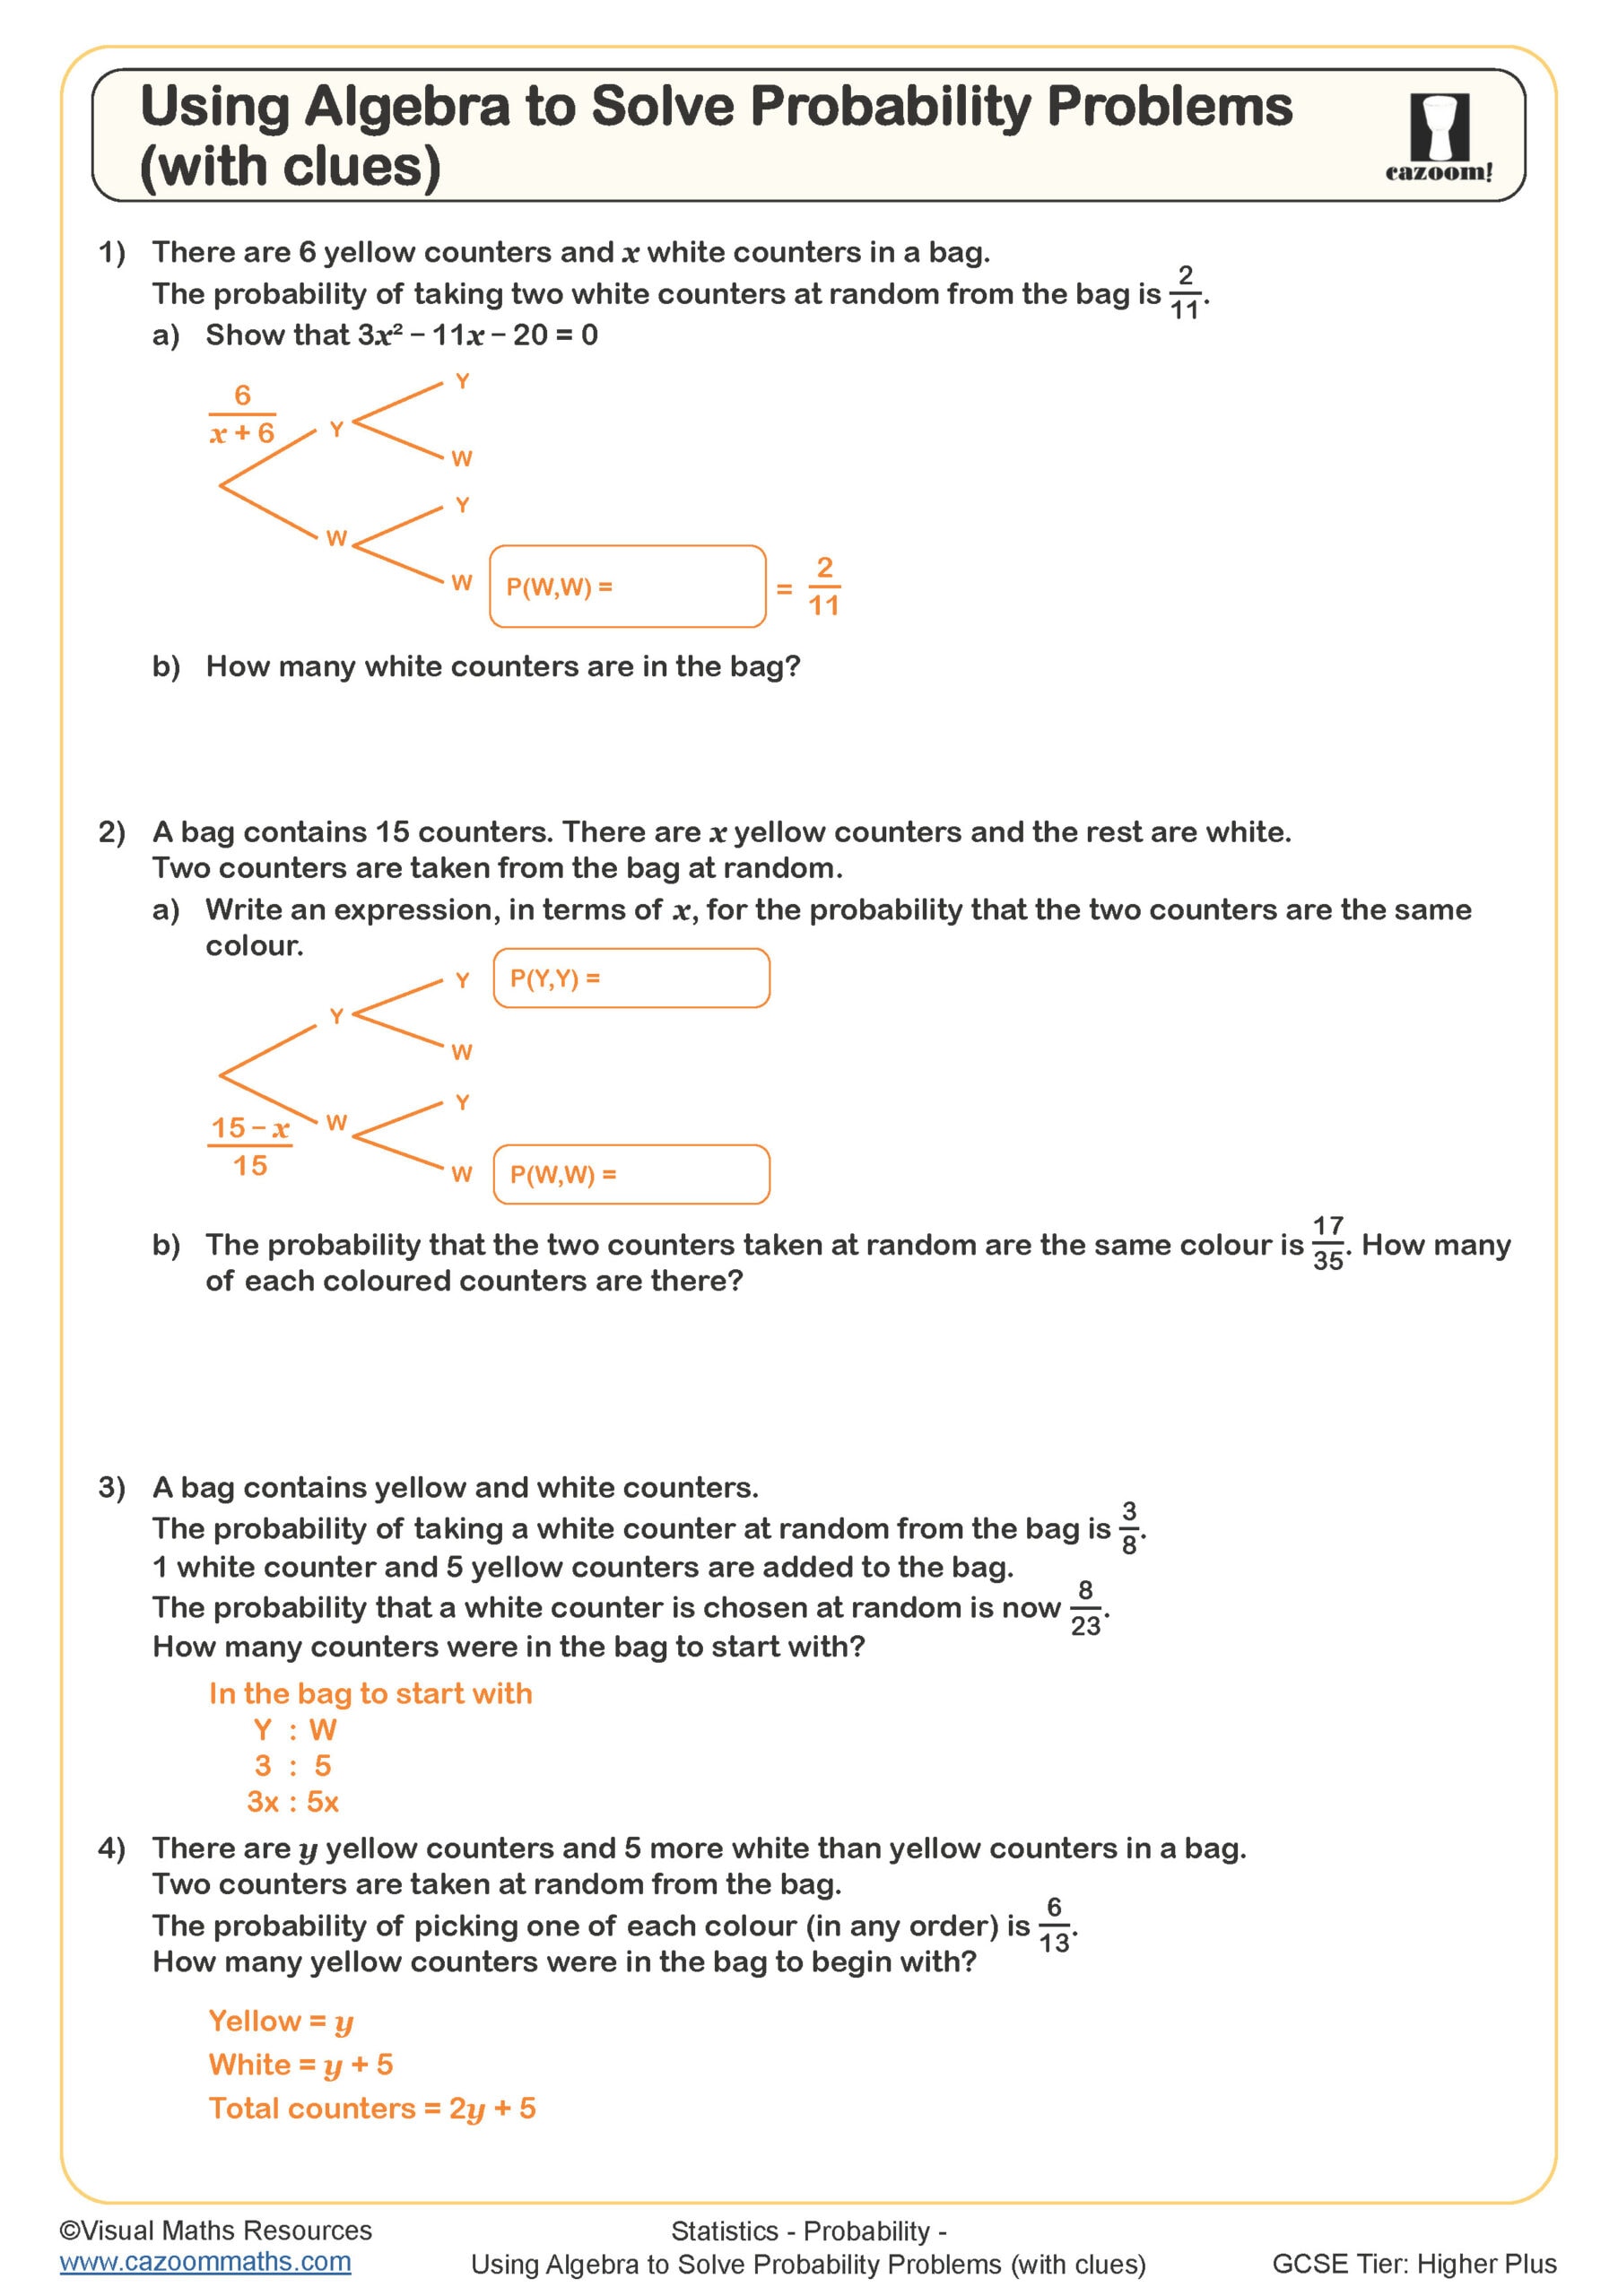
Using Algebra to Solve Probability Problems (with clues)
Year groups: 11
All worksheets are created by the team of experienced teachers at Cazoom Maths.
How do you solve the equation for missing values in statistics problems?
To solve the equation involving missing values in statistics, students need to work backwards from the formula. For finding a missing data point when the mean is known, they multiply the mean by the number of values to get the total, then subtract the known values. This reverse thinking applies to problems like 'The mean of five numbers is 12 and four of them are 8, 10, 14, and 15. Find the missing number.'
Students often make errors by adding when they should subtract, or forgetting that the number of values changes if an item is added or removed from the dataset. Mark schemes expect clear algebraic working, showing how the total was calculated before isolating the unknown. Teachers notice this skill appears regularly in GCSE questions worth 2-3 marks, where students must form and solve an equation from statistical information rather than simply calculating from given data.
Which year groups cover statistics in the maths curriculum?
Statistics appears throughout the National Curriculum from Key Stage 2, where Year 5 and Year 6 students begin interpreting tables, timetables, and line graphs before moving to calculating mean averages. The topic expands significantly at Key Stage 3 (Years 7-9), introducing median, mode, range, and more sophisticated data representations including scatter graphs and pie charts. At GCSE, students tackle cumulative frequency, box plots, histograms, and probability trees.
The progression builds from reading single values off charts to comparing datasets using multiple measures and making statistical inferences. Year 6 students might find the mean of six numbers, whilst Year 10 students must estimate the mean from grouped frequency tables and use frequency density for histograms. Teachers often use earlier year group worksheets for intervention when GCSE students show gaps in foundational skills like reading scales accurately or understanding what averages actually represent.
What are measures of central tendency and why do they matter?
Measures of central tendency (mean, median, and mode) describe the 'typical' value in a dataset, each offering different insights. The mean sums all values and divides by how many there are, the median is the middle value when ordered, and the mode is the most frequent. Students must understand which measure suits different contexts, recognising that the mean gets distorted by extreme values whilst the median remains robust, and that some datasets have no mode or multiple modes.
These measures underpin evidence-based decision making across STEM fields and everyday life. Climate scientists use median temperatures to track change without skew from heatwaves, medical researchers report mean recovery times in clinical trials, and retailers analyse modal shoe sizes to manage stock. Teachers can connect this to students' own experiences with school attendance data, football league tables, or social media engagement statistics, showing how choosing the wrong measure can mislead or misrepresent the underlying pattern in data.
How do statistics worksheets support progression in data handling?
Statistics worksheets build skills systematically, starting with straightforward calculations before introducing problems where students must extract information from diagrams, deal with grouped data, or solve equations involving statistical measures. The scaffolding typically moves from clear, complete datasets to those requiring estimation or interpretation, then to multi-step problems combining different statistical concepts. Answer sheets allow students to identify exactly where their method broke down, particularly useful when mistakes occur in forming the initial equation or misreading scales.
These resources work effectively for differentiated practice, where higher-attaining students tackle problems with missing frequencies or compare distributions whilst others consolidate finding averages from lists. Teachers use them for targeted intervention when marking reveals common errors like confusing mean and median, for homework to reinforce classwork on new diagram types, or for paired work where students check each other's calculations against the answers. The variety of question styles mirrors exam formats, preparing students for the range of statistical reasoning they'll encounter in assessments.